Part:BBa_K325909:Experience
This experience page is provided so that any user may enter their experience using this part.
Please enter
how you used this part and how it worked out.
Application and characterisation of BBa_K325909
[http://2015.igem.org/Team:Glasgow Glasgow team, 2015]
Re-characterisation
We have re-sequenced the biobrick K325909 and identified 6 mismatches between the luxCDABEG DNA sequences in the iGEM registry page and on the distribution plate. Therefore, we update the sequence of K325909 and report changes in 6 nucleotide locations as follows:
| Gene | Mutation |
|---|---|
| luxC | 3370 T>A |
| luxC | 3424 T>A |
| luxC | 3826 T>C |
| luxD | 5259 T>C |
| luxB | 7052 C>T |
| luxB | 7562 C>T |
RBS optimisation
In order to optimise bioluminescence in E. coli we have rearranged lux operon and placed each gene under the B0032 ribosome binding site. To take the step further, we have designed RBS library (BBa_K1725301 - BBa_K1725332) for each lux gene and assembled different libraries together to generate new optimised lux operon.
We successfully incorporated 32 different BioBrick RBS variants upstream of each of the lux genes by PCR, and then combined the different libraries together by BioBrick assembly. Firstly, we have created RBS libraries for luxABG and luxCDE assemblies and tested them separately for the translation initiation efficiency. We then generated strain with luxABGCDE (BBa_K1725352) in one plasmid consisting of luxABG (BBa_K1725350) and luxCDE (BBa_K1725351) constructs that gave colonies the highest intensity of bioluminescence. When compared to BBa_K325909, our strain co-transformed with BBa_K1725350 and BBa_K1725351 was brighter than Cambridge team‘s strain. For more details see our [http://2015.igem.org/Team:Glasgow/Description RBS library] page.

Figure 1. Comparison of BBa_K325909 strain (right) and BBa_K1725350/BBa_K172351 colony (left).
[http://2016.igem.org/Team:Cardiff_Wales/mKeima Cardiff_Wales Team 2016]
Alteration of Colour Output
In biological imaging the output of light at multiple wavelengths can be advantageous to provide alternate options for measurement. Therefore we aimed to design a biobrick that would cause a wavelength-shift in the light output from the LUXoperon. <p>We took the LUXoperon supplied with the 2016 Part distribution, K325909 K325909 and used HiFi assembly to introduce the RFP variant mKeima to the 3’ end of the LUXoperon.

Figure 1. Arrangement of LUXoperon:mKeima fusion
We have submitted this sequenced biobrick BBa_K2060002 to the registry. More details of our characterization of BBa_K2060002 can be found on our [http://2016.igem.org/Team:Cardiff_Wales/mKeima Wiki].
Early Characterisation
We had limited success in characterization of this biobrick. Even though the part sequence is correct and we were able to show a blue light output, we did not demonstrate the hoped for red light output.
 However we do not rule out the usage of this biobrick in the future. Our evidence shows that LUXoperon is robustly expressed but that maintenance of mKeima expression is non-trivial. We also found this with our attempts to express mKeima as an individual protein in the biobrick BBa_K1135001.
<p>Therefore an exciting challenge for future iGEM teams will be to trouble shoot the expression of the entire LUXoperon-mKeima biobrick. The potential red light output will be a valuable tool in the use of bioluminescent bacteria in synthetic biology.
[http://2017.igem.org/Team:NTNU_Trondheim Team NTNU Trondheim 2017]
Characterisation
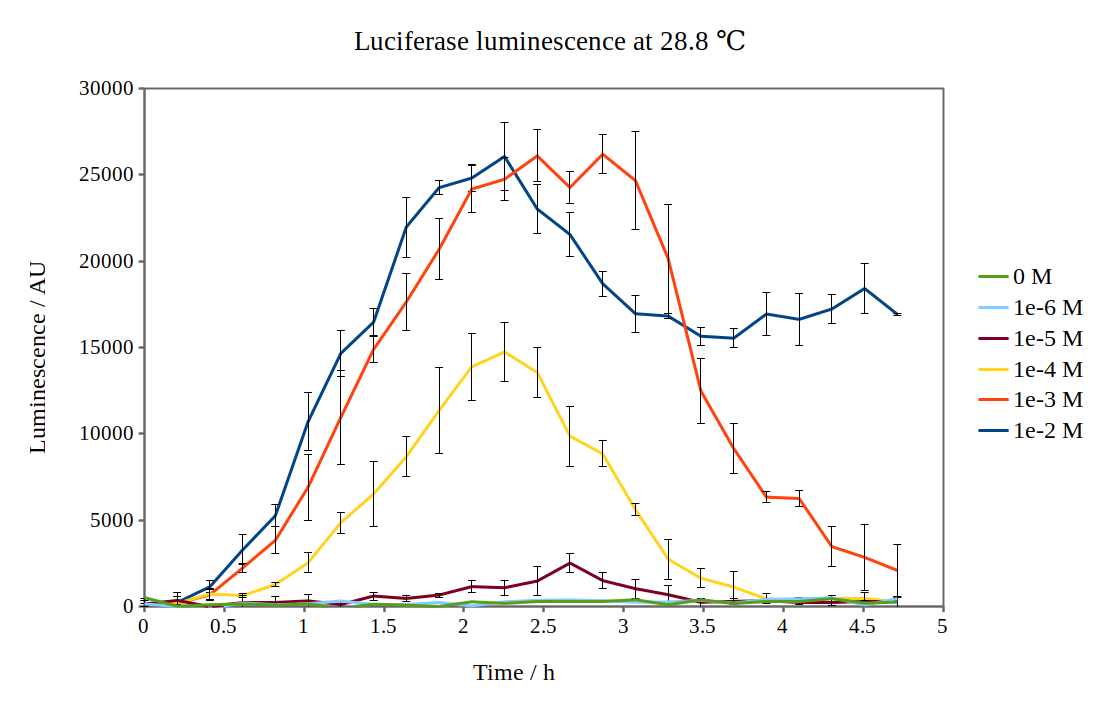
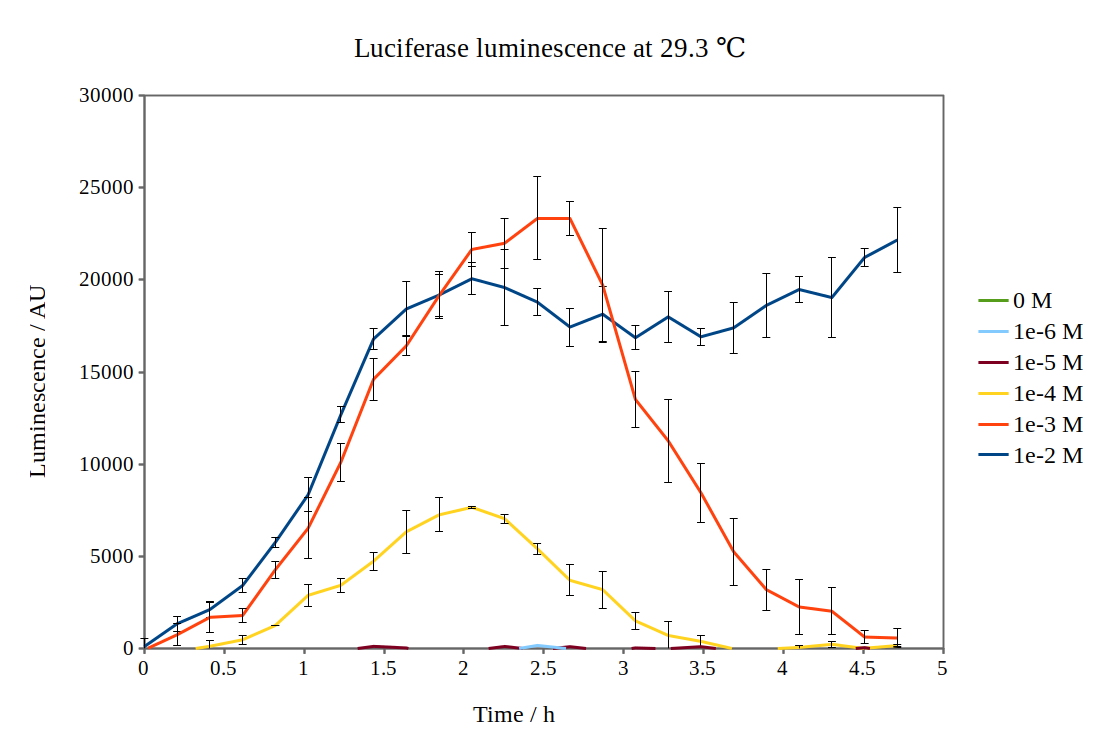
We have improved the characterisation of the biobrick BBa_K325909 by using the lux operon as a reporter for our arabinose-inducible system. By looking at the previous characterisation results of BBa_K325909, we thought it would work reasonably with DH5α™ competent E. coli cells and 37 °C incubation temperature. No observable luminescence was detected with 0.01 M arabinose inducer concentration at any time after induction, so we decided to characterise the biobrick by measuring the luminescence from the lux operon at different arabinose concentrations and temperatures. We did this for four different temperatures (24.0 °C, 28.8 °C, 29.3 °C and 33.4 °C) and six different arabinose concentrations using a Tecan M200 plate reader. As the machine could only perform heating and not cooling, it was challenging to measure at temperatures below 29 °C. As no luminescence was detected at 37 °C, these graphs are not included. Results are shown below:
By looking at how luciferase luminescence from the lux operon developed with time after induction by arabinose, we established that a temperature of 29 °C was optimal. This can be seen in the graph below:
Applications of BBa_K325909
|
[http://2012.igem.org/Team:Peking Peking 2012 iGEM team] |
<p>We successfully constructed light communication system using this part-luxbrick, and it was the very first time that cells were able to response to very dim bio-luminesence emitted from luxbrick. Also we made supplementary characterization of it.
Figure 1. The treatment to each group (upper) and resulted responses of light sensing cell (lower) This photo shows the light emitting cell transformed with luxbrick exploited in our light-communication system. 
Figure 2. TOP10 cells transformed with luxbrick from Cambridge 2010 iGEM team Also we made a short video to show the time course of our light communication system. See the video please click [http://www.youtube.com/watch?v=PCORfy8gJxM&feature=player_embedded here] See the detail of our light communicaiton system, please click [http://2012.igem.org/Team:Peking/Project/Communication here] We want to express our gratitude to Cambridge 2010 iGEM team for enabling us to realize cell-cell communication through light. |
User Reviews
| [http://2012.igem.org/Team:UC_Chile Team UC_Chile]
As a part of our project, we set out to investigate the conditions which affect the output of the LuxBrick. As we are using various elements from this Biobrick, we believe that is cornersome to know how we may increase its output by modifying the conditions that affect its behaviour. We set out to understand diverse factors that could be influencing the total bioluminescence yield of the brick. Some of them have direct relation with some of the aspects of our project. These factors are: Glucose concentration, Growth state at time of induction, Cell mass and Temperature. You can read the fundamentalisms of the experiment and our interpretation of the results [http://2012.igem.org/Team:UC_Chile/Results/LuxBrick here]. Here you'll find detailed the [http://2012.igem.org/Team:UC_Chile2/Protocols#Characterization_Protocols characterization methods] we used in this experiment. Glucose concentration in media
Growth state at-time-of-induction
Cell mass (Optical Density)
Growth temperature
|
|
•••
[http://2012.igem.org/Team:Fudan_Lux 2012iGEM team Fudan_Lux] |
<P>Growth curve of K325909
In 2012 iGEM competition we measured growth curve of K325909 in a E.coli strain dH5α.
The curve shows that induced by the arabinose, the bacteria growth Check the RAW data of measurement. |
|
••••
[http://2012.igem.org/Team:Peking/Project/Communication Peking 2012 iGEM team] |
We successfully constructed light communication system using this part-luxbrick, and we made supplementary characterization of it.
Figure 1. TOP10 cells harboring the luxbrick were cultured in LB medium and induced with L-arabinose at 10-3M. 10 hours after induction, the glowing cells were measured for spectrum using SHIMADZU RF5301PC Spectrofluorophotometer. (Peking iGEM 2012)
|
UNIQ2c0181398074f940-partinfo-0000000C-QINU UNIQ2c0181398074f940-partinfo-0000000D-QINU
Group
NUS_Singapore 2019
Summary and Uploads
Team NUS Singapore 2019 has contributed additional characterization data for biobrick BBa_K325909 by characterizing this biobrick in two different E. coli strains: MG1655 and 10-beta. To demonstrate the functionality of BBa K325909, the team added arabinose concentrations of 0.2% and 2% proposed by earlier iGEM teams to induce both 10-beta and MG1655 at late exponential phase, at an OD600 of approximately 0.9. Right after the induction, the 96-well plate was read for 20h continuously at 29°C in a microplate reader.
Interestingly, the team observed that for both arabinose concentrations, MG1655 produced luminescence at a higher intensity compared to 10-beta over time. Additionally, the duration of luminescence production was approximately twice as long in MG1655 compared to 10-beta when 0.2% arabinose was added. Looking at the growth curves of both strains induced with 0.2% and 2% arabinose, it appears that the maximum growth of each strain does contribute to the observed luminescence graphs.

Figure 1: Growth curve of 10-beta and MG1655 right after 0.2% arabinose induction at 0h

Figure 2: Total luminescence produced by 10-beta and MG1655 right after 0.2% arabinose induction at 0h

Figure 3: Growth curve of 10-beta and MG1655 right after 2% arabinose induction at 0h

Figure 4: Total luminescence produced by 10-beta and MG1655 right after 2% arabinose induction at 0h
Taken together, these results show that MG1655, which has never been used to characterize BBa_K325909 activity previously, demonstrates enhanced and prolonged luminescence production compared to the commonly used strain - 10-beta; and this is likely due to a higher maximum growth in the former strain.


