Difference between revisions of "Part:BBa K4150006"
Jacky CHIN (Talk | contribs) |
Jacky CHIN (Talk | contribs) |
||
| (50 intermediate revisions by the same user not shown) | |||
| Line 30: | Line 30: | ||
[[File:T--Mingdao--2022--6-4.jpeg|800px|center]] | [[File:T--Mingdao--2022--6-4.jpeg|800px|center]] | ||
<br> | <br> | ||
| − | <span style="color:#00000000">This</span>T7 bacteriophage genome was edited with the BioBrick of T7P-g10.RBS-His-Ova-T7T in the end of T7 gene 10 using the T7Select® 415-1 Cloning Kit (Merck Millipore) according to the manufacturer’s instruction. | + | <span style="color:#00000000">This</span>T7 bacteriophage genome was edited with the BioBrick of T7P-g10.RBS-His-Ova-T7T in the end of T7 gene 10 using the T7Select® 415-1 Cloning Kit (Merck Millipore) according to the manufacturer’s instruction. To select the correct T7 phage genome inserted with the BioBrick, the plaque assay on LB agar plate covered by the lawn of E. coli DH5alpha was performed. Several phages from the plaques were subjected to phage genomic DNA extraction and PCR with corresponding primers (Fig. 2). |
| + | <br> | ||
| + | [[File:T--Mingdao--2022--6-5.png|600px|left]] | ||
| + | <br><br><br><br><br> | ||
| + | <b>Figure 2 |</b> T7 phage engineering with T7P-g10.RBS-His-Ova-T7T. (A) The plaque assay was conducted on the LB agar plate, where E. coli DH5alpha cells were infected with the engineered phages. (B) The gDNAs of phages from 4 plaques along with wild-type T7 phages were extracted and subjected to PCR with the indicated primer pairs. PCR product sizes were shown in the figure. DNAs were run electrophoresis on 1% agarose gel with 1kb marker. | ||
| + | <br> | ||
<br> | <br> | ||
<br> | <br> | ||
| − | |||
==<b>Characterization of the Elements</b>== | ==<b>Characterization of the Elements</b>== | ||
====<p style="color:#336699;">T7 promoter, RBS & T7 terminator</p>==== | ====<p style="color:#336699;">T7 promoter, RBS & T7 terminator</p>==== | ||
| + | <span style="color:#00000000">This</span>We retransformed E. coli BL21 with an existing part of T7-RBS-RFP-Tr/pSB1C3 ([[Part:BBa_K3431048]]). Red colors were clearly seen in LB agar plate and LB liquid culture containing 1mM of IPTG compared to non-IPTG as controls after an overnight culture (Fig. 3), indicating the gene of RFP can be driven by the functional T7 promoter/terminator with a RBS. | ||
| + | |||
| + | <br> | ||
| + | [[File:T--Mingdao--2022--6-7.jpeg|500px|left]] | ||
| + | <br><br> | ||
| + | [[File:T--Mingdao--2022--2-6-8.png|430px]] | ||
| + | <br><br><br> | ||
| + | |||
| + | <b>Figure 3 |</b> IPTG induction of RFP expression driven by T7 promoter in E. coli BL21 carrying T7-RBS-RFP-Tr on LB agar plate (A) or LB broth (B) supplemented with 34 μg/mL of chloramphenicol. IPTG concentration is 1mM. | ||
| + | |||
| + | <br><br> | ||
| + | <span style="color:#00000000">This</span>Furthermore, the transformed E. coli BL21 runs in a kinetic mode for 24 hr in the LB broth with or without IPTG. The RFP levels were read by Synergy H1 Hybrid Multi-Mode Reader - BioTek Instruments (Agilent Technologies, Inc.) at an excitation and emission wavelength of 584 nm and 607 nm, respectively. Regardless of some interfering background values in LB media were detected in the first 3 hr, it’s clear that the T7 promoter activities began to be induced around 2 hr and became significantly strong to a level of 1.5-fold induction compared to the controls without IPTG at 12 hr (Fig. 4). The data were consistent with the results seen by naked eyes (Fig. 3). | ||
| + | <br><br><br> | ||
| + | [[File:T--Mingdao-2022 Engineering Success photo 4.png|500px|left]] | ||
| + | |||
| + | <br><br><br><br><br><br><br><br><br><br><br><br><br><br> | ||
| + | |||
| + | <b>Figure 4 |</b> The plasmid of T7-RBS-RFP-Tr/pSB1C3 was transferred into E. coli BL21. Two clones were picked up for IPTG induction assay for 18 hr. RFP levels were read every one hour at an ex/em = 584/607. | ||
| + | <br><br><br><br> | ||
====<p style="color:#336699;">Enhanced g10.RBS with a T7 gene 10 leader sequence</p>==== | ====<p style="color:#336699;">Enhanced g10.RBS with a T7 gene 10 leader sequence</p>==== | ||
| − | <span style="color:#00000000">This</span>In order to increase the expression of protein of interest, we added a canonical strong RBS ([[Part:BBa_B0034]]) with a leader sequence | + | <span style="color:#00000000">This</span>In order to increase the expression of protein of interest, we added a canonical strong RBS ([[Part:BBa_B0034]]) with a leader sequence containing a stem loop from the T7 bacteriophage gene 10 (g10.RBS, [[Part:BBa_K4150000]]). |
| Line 54: | Line 77: | ||
<br><br> | <br><br> | ||
| − | <span style="color:#00000000">This</span>We replaced the RBS with g10.RBS in BioBrick Part:BBa_K3431048 (T7-RBS-RFP-Tr) to create an improved BioBrick Part:BBa_K4150002 (T7-g10.RBS-RFP-Tr). These two plasmids were transformed into E. coli BL21. In the presence of IPTG, colonies on the LB agar plate and cultures in the LB broth both showed darker red colors for RFP gene expression driven by T7 promoter with g10 leader sequence compared to the original RBS without g10 leader sequence (Fig. | + | <span style="color:#00000000">This</span>We replaced the RBS with g10.RBS in BioBrick [[Part:BBa_K3431048]] (T7-RBS-RFP-Tr) to create an improved BioBrick [[Part:BBa_K4150002]] (T7-g10.RBS-RFP-Tr). These two plasmids were transformed into E. coli BL21. In the presence of IPTG, colonies on the LB agar plate and cultures in the LB broth both showed darker red colors for RFP gene expression driven by T7 promoter with g10 leader sequence compared to the original RBS without g10 leader sequence (Fig. 5). However, the E. coli BL21 with T7-g10.RBS-RFP-Tr had a higher background level in the absence of IPTG. |
<br> | <br> | ||
| Line 60: | Line 83: | ||
[[File:T--Mingdao--2022 Registry 02.png|950px|center]] | [[File:T--Mingdao--2022 Registry 02.png|950px|center]] | ||
| − | <b>Figure | + | <b>Figure 5 |</b> The plasmids as indicated were transformed into E. coli BL21. The E. coli were grown on LB agar plate supplemented with 20 μg/mL of chloramphenicol and 1mM of IPTG. One of the colonies was cultured in LB broth with 34 μg/mL of chloramphenicol in the absence or in the presence of 1mM of IPTG. Inset panel: The plates were observed under a blue LED light box. |
<br><br> | <br><br> | ||
| − | <span style="color:#00000000">This</span>Furthermore, the transformed E. coli with T7-g10.RBS-RFP-Tr compared to T7-RBS-RFP-Tr expressed RFP at faster and increased (up to 2.5-fold) fluorescence intensity levels in a time-dependent manner (Fig. | + | <span style="color:#00000000">This</span>Furthermore, the transformed E. coli with T7-g10.RBS-RFP-Tr compared to T7-RBS-RFP-Tr expressed RFP at faster and increased (up to 2.5-fold) fluorescence intensity levels in a time-dependent manner (Fig. 6). The above data demonstrated the g10 leader sequence in front of RBS can significantly enhance gene expression. |
<br> | <br> | ||
| Line 72: | Line 95: | ||
<br><br><br><br><br><br><br><br><br><br><br> | <br><br><br><br><br><br><br><br><br><br><br> | ||
| − | <b>Figure | + | <b>Figure 6 |</b> The plasmids as indicated were transformed into E. coli BL21. The E. coli were grown in LB broth supplemented with 34 μg/mL of chloramphenicol and 1mM of IPTG for 18 hours. The RFP expression levels were read at ex/em = 584/607 nm in a kinetic mode by Synergy H1 Hybrid Multi-Mode Reader - BioTek Instruments (Agilent Technologies, Inc.). The values of fluorescence intensity were presented by the data with IPTG induction minus the data without induction as background levels. |
<br><br> | <br><br> | ||
| + | ==<b>Verification of the Engineered Bacteriophage</b>== | ||
| − | |||
====<p style="color:#336699;">Reporter - T7 phage::GFP</p>==== | ====<p style="color:#336699;">Reporter - T7 phage::GFP</p>==== | ||
| + | <span style="color:#00000000">This</span>To verify the function of the engineered phage, we engineered T7 phage to carry a GFP reporter gene in the same context as T7 phage::OVA. The mouse intestinal commensal E. coli isolates were grown to an OD around 0.6 in the M9 minimal medium supplemented with casamino acids (0.2%), D-glucose (0.3%), vitamin B1 (1 mg/ml), MgSO4 (0.2 mM), CaCl2 (0.1 mM)<ref>Vinay M, Franche N, Grégori G, Fantino JR, Pouillot F, Ansaldi M. Phage-Based Fluorescent Biosensor Prototypes to Specifically Detect Enteric Bacteria Such as E. coli and Salmonella enterica Typhimurium. PLoS One. 2015 Jul 17;10(7):e0131466. doi: 10.1371/journal.pone.0131466. PMID: 26186207; PMCID: PMC4506075.</ref>, followed by infected with the engineered phages at a MOI of 5 for 2 hr at 37°C. The data were read for OD600 and GFP at an ex/em = 483/513 nm every 10 min. Compared to wild-type T7 phage infection, the engineered phage::T7P-g10.RBS-His-GFP-T7T can infect and kill the E. coli in a similar way (Fig. 7). In addition, the engineered phages are able to transfer the GFP reporter cassette into E. coli and make GFP production at the beginning of 40 min (Fig. 8), which is consistent with the time starting to lyse the bacteria (Fig. 7). | ||
| + | <br> | ||
| + | [[File:T--Mingdao--2022--6-12.png|500px|left]] | ||
| + | |||
| + | |||
| + | <br><br><br><br><br><br><br><br><br><br><br> | ||
| + | |||
| + | <b>Figure 7 |</b> The infection of the wild-type and the engineered T7 phages on a mouse intestinal commensal E. coli. The E. coli were growing to an OD around 0.6 in the wells of a 96-well plate (Falcon® 96-well Black/Clear Flat Bottom) at 37°C with 200 μl of the supplemented M9 media, followed by the phage (as indicated) infection at a MOI of 5. The values of OD600 were read every 10 min till 2 hr by a microplate reader (Synergy H1 Hybrid Multi-Mode Reader - BioTek Instruments). The growth of E. coli without phages was set as a control. | ||
| + | |||
| + | <br> | ||
| + | [[File:T--Mingdao--2022--6-13.png|500px|left]] | ||
| + | |||
| + | |||
| + | <br><br><br><br><br><br><br><br><br><br><br> | ||
| + | |||
| + | <b>Figure 8 |</b> The production of GFP by the engineered T7 phage::T7P-g10.RBS-His-GFP-T7T. The E. coli were growing to an OD around 0.6 in the wells of a 96-well plate (Falcon® 96-well Black/Clear Flat Bottom) at 37°C with 200μl of the supplemented M9 media, followed by the phage (as indicated) infection at a MOI of 5. The values of fluorescence intensity were read at an ex/em = 483/513 nm every 10 min till 2 hr by a microplate reader (Synergy H1 Hybrid Multi-Mode Reader - BioTek Instruments). The background levels were measured with the controls of E. coli without phages or infected with wild-type phages. | ||
| + | |||
| + | <br><br> | ||
====<p style="color:#336699;">Vaccine - T7 phage::OVA</p>==== | ====<p style="color:#336699;">Vaccine - T7 phage::OVA</p>==== | ||
| + | <span style="color:#00000000">This</span>To test the Ova protein expression by the engineered phage, the isolated BALB/c mouse intestinal commensal E. coli were grown to an OD of 0.6 and infected with T7 phage::T7P-g10.RBS-His-Ova-T7T at a MOI of 5 for 2 hr at 37°C. The bacterial lysates were subjected to SDS-PAGE and Coomassie blue staining. The gel clearly showed a sharp band at the predicted size of a purified chicken ovalbumin protein (~45 kDa) compared to the lysates of E. coli infected with wild-type T7 phages (Fig. 9A). | ||
| + | <span style="color:#00000000">This</span>To quantify the protein concentration produced by the engineered phage carrying Ova gene, 5 x 10<sup>8</sup> cells of the isolated E. coli (OD600 = ~0.6) were infected with 2.5 x 10<sup>9</sup> phages (MOI = 5) for 2 hr at 37°C. The 50 μl of lysates along with a serial dilution of standard of purified ovalbumin proteins were subjected to an ELISA Kit for Ovalbumin (CLOUD-CLONE CORP., Product No. CEB459Ge) and performed according to the manufacturer’s instruction. The data were measured at OD450 nm and determined by regression analysis due to the assay is based on the competitive inhibition enzyme immunoassay technique. As shown in the Fig. 9B, the concentration of Ova proteins produced in the E. coli infected with T7 phage::Ova were ~154 ng/ml (OD450 = ~0.89). | ||
| + | <span style="color:#00000000">This</span>Taken together, we successfully created and improved BioBrick parts, as well as engineered T7 phages, which are able to transfer genes (i.e., GFP and Ovalbumin) into mouse intestinal E. coli and produce proteins of interest by the infected E. coli. | ||
| + | <br><br> | ||
| + | [[File:T--Mingdao--2022--6-14.png|700px|left]] | ||
| + | <b>Figure 9 |</b> Ovalbumin protein production by the mouse intestinal E. coli infected with T7 phages::T7-g10.RBS-His-Ova-T7T. (A) 30 ng of total phage-infected bacterial lysates were run on SDS-PAGE with a 4–15% Mini-PROTEAN® TGX™ Precast Protein Gels (Bio-Rad Laboratories, Inc.) and stained with Coomassie Brilliant Blue G-250. The PageRuler™ Prestained Protein Ladder, 10 to 180 kDa (Thermo Fisher Scientific Inc) was used as a marker. (B) 50 μl of the same lysates were also conducted in an ELISA Kit for Ovalbumin (OVA) (Cloud-Clone Corp.) along with a serial dilution of standard Ova protein provided in the kit. The values were read at OD450 and calculated by a formula made by a regression analysis. | ||
| + | <br><br> | ||
| + | |||
| + | ====<p style="color:#336699;">Purification of His-OVA in the mode of phage - E. coli - antigen production</p>==== | ||
| + | <span style="color:#00000000">This</span>To achieve our goal of building up the model antigen of phage ovalbumin induction system (i.e., phage – E. coli – protein production) for the application of vaccine testing, a His tag was fused at the N terminus of ovalbumin. We’d like to know whether the His-ovalbumin can be purified for future application. | ||
| + | |||
| + | <br> | ||
| + | [[File:T--Mingdao--2022--6-10.jpeg|600px|center]] | ||
| + | |||
| + | <br> | ||
| + | <span style="color:#00000000">This</span>The His-ovalbumin protein from the lysates of E. coli DH5alpha infected with T7 phage::OVA was purified by Nickel column through the ÄKTA start protein purification system (Cytiva). The Fig. 10 showed the elutions contain predominantly purified His-ovalbumin proteins with a predicted molecular weight of 45kDa, although some degradation forms or impurities may leave in the elutions. Taken together, the ovalbumin protein in the E. coli infected by T7 phage:OVA can be produced and purified in our system. Therefore, the ovalbumin as a model antigen can be applied in the purified form or as phage-infected bacterial lysates. | ||
| + | |||
| + | <br> | ||
| + | [[File:T--Mingdao--2022--6-11.jpeg|500px|left]] | ||
| + | |||
| + | <br><br><br> | ||
| + | <b>Figure 10 |</b> His-Ovalbumin purification from the phage-infected bacterial lysates. The lysates of E. coli DH5alpha infected with T7 phage::T7-g10.RBS-His-Ova-T7T were purified by Nickel column through the ÄKTA start protein purification system (Cytiva). The protein harvested were analyzed by SDS-PAGE and Coomassie Blue Staining using 4–15% Mini-PROTEAN® TGX™ Precast Protein Gels (Bio-Rad Laboratories, Inc.) PageRuler™ Prestained Protein Ladder was used as a marker. Lane: (1) E. coli control lysates without phage infection, (2) E. coli raw lysates with phage infection, (3) flow-through, (4) total lysates before purification, (5) wash-through, (6) Elution #8, (7) Elution #9, (8) Elution #10, (9) Elution #11. | ||
Latest revision as of 05:33, 20 September 2022
T7P-g10.RBS-His-Ova-T7T
ThisThe chicken ovalbumin (OVA) is a glycoprotein, which is a major component of chicken egg whites, and harbors immunogenic properties in vaccination experiments[1]. The recombinant OVA protein is readily purified in E. coli BL21 system driven by T7 promoter and triggered by IPTG induction. Therefore, it’s considered as one of the model antigens used to study immune responses in animal models.
ThisTo engineer bacteriophage vaccine vector, we chose a T7 phage-based system because it’s one of the well-studied model bacteriophages with rich lab materials and available assay methods such as T7 promoter, IPTG induction in E. coli BL21 strain, in vitro transcription and translation (TXTL) studies, phage genome sequences and engineering tools[2] as well as safe application in clinical trials[3].
Engineering of Bacteriophage
Plasmid Construction
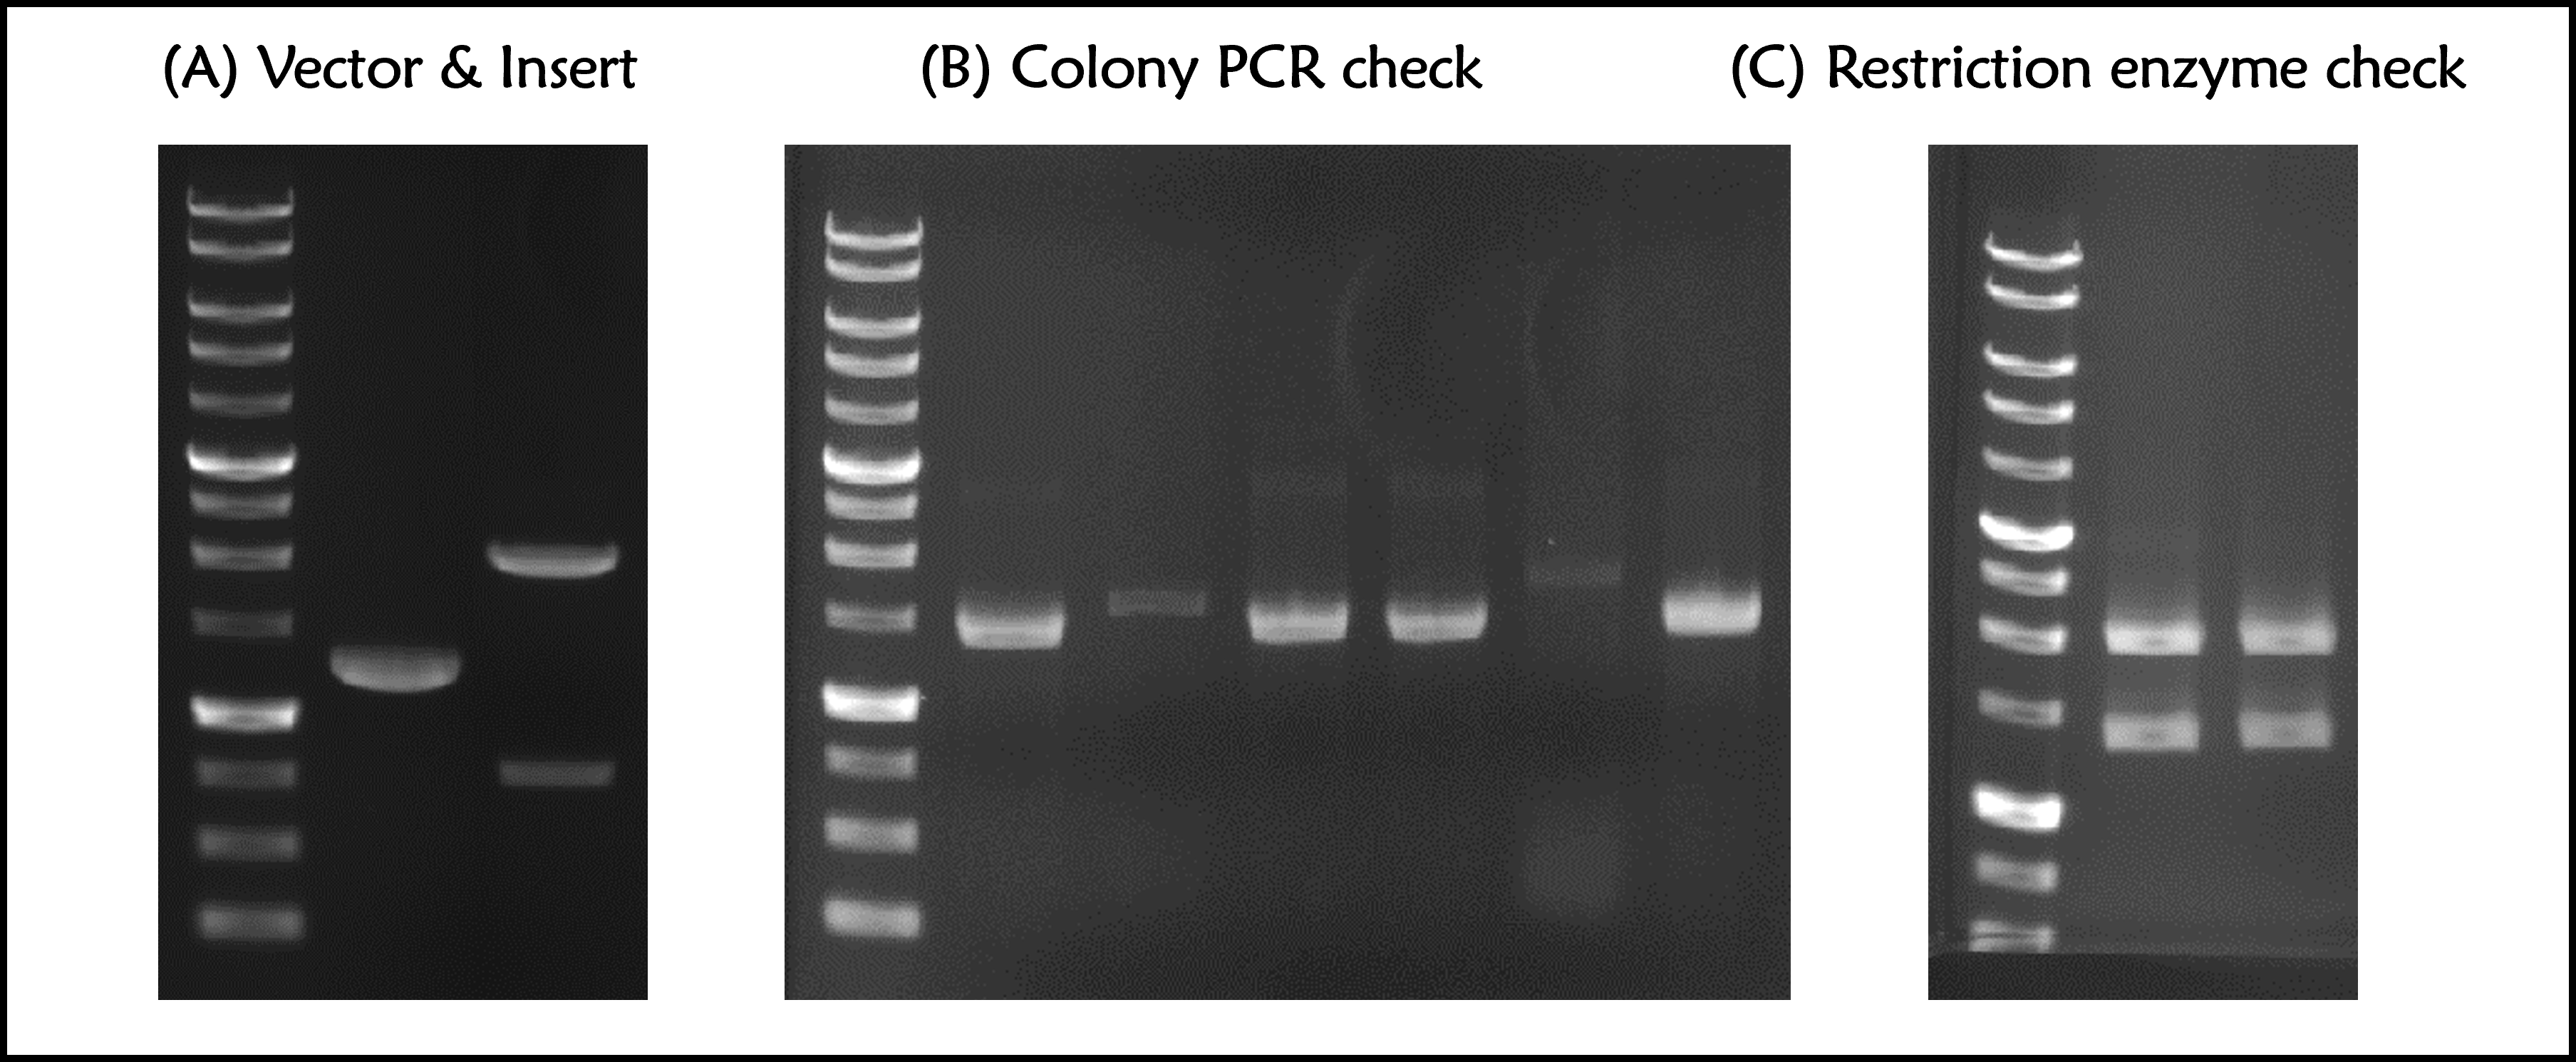
ThisPrior to engineer T7 bacteriophage, we constructed a composite biobrick part composed of T7 promoter from an existing part, a novel enhanced RBS with a g10 leader sequence, Gallus gallus (Chicken) ovalbumin antigen gene with a 6xHis tag, and a T7 terminator. The vector was prepared from Part:BBa_K4150005 as a backbone with a T7 promoter and a T7 terminator by digested with SpeI and HindIII. The insert of g10.RBS-His-Ova was synthesized by Integrated DNA Technologies, Inc., followed by digested with XbaI and HindIII. E. coli DH5alpha competent cells were transformed with the resulting ligation product and checked by colony PCR and restriction enzymes, as well as confirmed by DNA sequencing.
Figure 1 | T7P-g10.RBS-His-Ova-T7T (Part:BBa_K4150006) construction. DNAs were run electrophoresis on 1% agarose gel with 1kb marker. (A) Vector (2148 bp with a 835-bp DNA fragment after cut) and Insert (g10.RBS-His-Ova, 1285 bp) were digested by indicated restriction enzymes before ligation. (B) 6 colonies were subject to colony PCR with VF2 forward primer and Ova reverse primers (PCR product size: 1449 bp). (C) The 2 of plasmid DNAs with a correct PCR product size were extracted and digested by EcoRI and PstI (Product size: 2029 and 1398 bps).
Phage Engineering
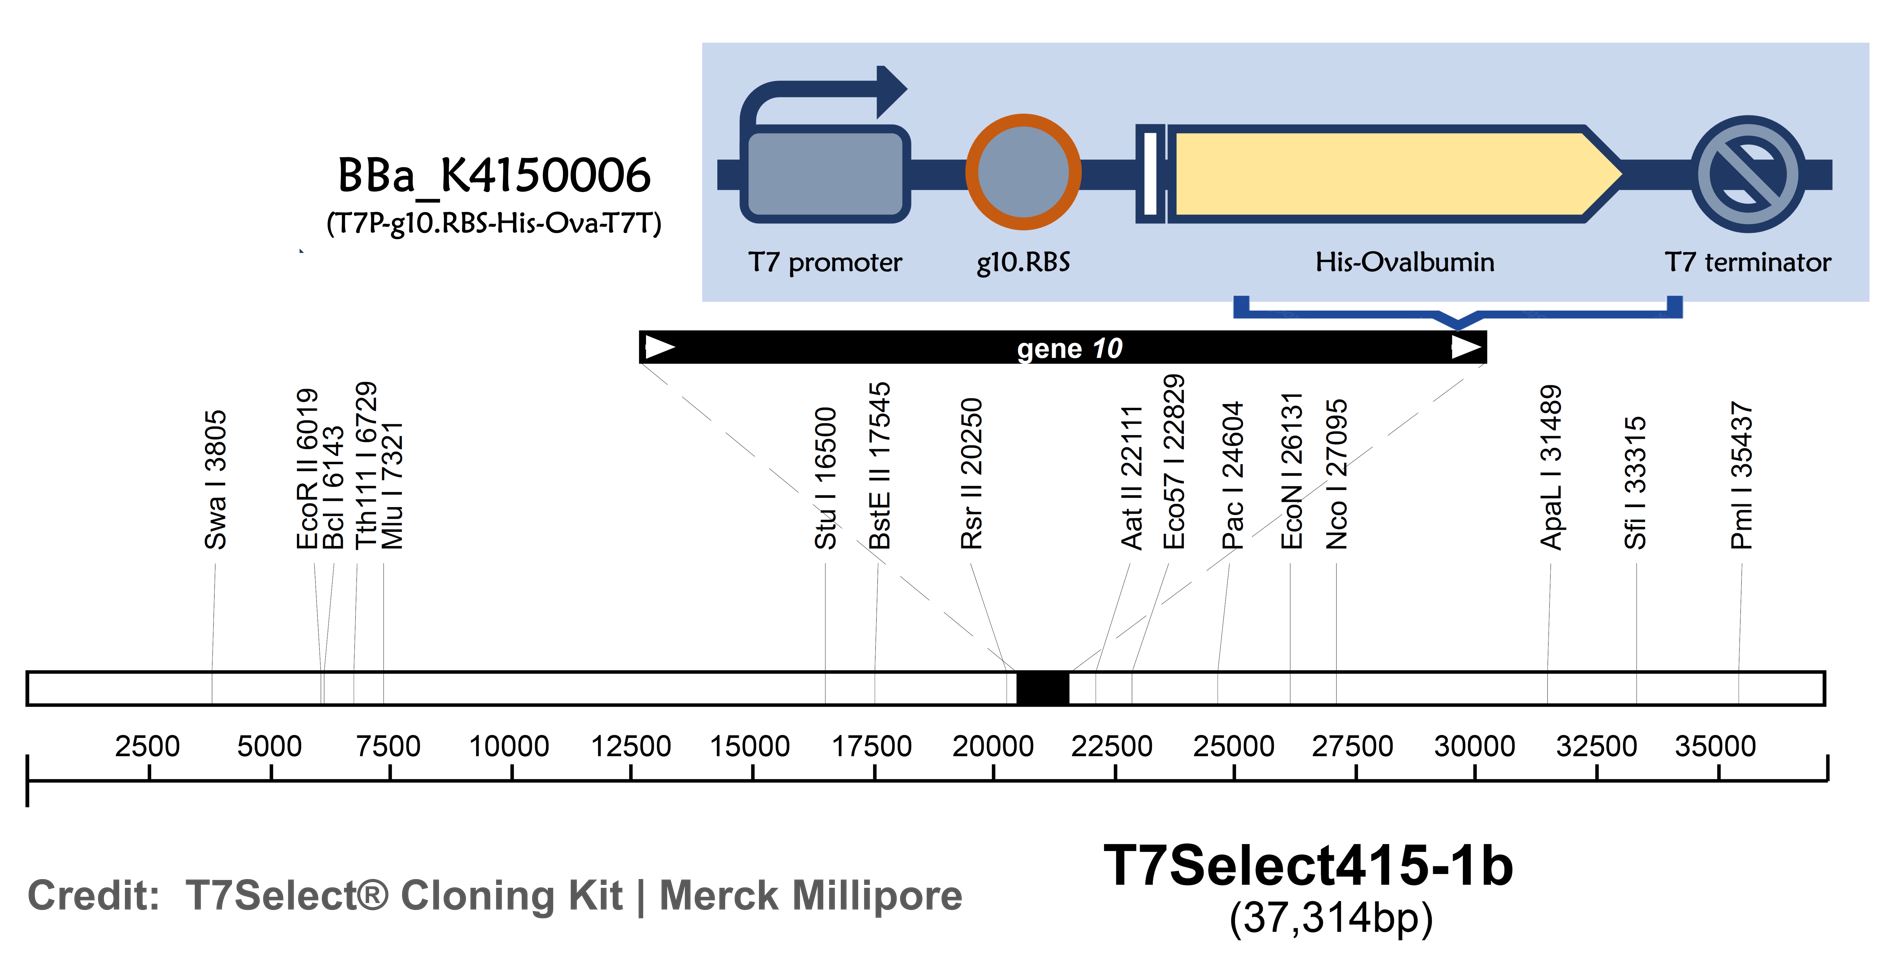
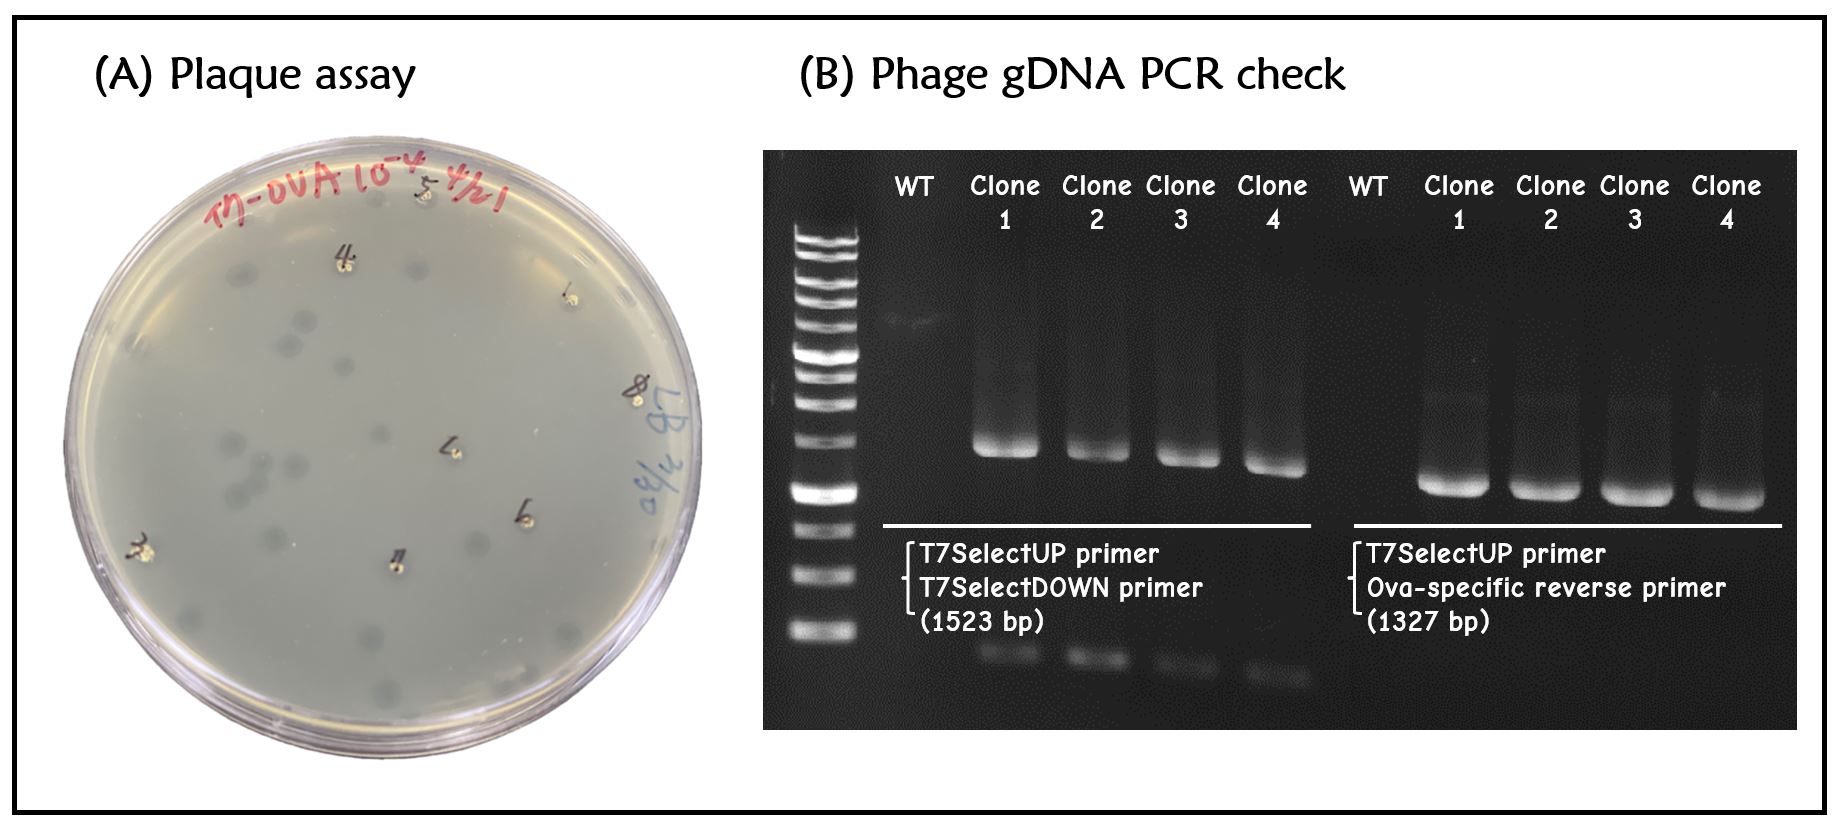
ThisT7 bacteriophage genome was edited with the BioBrick of T7P-g10.RBS-His-Ova-T7T in the end of T7 gene 10 using the T7Select® 415-1 Cloning Kit (Merck Millipore) according to the manufacturer’s instruction. To select the correct T7 phage genome inserted with the BioBrick, the plaque assay on LB agar plate covered by the lawn of E. coli DH5alpha was performed. Several phages from the plaques were subjected to phage genomic DNA extraction and PCR with corresponding primers (Fig. 2).
Figure 2 | T7 phage engineering with T7P-g10.RBS-His-Ova-T7T. (A) The plaque assay was conducted on the LB agar plate, where E. coli DH5alpha cells were infected with the engineered phages. (B) The gDNAs of phages from 4 plaques along with wild-type T7 phages were extracted and subjected to PCR with the indicated primer pairs. PCR product sizes were shown in the figure. DNAs were run electrophoresis on 1% agarose gel with 1kb marker.
Characterization of the Elements
T7 promoter, RBS & T7 terminator
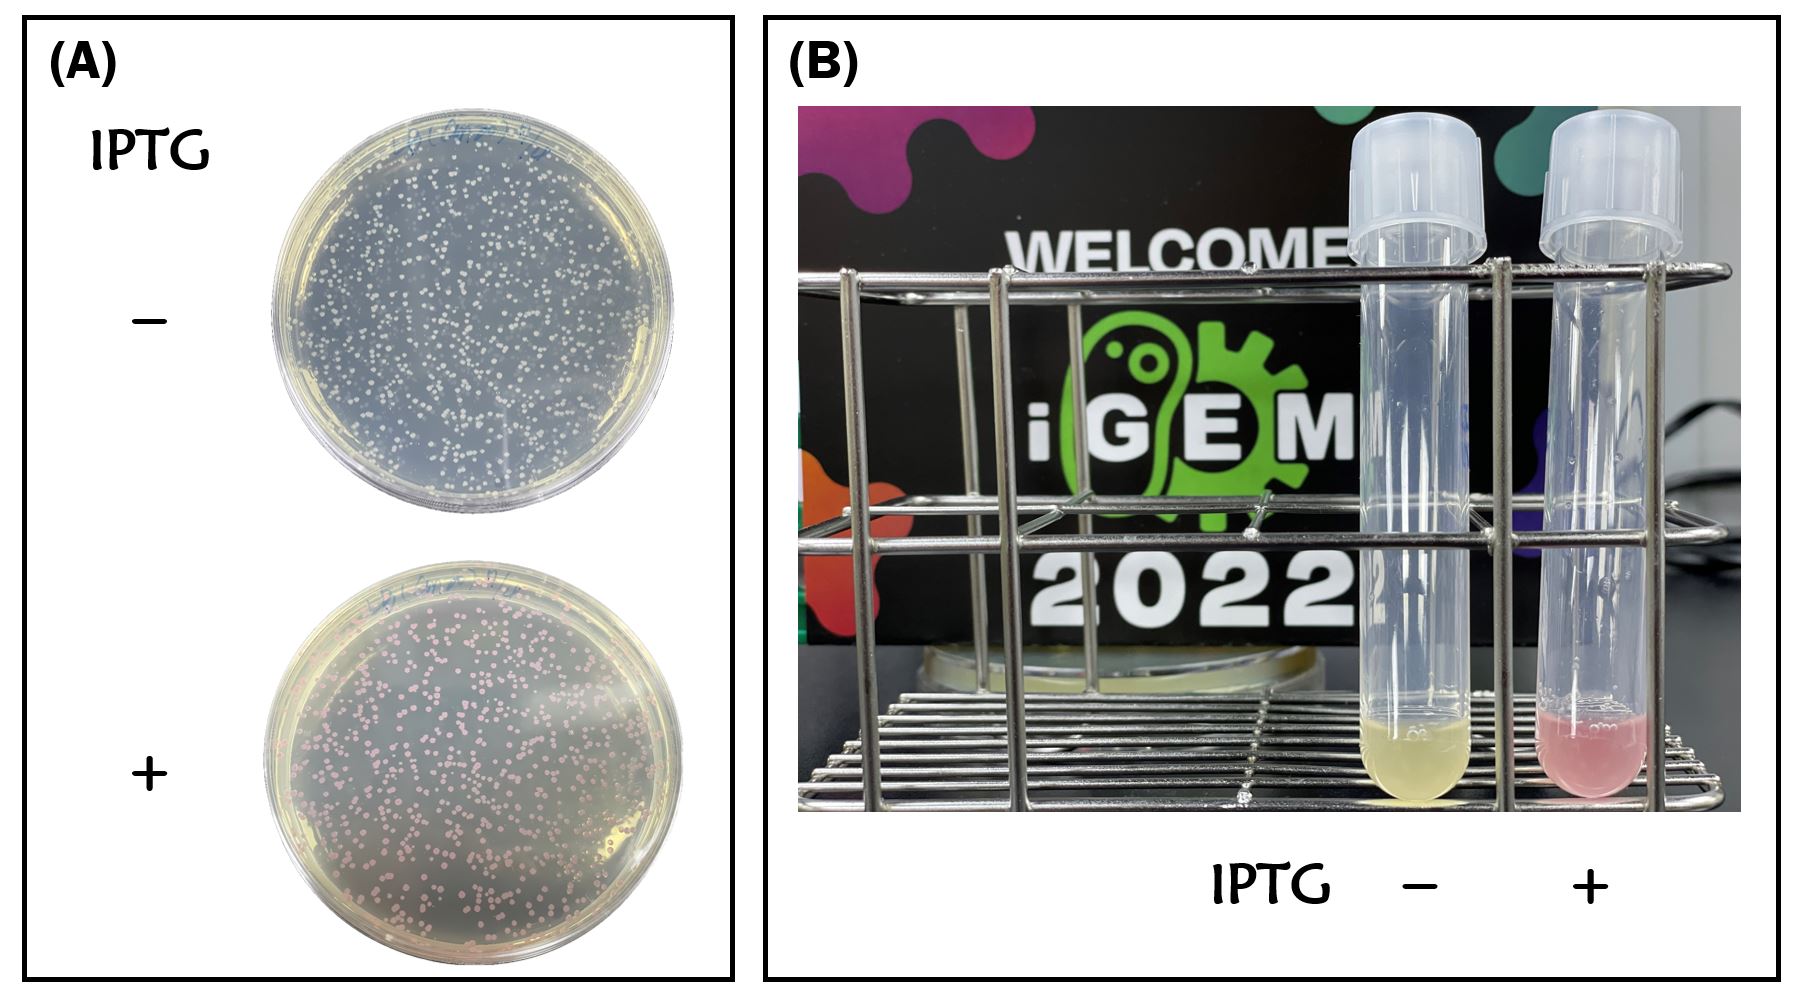
ThisWe retransformed E. coli BL21 with an existing part of T7-RBS-RFP-Tr/pSB1C3 (Part:BBa_K3431048). Red colors were clearly seen in LB agar plate and LB liquid culture containing 1mM of IPTG compared to non-IPTG as controls after an overnight culture (Fig. 3), indicating the gene of RFP can be driven by the functional T7 promoter/terminator with a RBS.
Figure 3 | IPTG induction of RFP expression driven by T7 promoter in E. coli BL21 carrying T7-RBS-RFP-Tr on LB agar plate (A) or LB broth (B) supplemented with 34 μg/mL of chloramphenicol. IPTG concentration is 1mM.
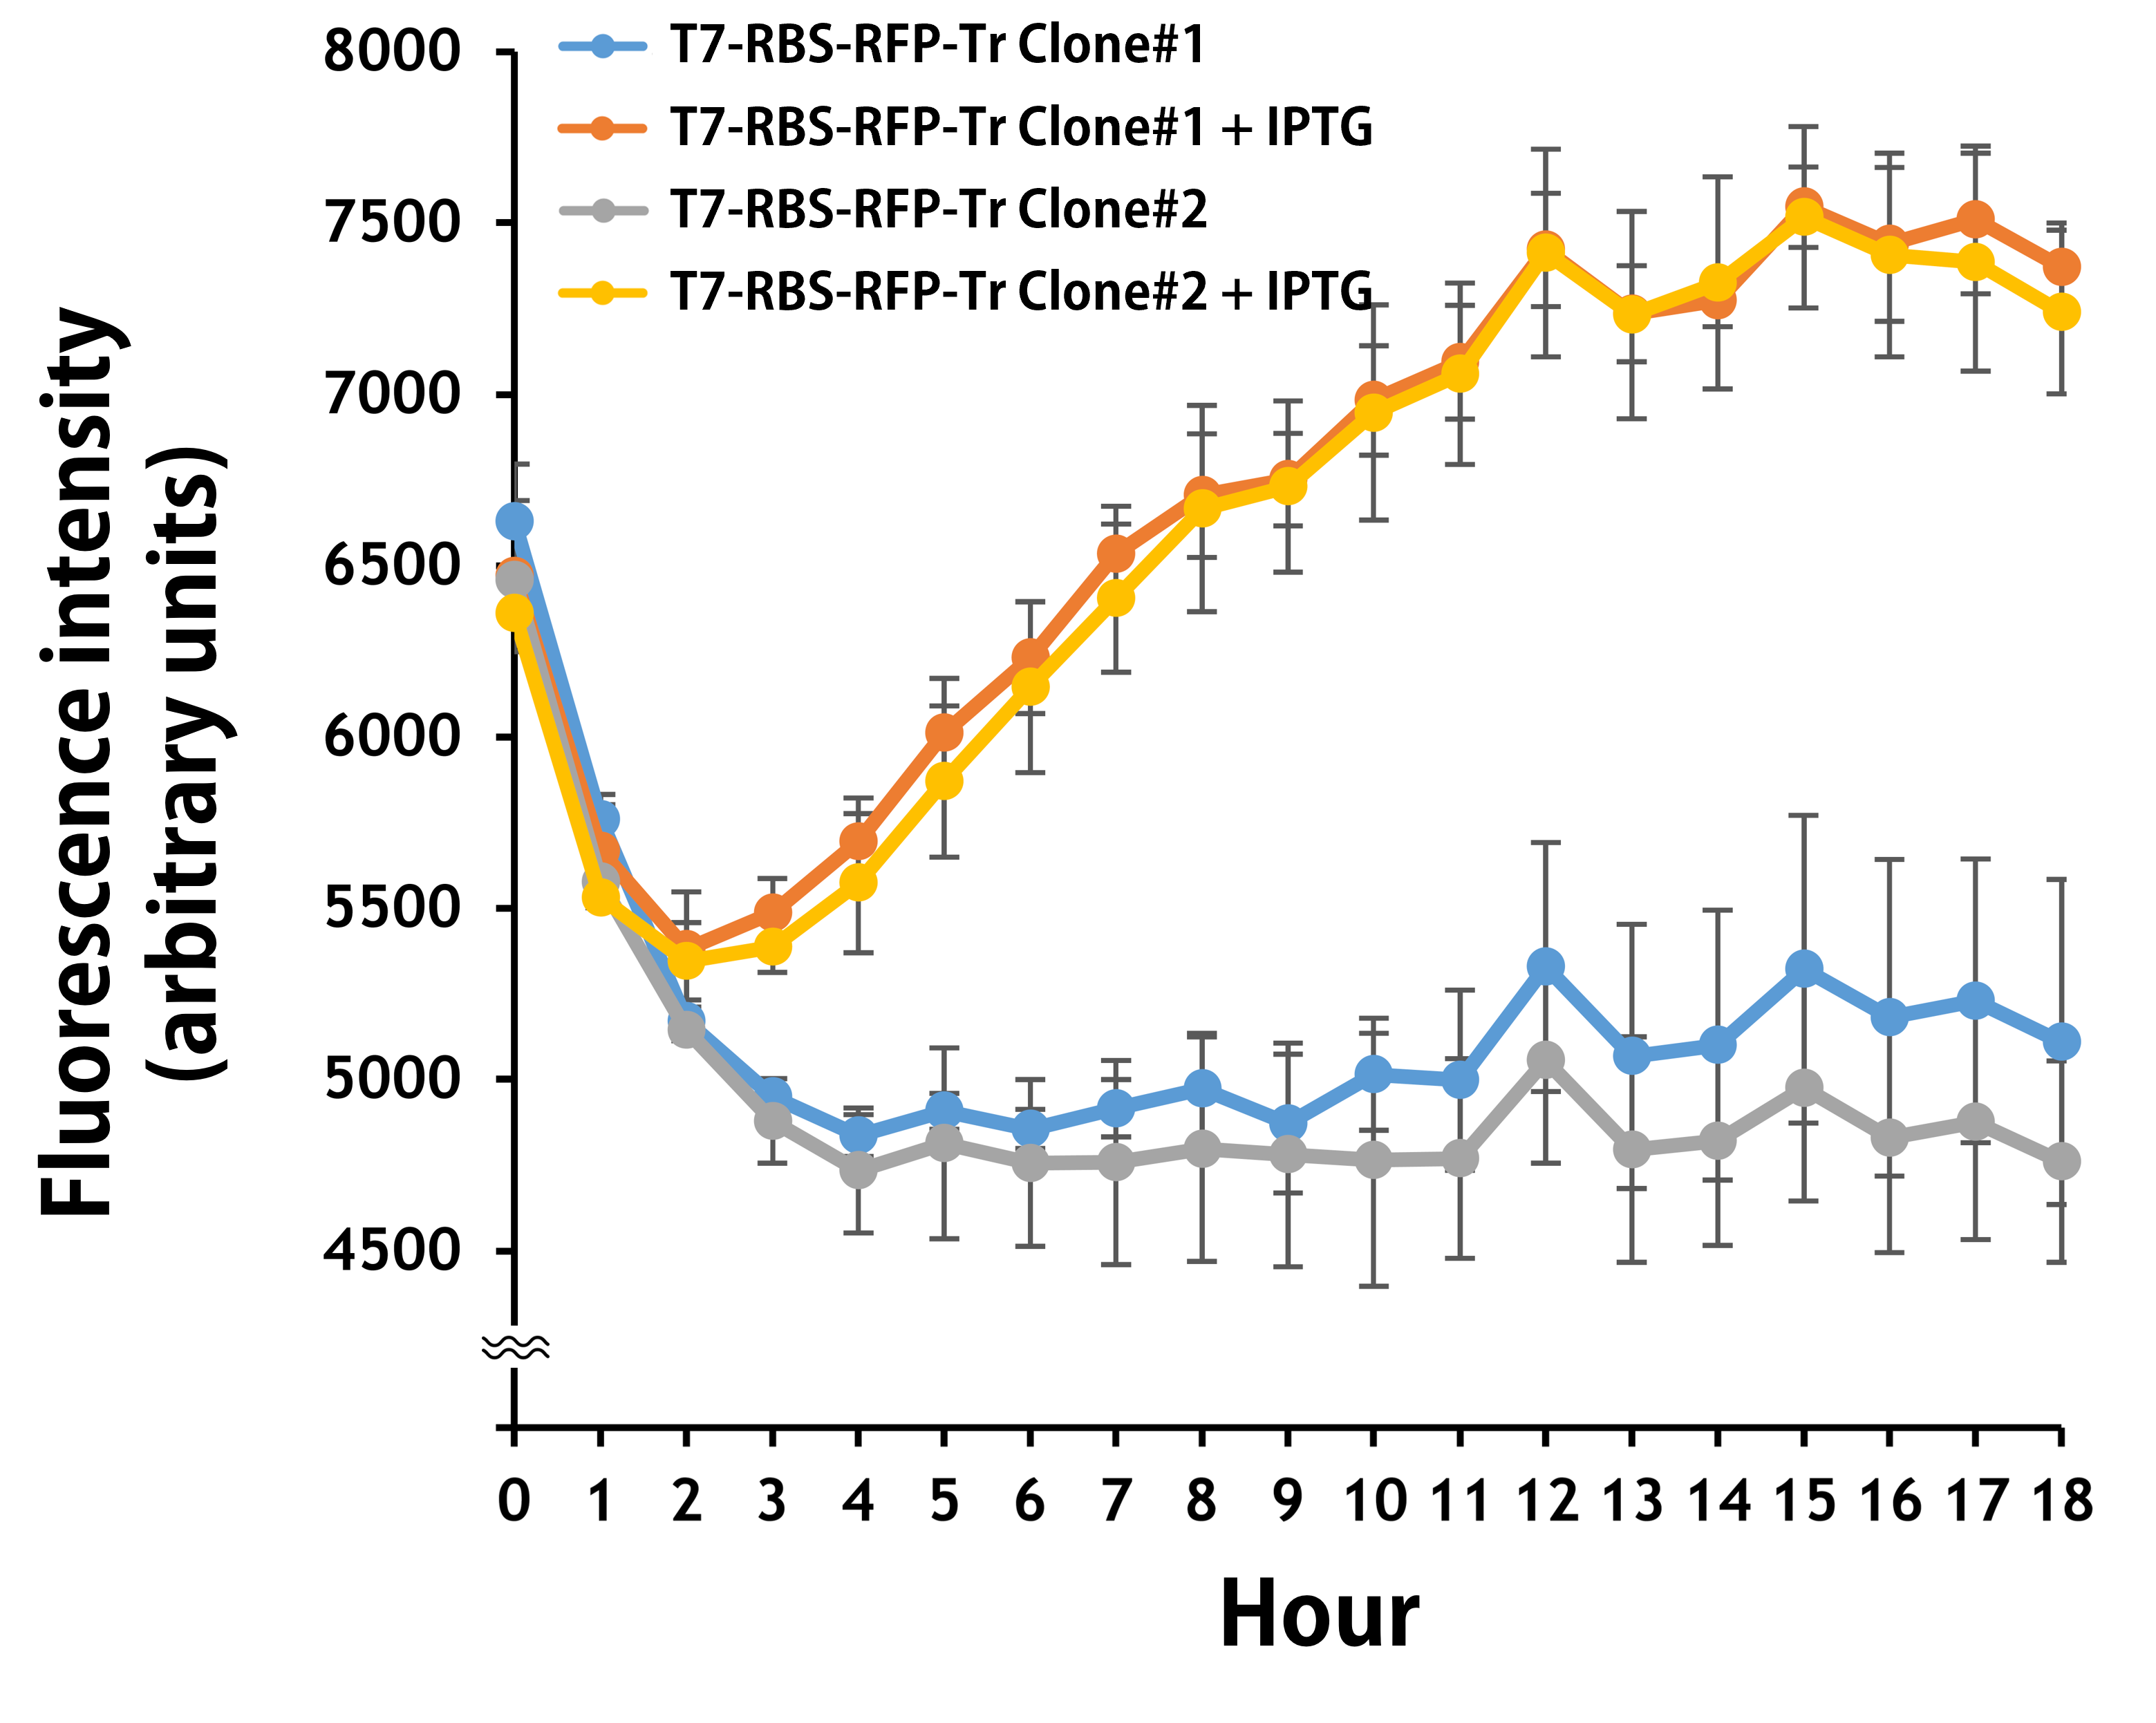
ThisFurthermore, the transformed E. coli BL21 runs in a kinetic mode for 24 hr in the LB broth with or without IPTG. The RFP levels were read by Synergy H1 Hybrid Multi-Mode Reader - BioTek Instruments (Agilent Technologies, Inc.) at an excitation and emission wavelength of 584 nm and 607 nm, respectively. Regardless of some interfering background values in LB media were detected in the first 3 hr, it’s clear that the T7 promoter activities began to be induced around 2 hr and became significantly strong to a level of 1.5-fold induction compared to the controls without IPTG at 12 hr (Fig. 4). The data were consistent with the results seen by naked eyes (Fig. 3).
Figure 4 | The plasmid of T7-RBS-RFP-Tr/pSB1C3 was transferred into E. coli BL21. Two clones were picked up for IPTG induction assay for 18 hr. RFP levels were read every one hour at an ex/em = 584/607.
Enhanced g10.RBS with a T7 gene 10 leader sequence
ThisIn order to increase the expression of protein of interest, we added a canonical strong RBS (Part:BBa_B0034) with a leader sequence containing a stem loop from the T7 bacteriophage gene 10 (g10.RBS, Part:BBa_K4150000).
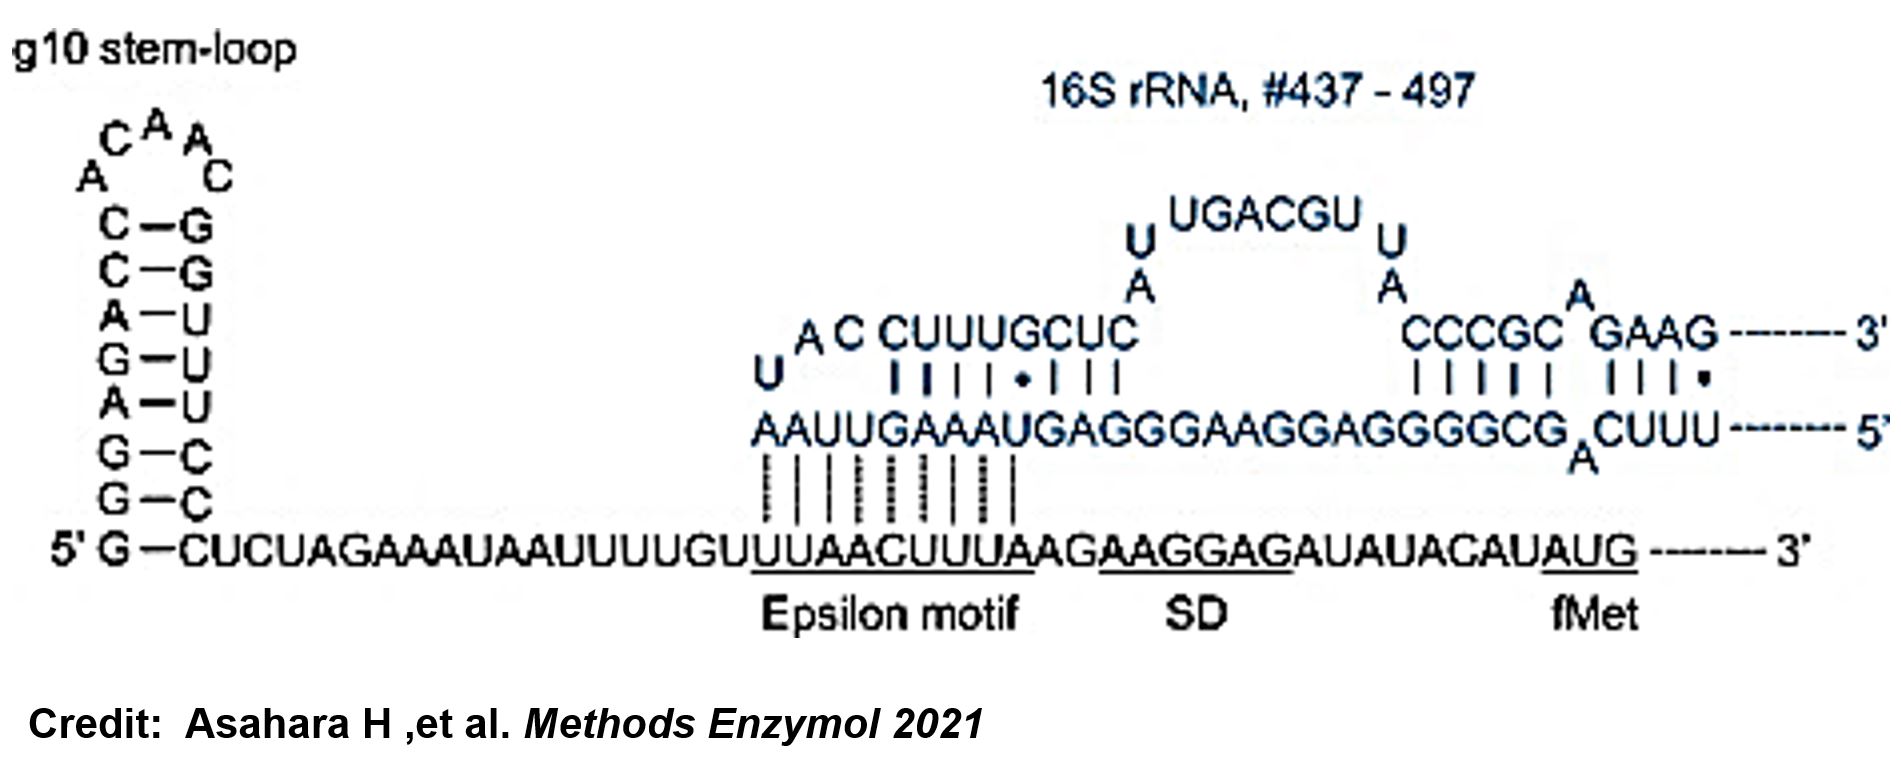
ThisThe g10 leader sequence encodes very highly expressed phage proteins, in which 9-base of Epsilon motif exhibits perfect complementary to the 16S RNA of E. coli[4]. This structure connected with the consensus Shine-Dalgarno sequence (SD) can enhance up to 340-fold heterologous gene expression in E. coli[5]. The g10 leader sequence is also present in several commercially available pET series vectors.
ThisWe replaced the RBS with g10.RBS in BioBrick Part:BBa_K3431048 (T7-RBS-RFP-Tr) to create an improved BioBrick Part:BBa_K4150002 (T7-g10.RBS-RFP-Tr). These two plasmids were transformed into E. coli BL21. In the presence of IPTG, colonies on the LB agar plate and cultures in the LB broth both showed darker red colors for RFP gene expression driven by T7 promoter with g10 leader sequence compared to the original RBS without g10 leader sequence (Fig. 5). However, the E. coli BL21 with T7-g10.RBS-RFP-Tr had a higher background level in the absence of IPTG.
Figure 5 | The plasmids as indicated were transformed into E. coli BL21. The E. coli were grown on LB agar plate supplemented with 20 μg/mL of chloramphenicol and 1mM of IPTG. One of the colonies was cultured in LB broth with 34 μg/mL of chloramphenicol in the absence or in the presence of 1mM of IPTG. Inset panel: The plates were observed under a blue LED light box.
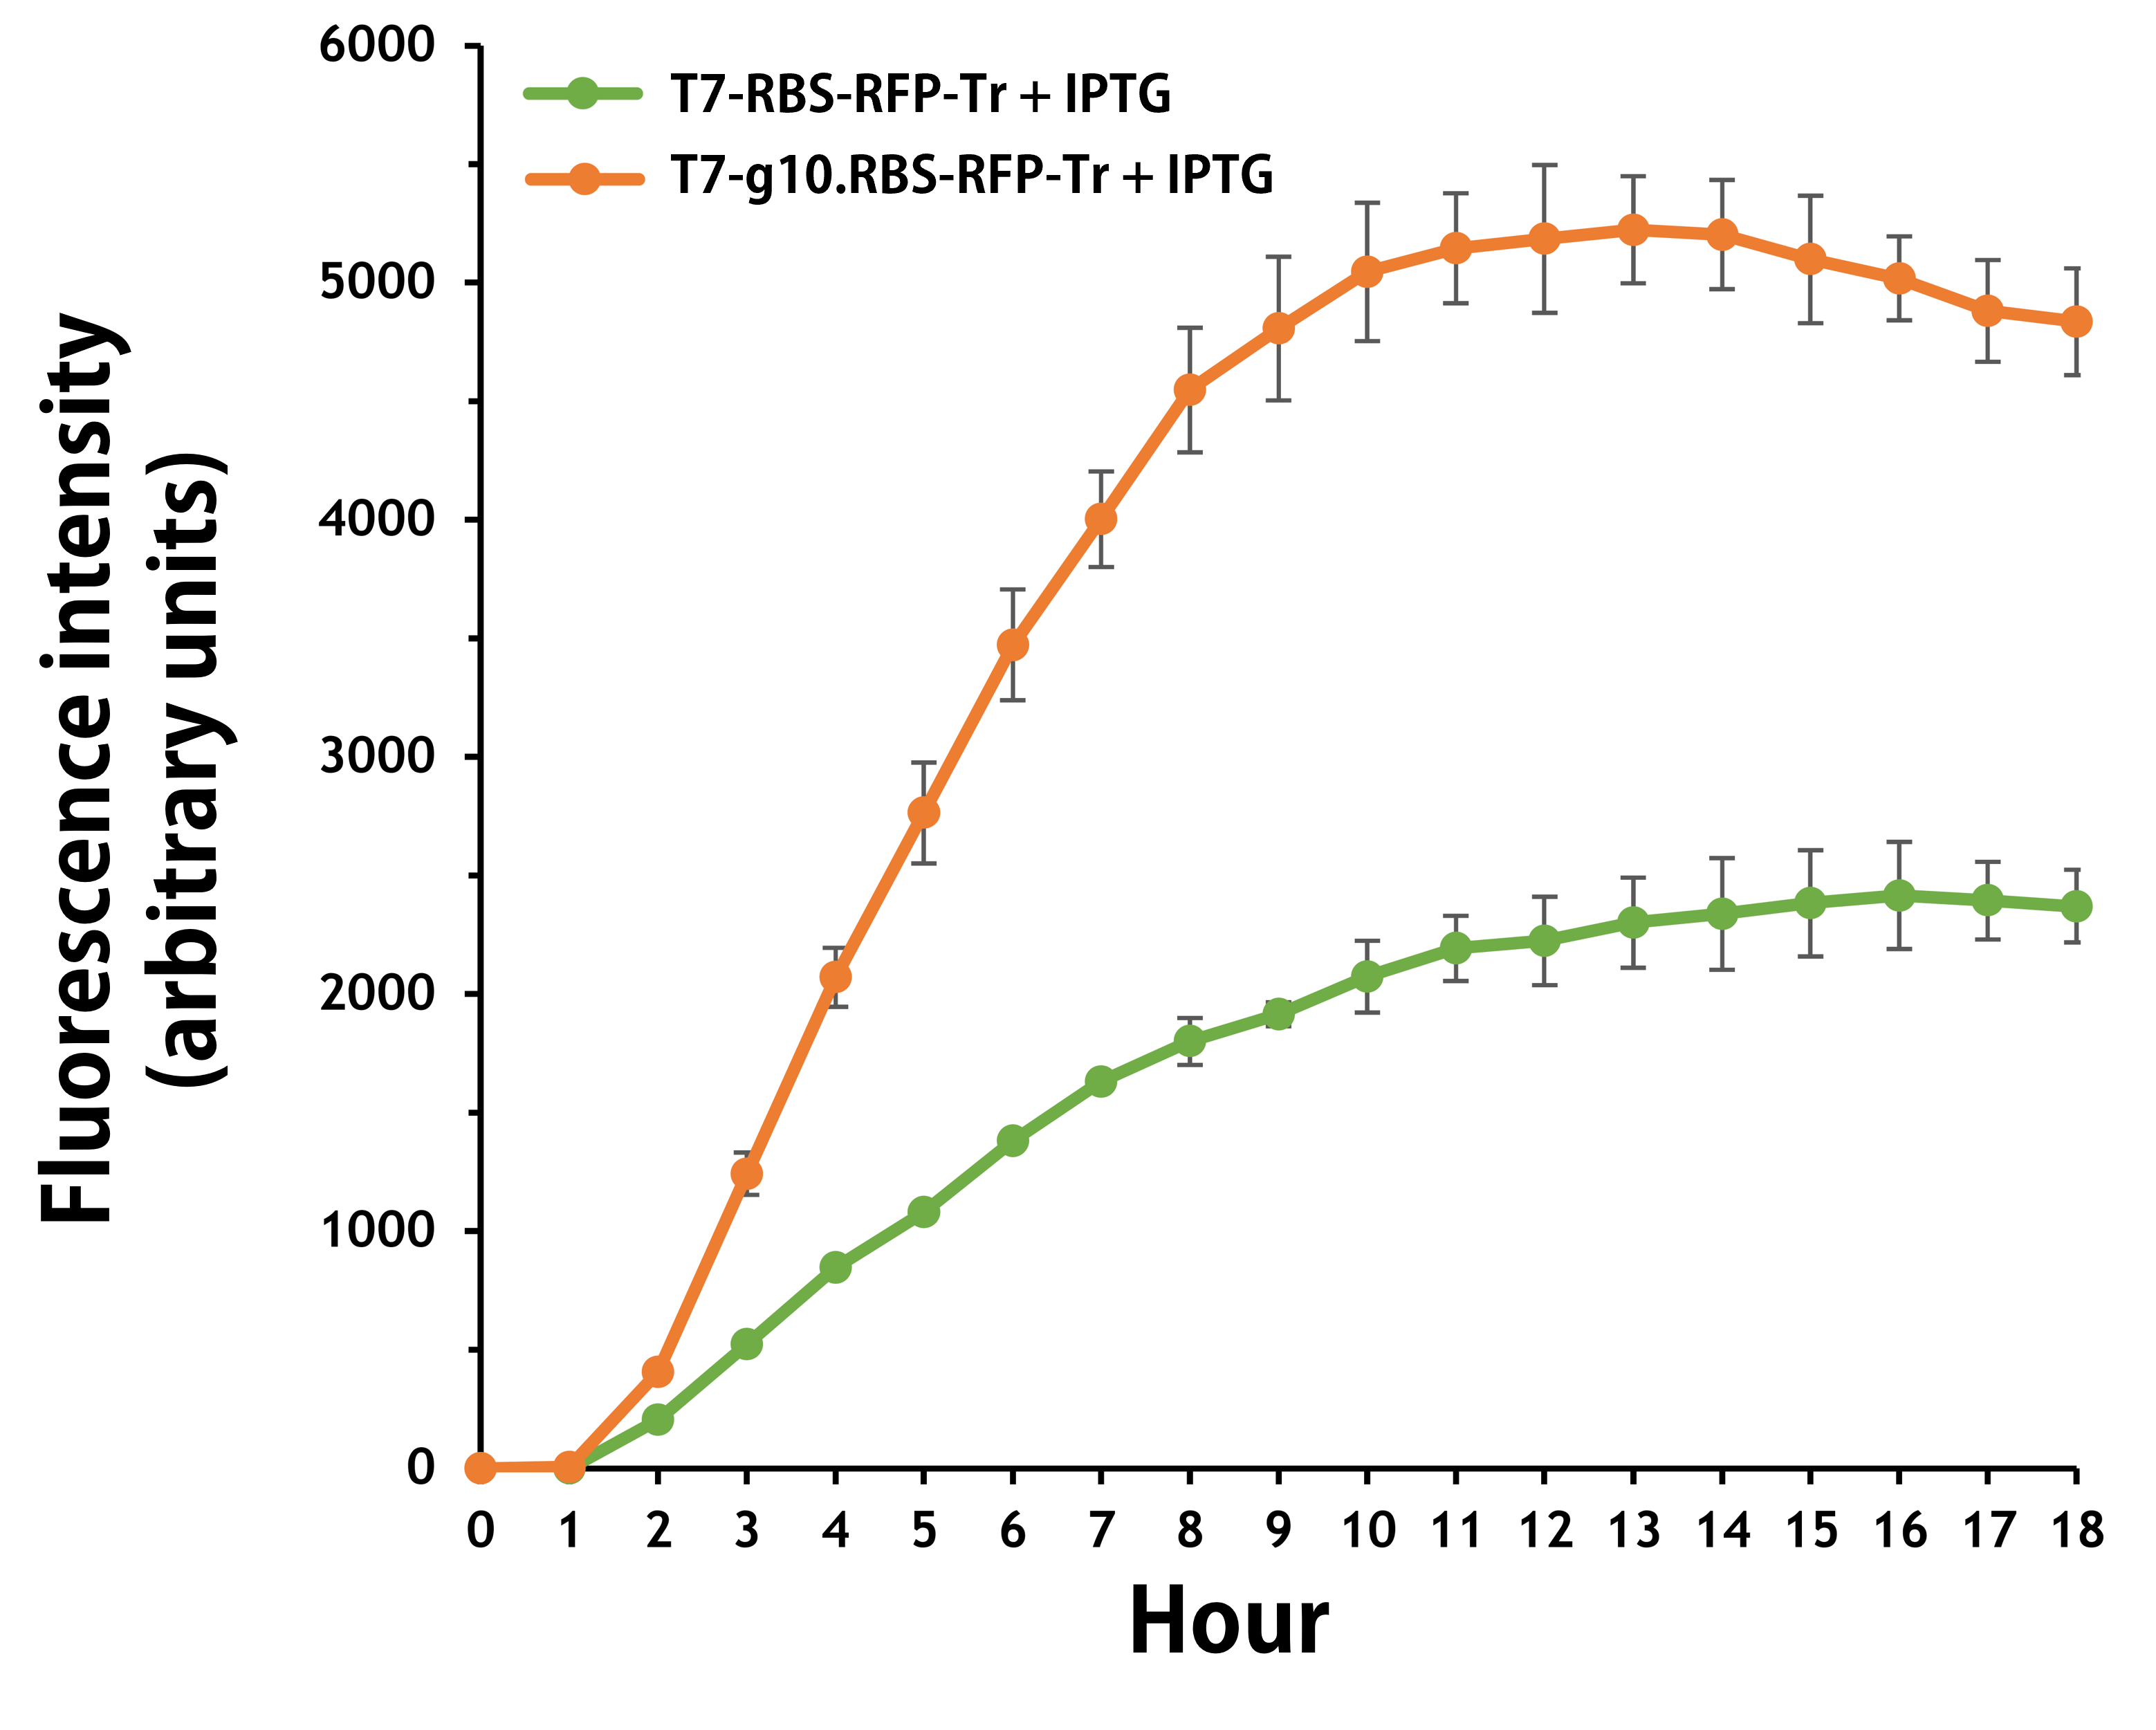
ThisFurthermore, the transformed E. coli with T7-g10.RBS-RFP-Tr compared to T7-RBS-RFP-Tr expressed RFP at faster and increased (up to 2.5-fold) fluorescence intensity levels in a time-dependent manner (Fig. 6). The above data demonstrated the g10 leader sequence in front of RBS can significantly enhance gene expression.
Figure 6 | The plasmids as indicated were transformed into E. coli BL21. The E. coli were grown in LB broth supplemented with 34 μg/mL of chloramphenicol and 1mM of IPTG for 18 hours. The RFP expression levels were read at ex/em = 584/607 nm in a kinetic mode by Synergy H1 Hybrid Multi-Mode Reader - BioTek Instruments (Agilent Technologies, Inc.). The values of fluorescence intensity were presented by the data with IPTG induction minus the data without induction as background levels.
Verification of the Engineered Bacteriophage
Reporter - T7 phage::GFP
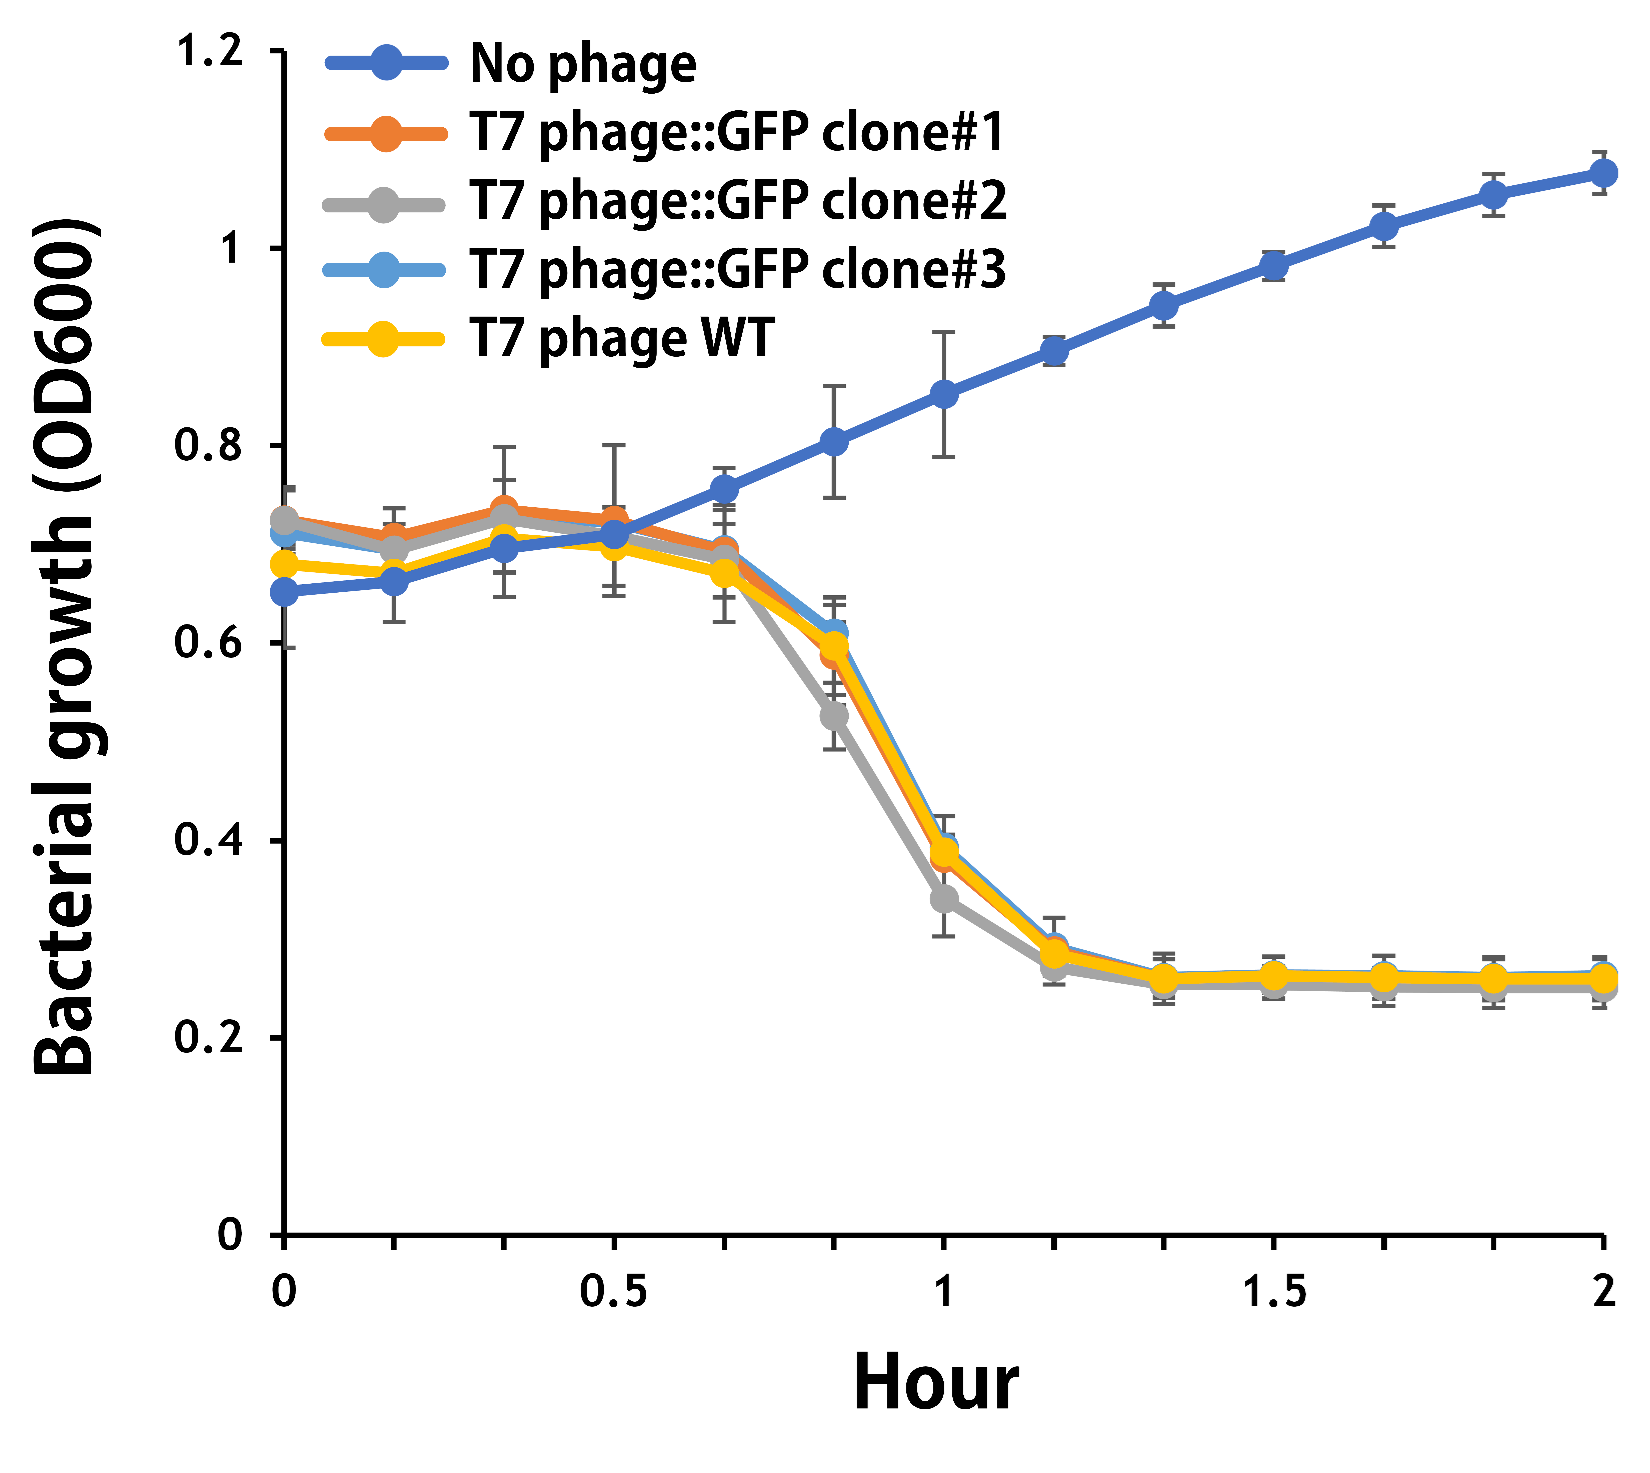
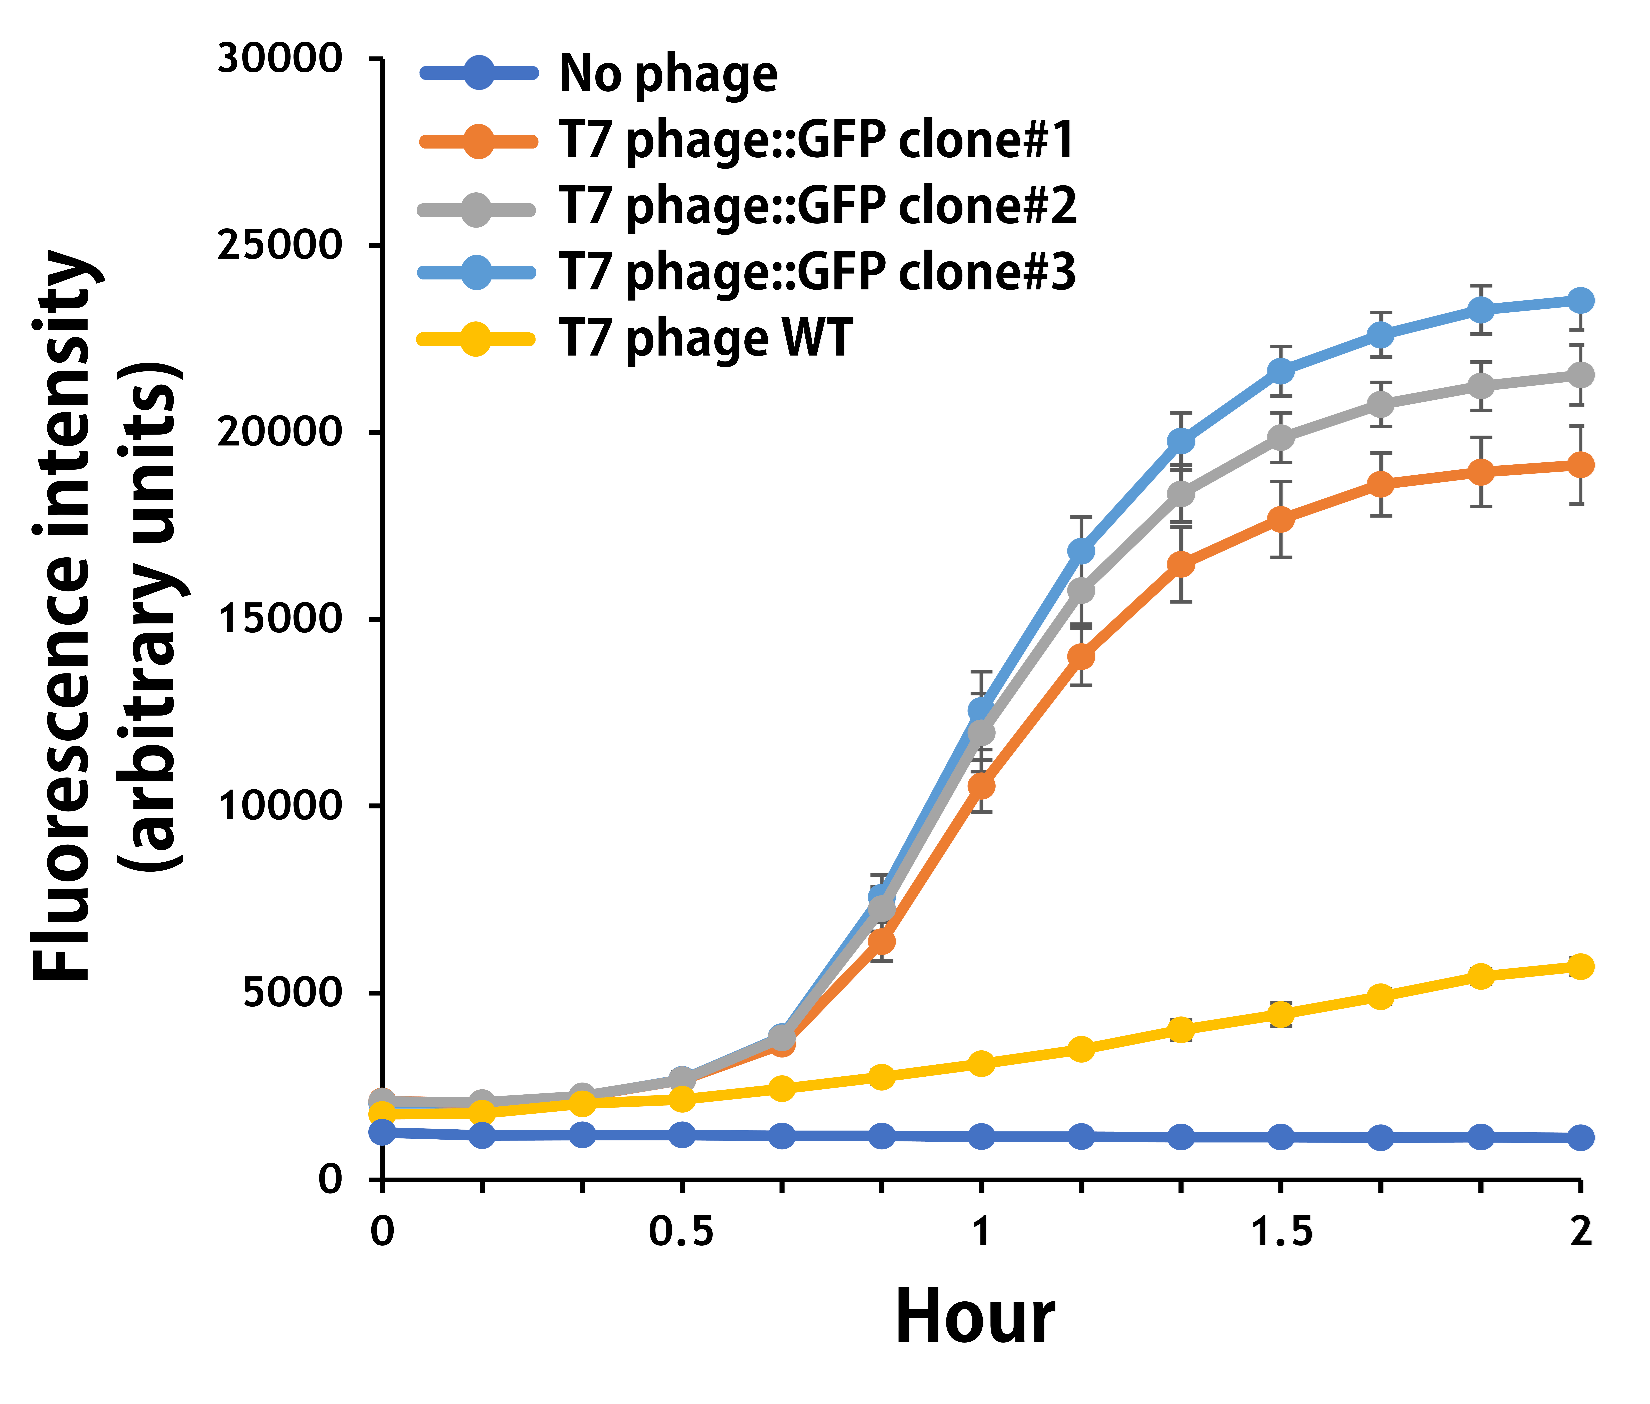
ThisTo verify the function of the engineered phage, we engineered T7 phage to carry a GFP reporter gene in the same context as T7 phage::OVA. The mouse intestinal commensal E. coli isolates were grown to an OD around 0.6 in the M9 minimal medium supplemented with casamino acids (0.2%), D-glucose (0.3%), vitamin B1 (1 mg/ml), MgSO4 (0.2 mM), CaCl2 (0.1 mM)[6], followed by infected with the engineered phages at a MOI of 5 for 2 hr at 37°C. The data were read for OD600 and GFP at an ex/em = 483/513 nm every 10 min. Compared to wild-type T7 phage infection, the engineered phage::T7P-g10.RBS-His-GFP-T7T can infect and kill the E. coli in a similar way (Fig. 7). In addition, the engineered phages are able to transfer the GFP reporter cassette into E. coli and make GFP production at the beginning of 40 min (Fig. 8), which is consistent with the time starting to lyse the bacteria (Fig. 7).
Figure 7 | The infection of the wild-type and the engineered T7 phages on a mouse intestinal commensal E. coli. The E. coli were growing to an OD around 0.6 in the wells of a 96-well plate (Falcon® 96-well Black/Clear Flat Bottom) at 37°C with 200 μl of the supplemented M9 media, followed by the phage (as indicated) infection at a MOI of 5. The values of OD600 were read every 10 min till 2 hr by a microplate reader (Synergy H1 Hybrid Multi-Mode Reader - BioTek Instruments). The growth of E. coli without phages was set as a control.
Figure 8 | The production of GFP by the engineered T7 phage::T7P-g10.RBS-His-GFP-T7T. The E. coli were growing to an OD around 0.6 in the wells of a 96-well plate (Falcon® 96-well Black/Clear Flat Bottom) at 37°C with 200μl of the supplemented M9 media, followed by the phage (as indicated) infection at a MOI of 5. The values of fluorescence intensity were read at an ex/em = 483/513 nm every 10 min till 2 hr by a microplate reader (Synergy H1 Hybrid Multi-Mode Reader - BioTek Instruments). The background levels were measured with the controls of E. coli without phages or infected with wild-type phages.
Vaccine - T7 phage::OVA
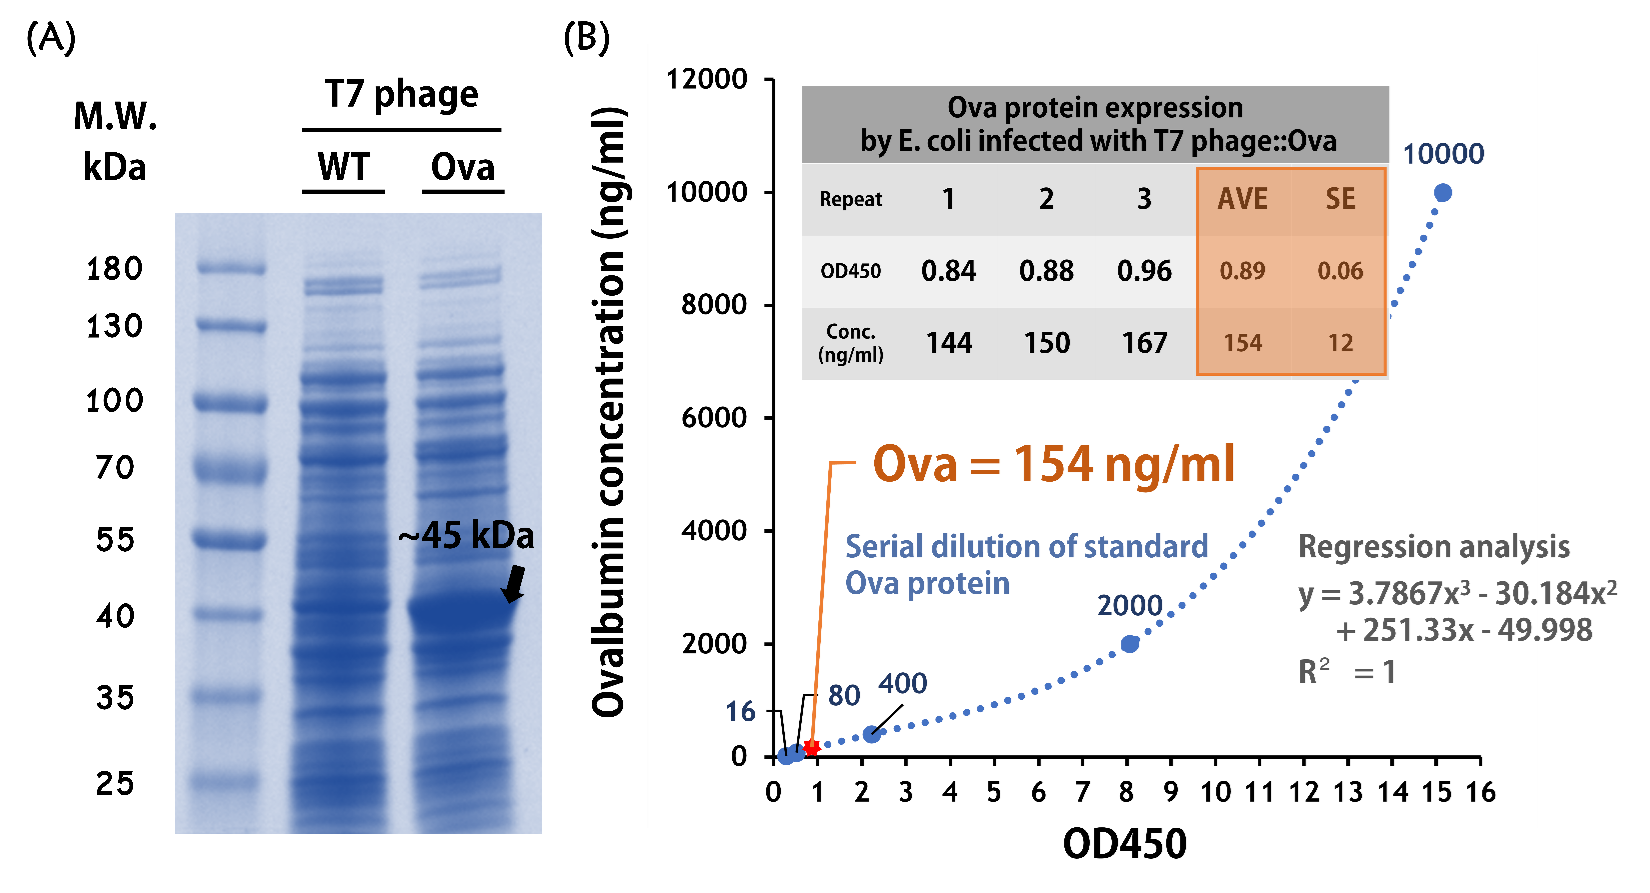
ThisTo test the Ova protein expression by the engineered phage, the isolated BALB/c mouse intestinal commensal E. coli were grown to an OD of 0.6 and infected with T7 phage::T7P-g10.RBS-His-Ova-T7T at a MOI of 5 for 2 hr at 37°C. The bacterial lysates were subjected to SDS-PAGE and Coomassie blue staining. The gel clearly showed a sharp band at the predicted size of a purified chicken ovalbumin protein (~45 kDa) compared to the lysates of E. coli infected with wild-type T7 phages (Fig. 9A).
ThisTo quantify the protein concentration produced by the engineered phage carrying Ova gene, 5 x 10⁸ cells of the isolated E. coli (OD600 = ~0.6) were infected with 2.5 x 10⁹ phages (MOI = 5) for 2 hr at 37°C. The 50 μl of lysates along with a serial dilution of standard of purified ovalbumin proteins were subjected to an ELISA Kit for Ovalbumin (CLOUD-CLONE CORP., Product No. CEB459Ge) and performed according to the manufacturer’s instruction. The data were measured at OD450 nm and determined by regression analysis due to the assay is based on the competitive inhibition enzyme immunoassay technique. As shown in the Fig. 9B, the concentration of Ova proteins produced in the E. coli infected with T7 phage::Ova were ~154 ng/ml (OD450 = ~0.89).
ThisTaken together, we successfully created and improved BioBrick parts, as well as engineered T7 phages, which are able to transfer genes (i.e., GFP and Ovalbumin) into mouse intestinal E. coli and produce proteins of interest by the infected E. coli.
Figure 9 | Ovalbumin protein production by the mouse intestinal E. coli infected with T7 phages::T7-g10.RBS-His-Ova-T7T. (A) 30 ng of total phage-infected bacterial lysates were run on SDS-PAGE with a 4–15% Mini-PROTEAN® TGX™ Precast Protein Gels (Bio-Rad Laboratories, Inc.) and stained with Coomassie Brilliant Blue G-250. The PageRuler™ Prestained Protein Ladder, 10 to 180 kDa (Thermo Fisher Scientific Inc) was used as a marker. (B) 50 μl of the same lysates were also conducted in an ELISA Kit for Ovalbumin (OVA) (Cloud-Clone Corp.) along with a serial dilution of standard Ova protein provided in the kit. The values were read at OD450 and calculated by a formula made by a regression analysis.
Purification of His-OVA in the mode of phage - E. coli - antigen production
ThisTo achieve our goal of building up the model antigen of phage ovalbumin induction system (i.e., phage – E. coli – protein production) for the application of vaccine testing, a His tag was fused at the N terminus of ovalbumin. We’d like to know whether the His-ovalbumin can be purified for future application.
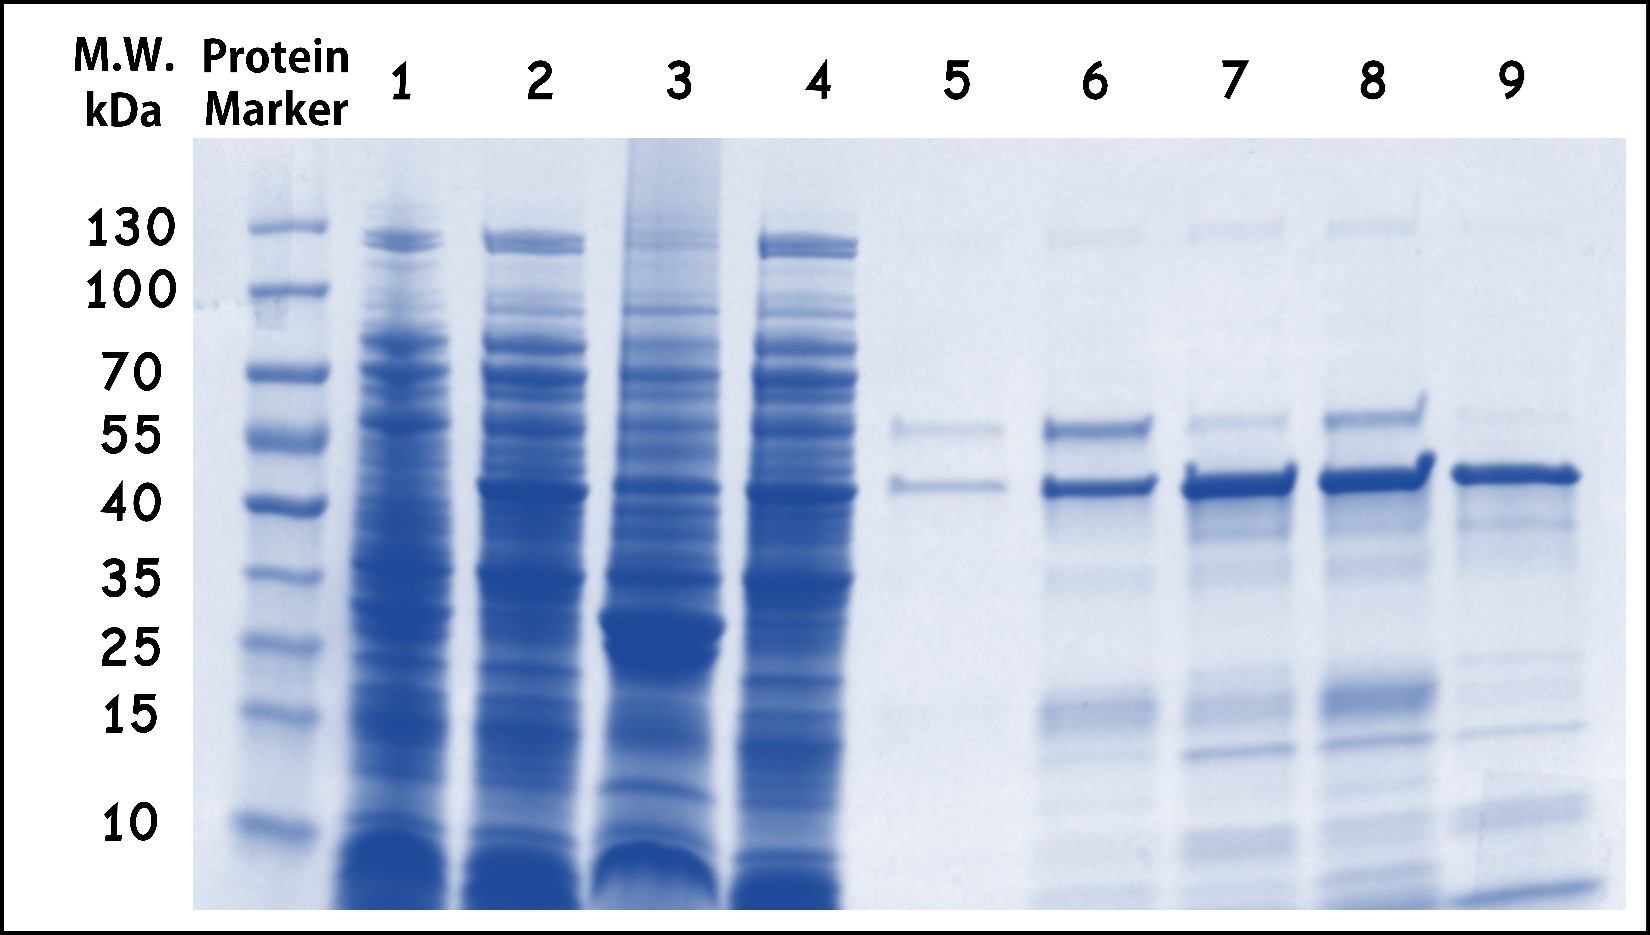
ThisThe His-ovalbumin protein from the lysates of E. coli DH5alpha infected with T7 phage::OVA was purified by Nickel column through the ÄKTA start protein purification system (Cytiva). The Fig. 10 showed the elutions contain predominantly purified His-ovalbumin proteins with a predicted molecular weight of 45kDa, although some degradation forms or impurities may leave in the elutions. Taken together, the ovalbumin protein in the E. coli infected by T7 phage:OVA can be produced and purified in our system. Therefore, the ovalbumin as a model antigen can be applied in the purified form or as phage-infected bacterial lysates.
Figure 10 | His-Ovalbumin purification from the phage-infected bacterial lysates. The lysates of E. coli DH5alpha infected with T7 phage::T7-g10.RBS-His-Ova-T7T were purified by Nickel column through the ÄKTA start protein purification system (Cytiva). The protein harvested were analyzed by SDS-PAGE and Coomassie Blue Staining using 4–15% Mini-PROTEAN® TGX™ Precast Protein Gels (Bio-Rad Laboratories, Inc.) PageRuler™ Prestained Protein Ladder was used as a marker. Lane: (1) E. coli control lysates without phage infection, (2) E. coli raw lysates with phage infection, (3) flow-through, (4) total lysates before purification, (5) wash-through, (6) Elution #8, (7) Elution #9, (8) Elution #10, (9) Elution #11.
Reference
- ↑ Geary TW, Reeves JJ. Production of a genetically engineered inhibin vaccine. Vaccine. 1996 Sep;14(13):1273-9. doi: 10.1016/s0264-410x(96)00014-x. PMID: 8961517.
- ↑ Ludwig T, Hoffmann R, Krizsan A. Construction and Characterization of T7 Bacteriophages Harboring Apidaecin-Derived Sequences. Curr Issues Mol Biol. 2022 Jun 1;44(6):2554-2568. doi: 10.3390/cimb44060174. PMID: 35735615; PMCID: PMC9221748.
- ↑ McCallin S, Alam Sarker S, Barretto C, Sultana S, Berger B, Huq S, Krause L, Bibiloni R, Schmitt B, Reuteler G, Brüssow H. Safety analysis of a Russian phage cocktail: from metagenomic analysis to oral application in healthy human subjects. Virology. 2013 Sep 1;443(2):187-96. doi: 10.1016/j.virol.2013.05.022. Epub 2013 Jun 10. PMID: 23755967.
- ↑ Olins PO, Devine CS, Rangwala SH, Kavka KS. The T7 phage gene 10 leader RNA, a ribosome-binding site that dramatically enhances the expression of foreign genes in Escherichia coli. Gene. 1988 Dec 15;73(1):227-35. doi: 10.1016/0378-1119(88)90329-0. PMID: 3072257.
- ↑ Asahara H, Magnelli P, Shi X, Tuckey C, Zhou Y, Samuelson JC. Guidelines for nucleic acid template design for optimal cell-free protein synthesis using an Escherichia coli reconstituted system or a lysate-based system. Methods Enzymol. 2021;659:351-369. doi: 10.1016/bs.mie.2021.07.005. Epub 2021 Sep 2. PMID: 34752294.
- ↑ Vinay M, Franche N, Grégori G, Fantino JR, Pouillot F, Ansaldi M. Phage-Based Fluorescent Biosensor Prototypes to Specifically Detect Enteric Bacteria Such as E. coli and Salmonella enterica Typhimurium. PLoS One. 2015 Jul 17;10(7):e0131466. doi: 10.1371/journal.pone.0131466. PMID: 26186207; PMCID: PMC4506075.
Sequence and Features
- 10COMPATIBLE WITH RFC[10]
- 12INCOMPATIBLE WITH RFC[12]Illegal NheI site found at 1315
- 21COMPATIBLE WITH RFC[21]
- 23COMPATIBLE WITH RFC[23]
- 25COMPATIBLE WITH RFC[25]
- 1000INCOMPATIBLE WITH RFC[1000]Illegal BsaI.rc site found at 34
Illegal SapI.rc site found at 468


