Difference between revisions of "Part:BBa K1033916"
(→Characterization) |
|||
| (11 intermediate revisions by one other user not shown) | |||
| Line 174: | Line 174: | ||
</table> | </table> | ||
| − | |||
| − | + | ||
| − | + | ==NJTech_China 2020’s Characterisation== | |
| − | + | ||
| − | + | ||
While most of our project was focused on signaling pathways of yeasts, we were also interested in chromoproteins. Specifically, we characterized the expression of amajLime and eforRed. | While most of our project was focused on signaling pathways of yeasts, we were also interested in chromoproteins. Specifically, we characterized the expression of amajLime and eforRed. | ||
<br> | <br> | ||
| + | |||
The amajLime sequence (Part:BBa_K1033916) optimized for E. coli was incorporated into plasmid pET-28a(+), transformed into E. coli BL21 for characterization and measurement. We provided amajLime with results and data based on protein expression and purification, TOF-Mass spectrometry, full wavelength measurement and Swiss-model. | The amajLime sequence (Part:BBa_K1033916) optimized for E. coli was incorporated into plasmid pET-28a(+), transformed into E. coli BL21 for characterization and measurement. We provided amajLime with results and data based on protein expression and purification, TOF-Mass spectrometry, full wavelength measurement and Swiss-model. | ||
<br> | <br> | ||
| + | |||
Methods: | Methods: | ||
<br> | <br> | ||
SDS-PAGE, TOF-Mass Spectrometry, BCA (Bicinchoninic acid) method, full wavelength measurement and Swiss-Model. | SDS-PAGE, TOF-Mass Spectrometry, BCA (Bicinchoninic acid) method, full wavelength measurement and Swiss-Model. | ||
| + | |||
<br> | <br> | ||
Results | Results | ||
| − | <p> | + | <p> </p> |
| − | [[File:NJTech_China_amajLime-1.png|width='100%' valign='top'| |center|thumb|550px|''<b>Fig.1</b> The fermentation broth of amajLime. | + | [[File:NJTech_China_amajLime-1.png|width='100%' valign='top'| |center|thumb|550px|''<b>Fig.1</b> The fermentation broth of amajLime.   <b>Fig.2</b> The cell pellet collected after centrifugation.]] |
| + | <br> | ||
| + | Conclusion: The cell pellet was collected by harvesting 50mL culture after 24h of induction followed by centrifugation at 4 degrees and 6000 rpm for 10min. Then, we performed ultrasonic disruption and collected the supernatant after centrifugation. The protein was purified and collected through ultrafiltration and affinity chromatography. | ||
<br> | <br> | ||
| + | <p> </p> | ||
| + | [[File:NJTech_China_amajLime-3.png|width='100%' valign='top'| |center|thumb|550px|''<b>Fig.3</b> SDS-PAGE of the chromoprotein amajLime.]] | ||
| + | <br> | ||
| + | 1· amajLime- The culture after IPTG induction. | ||
| + | <br> | ||
| + | 2· amajLime- The pellet after IPTG induction and ultrasound. | ||
| + | <br> | ||
| + | 3· amajLime- Supernatant after IPTG induction and sonication. | ||
| + | <br> | ||
| + | 4· amajLime- The culture without IPTG induction. | ||
| + | <br> | ||
| + | 5· amajLime- The pellet without IPTG induction after ultrasound. | ||
| + | <br> | ||
| + | 6· amajLime- Supernatant sample without IPTG induction after sonication. | ||
| + | <br> | ||
| + | 7· amajLime- Protein sample after the ultrafiltration (diluted 20 times). | ||
| + | <br> | ||
| + | 8· amajLime- Purified protein sample. | ||
| + | |||
| + | <br> | ||
| + | Conclusion: The protein gel preliminarily proved that the molecular mass of the amajLime protein was correct, which is consistent with the expected molecular mass of amajLime protein (the molecular mass of amajLime protein is about 26.8 kDa). Compared with lane 4, 5 and 6, lane 1, 2, and 3 indicate that more amajLime protein can be obtained with IPTG induction. As is shown in lane 7, the concentration of protein was increased after ultrafiltration concentration. Lane 8 shows that the purification effect of protein after nickel affinity chromatography was better, and the impurity protein was less than before affinity chromatography. In conclusion, it can be seen that our expression and purification strategy is effective. | ||
| + | |||
| + | <br> | ||
| + | <p> </p> | ||
| + | [[File:NJTech_China_amajLime-4.png|width='100%' valign='top'| |center|thumb|550px|''<b>Fig.4</b> BCA Protein Standard Curve.]] | ||
| + | <br> | ||
| + | |||
| + | We used the BCA (Bicinchoninic acid) method to measure the concentration of amajLime protein. | ||
| + | <br> | ||
| + | The concentration of blue chromoprotein was 0.6608 mg/ml. | ||
| + | <br> | ||
| + | The standard protein curve fitting equation (R2=0.96888) : | ||
| + | <br> | ||
| + | y=4.09079x+0.42975 | ||
| + | <br> | ||
| + | It comes out that: | ||
| + | <br> | ||
| + | The concentration of amajLime is 0.6608 mg/ml. | ||
| + | |||
| + | <br> | ||
| + | <p> </p> | ||
| + | [[File:NJTech_China_amajLime-5.png|width='100%' valign='top'| |center|thumb|550px|''<b>Fig.5</b> TOF MS of amajLime.]] | ||
| + | <br> | ||
| + | |||
| + | Conclusion : We performed Time of Flight Mass Spectrometer on the purified HIS-tagged amajLime protein. The predicted molecular mass of this protein is about 26840Da. The result of TOF-Mass Spectrometry showed that the specific molecular mass of amajLime protein is 26.898kDa (the value of the sharpest peak is shown as the molecular mass of amajLime protein). Moreover, the intensity of 26.898kDa is up to 4x10⁵, which indicates the high concentration and purity of the amajLime protein. There are also some small protein peaks, suggesting that the noise had some effect, but not much. | ||
| + | |||
| + | <br> | ||
| + | <p> </p> | ||
| + | [[File:NJTech_China_amajLime-6.png|width='100%' valign='top'| |center|thumb|550px|''<b>Fig.6</b> Absorption spectrum of amajLime (190-1100nm).]] | ||
| + | <br> | ||
| + | |||
| + | amajLime protein full-wavelength scan profile : | ||
| + | <br> | ||
| + | 1-198nm 2.551A | ||
| + | <br> | ||
| + | 2-210nm 2.683A | ||
| + | <br> | ||
| + | 3-276nm 0.146A | ||
| + | <br> | ||
| + | 4-454nm 0.135A | ||
| + | |||
| + | Conclusion : The full-wavelength scan of amajLime protein shows that the strongest absorption peak of amajLime protein occurs at 210nm. As shown in the results, amajLime has a low intensity peak at 400 to 450 nm, which may be due to the fluorescence excitation demonstrated by previous teams such as Hong Kong-CUHK iGEM 2017. | ||
| + | |||
| + | <br> | ||
| + | <p> </p> | ||
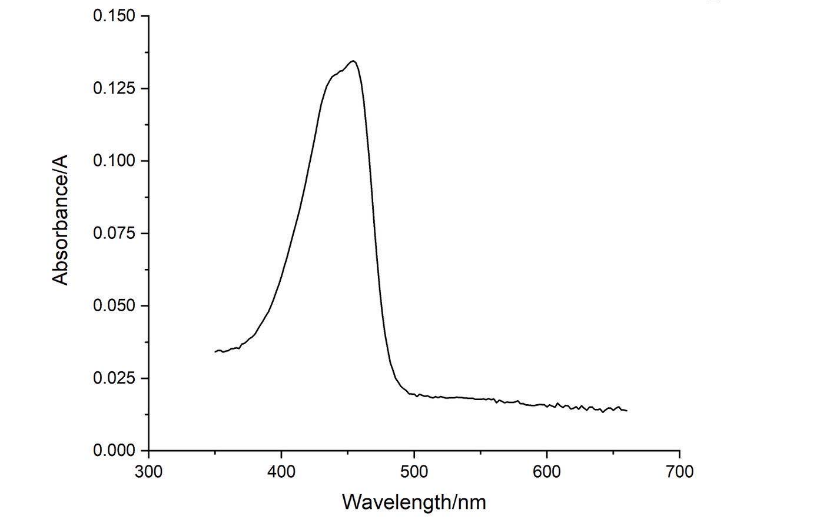
| + | [[File:NJTech_China_amajLime-7.png|width='100%' valign='top'| |center|thumb|550px|''<b>Fig.7</b> Absorption spectrum of amajLime (350-660nm).]] | ||
| + | <br> | ||
| + | |||
| + | Conclusion : The full wavelength measurement of amajLime (359-660nm) was compared with the excitation spectrum figure of 2013UPPSALA , indicating that the results of amajLime protein characterized by our team were similar to those of 2013 UPPSALA and Hong Kong-CUHK iGEM 2017. | ||
| + | |||
| + | <br> | ||
| + | <br> | ||
| + | |||
| + | Structural modeling results of the amajLime protein based on Swiss-Model | ||
| + | |||
| + | <br> | ||
| + | <p> </p> | ||
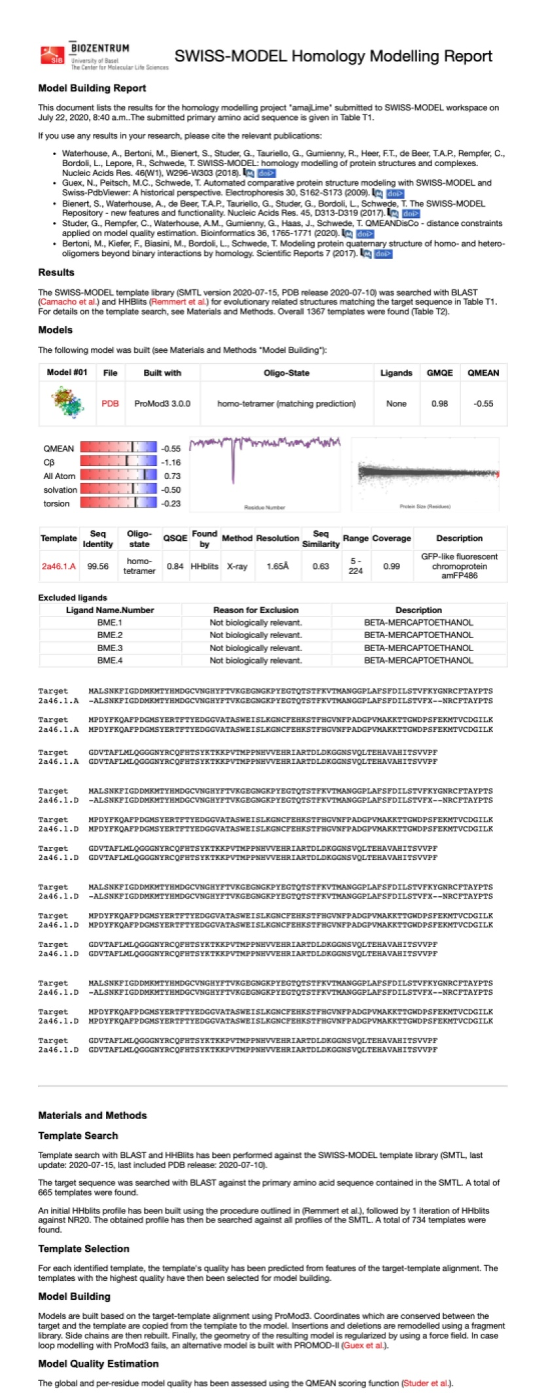
| + | [[File:NJTech_China_amajLime-81.png|width='100%' valign='top'| |center|thumb|550px|''<b>Fig.8-1</b> The results of the homology and structural modelling protein amajLime.]] | ||
| + | <br> | ||
| + | <p> </p> | ||
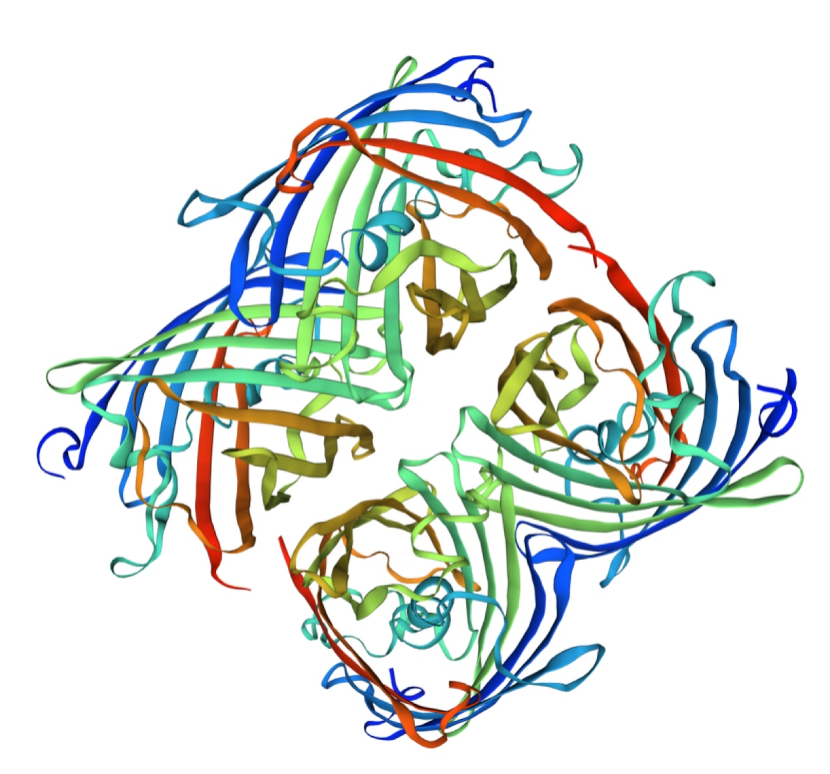
| + | [[File:NJTech_China_amajLime-8.png|width='100%' valign='top'| |center|thumb|550px|''<b>Fig.8-2</b> The 3D model of the homology and structural modelling protein amajLime .]] | ||
| + | <br> | ||
| + | |||
| + | Conclusion: We used Swiss-Model to simulate the three-dimensional structure of amajLime protein. The above figures showed the modeling result of Swiss-Model. | ||
| + | |||
<br> | <br> | ||
Latest revision as of 07:13, 27 October 2020
amajLime, yellow-green chromoprotein
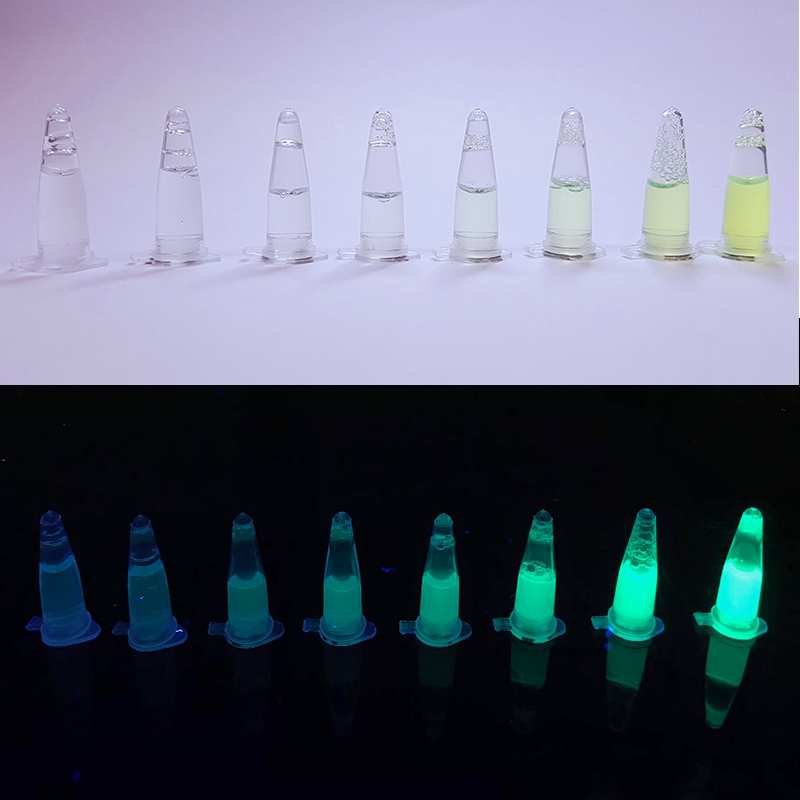
This chromoprotein from the coral Anemonia majano, amajLime (also known as amajCFP or amFP486), naturally exhibits strong color when expressed. The protein has an absorption maximum at 458 nm giving it a yellow-green color visible to the naked eye. Compared to many other chromoproteins, such as amilCP (BBa_K592009), amilGFP (BBa_K592010), spisPink (BBa_K1033932), asPink (BBa_K1033933) and aeBlue (BBa_K864401), the color development is slower. The color is readily observed in both LB or on agar plates after 24-48 hours of incubation. The protein amajLime has significant sequence homologies with proteins in the GFP family.
Usage and Biology
This part is useful as a reporter.
Source
Anemonia majano. The protein was first extracted and characterized by Matz et. al. under the name amFP486 (UniProtKB/Swiss-Prot: Q9U6Y6.1 GI:56749103). This version is codon optimized for E coli by Genscript.
Characterization
Team: UAlberta 2019
Summary of Contribution:
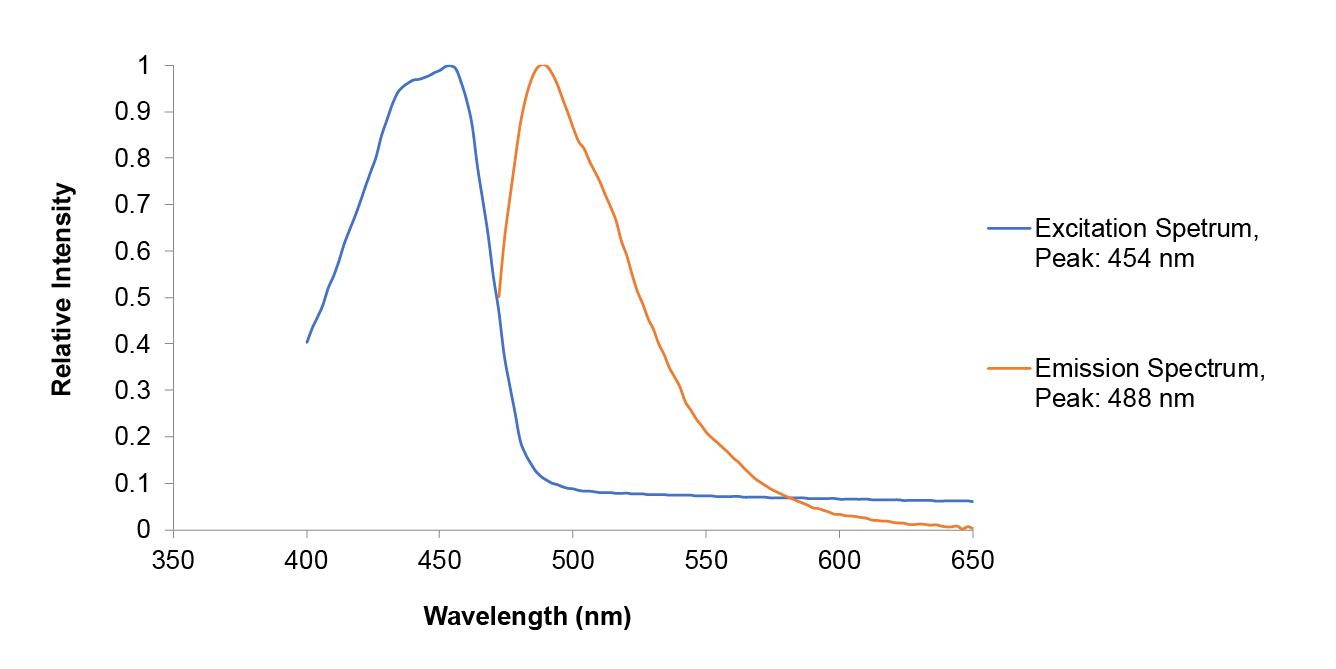
Team UAlberta repeated much of the same measurements conducted by Hong Kong-CUHK iGEM 2017 in order to provide corroboration of previously submitted data for the amajLime Chromoprotein. However, our extracted amajLime was contained in Tris-buffered Saline (50 mmol Tris-Cl, 150 mmol NaCl) and we conducted a quantum yield measurement according to established methods in [4].
| Table 1. Measurement Parameters for Fluorescence and Absorbance | |||
| Measurement Parameter | |||
| Plate Reader | Cytation5 | ||
| Plate Type | NUNC 96-Well Optical-bottom Microplate | ||
| Wavelength Step Size (nm) | 2 | ||
| Absorbance Scan: Excitation Wavelength Measurement Range (nm) | [400-700] | ||
| Fluorescence Scan: Emission Wavelength Measurement Range (nm) | [472/9-700] | ||
| Fixed Excitation Wavelength (nm) | 452/9 | ||
| Gain (G) | 50 | ||
| Number of Flashes | 10 | ||
| Optics: | Read from Bottom | ||
| Read Height (mm) | 7 | ||
| Table 2. Values Used to Determine Quantum Yield | |||
| Measurement in TBS pH 9.1 (50 mmol Tris-Cl, 150 mmol NaCl) | |||
| Measured Parameter | amajLime Sample | Fluorescein Standard | |
| Absorbance at 452 nm | 0.076 | 0.047 | |
| Integrated Fluorescence Area | 185417 | 88037 | |
| Quantum Yield | 0.50 | ||
| Relative Quantum Yield | 0.65 | ||
Discussion
Our results are consistent with the data previously obtained by Hong Kong-CUHK iGEM 2017, however, our absorbance data does display offset error at longer wavelengths. Our determined relative quantum yield for amajLime of 0.65 with a standard quantum yield of 0.5 is also consistent with the previously published value of 0.71 for wild type amajLime [4].
Group: Hong Kong-CUHK iGEM 2017
Author: Yuet Ching Lin
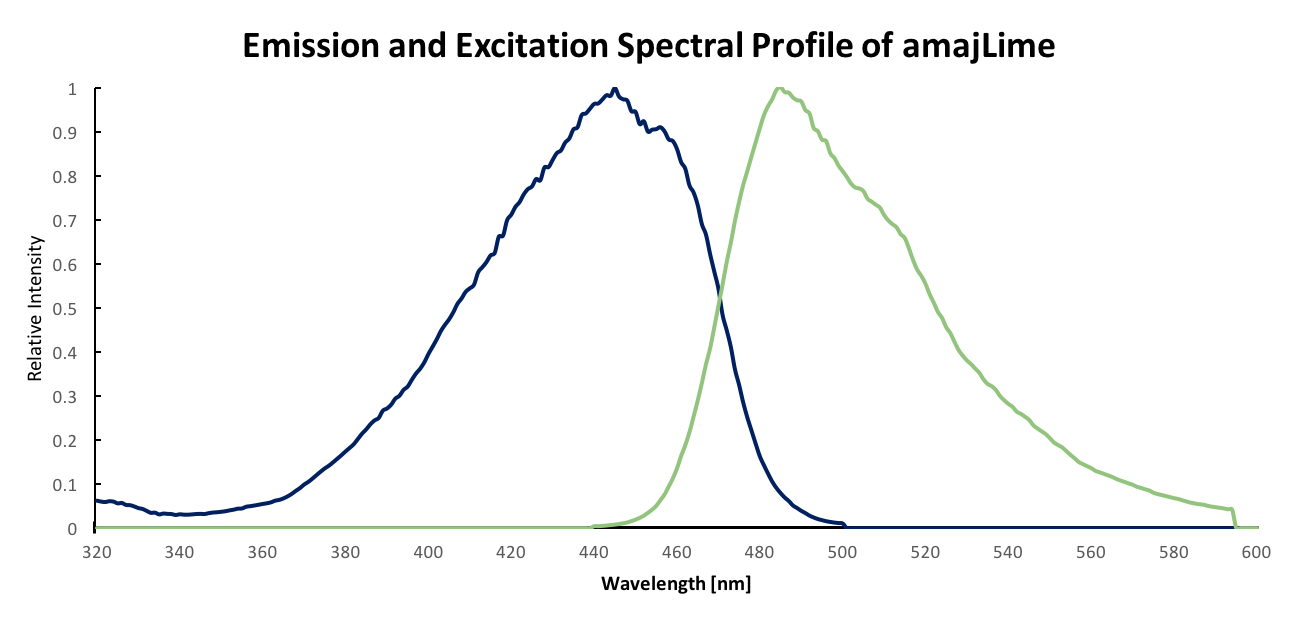
Summary: Although amajLime is described as chromoprotein in the main page, we characterized its spectral properties and found the max excitation and emission wavelength at 445 nm and 485 nm respectively
Documentation:
Fluorescent properties of amajLime:
.
Group: Hong Kong-CUHK iGEM 2017
Author: Yuet Ching Lin
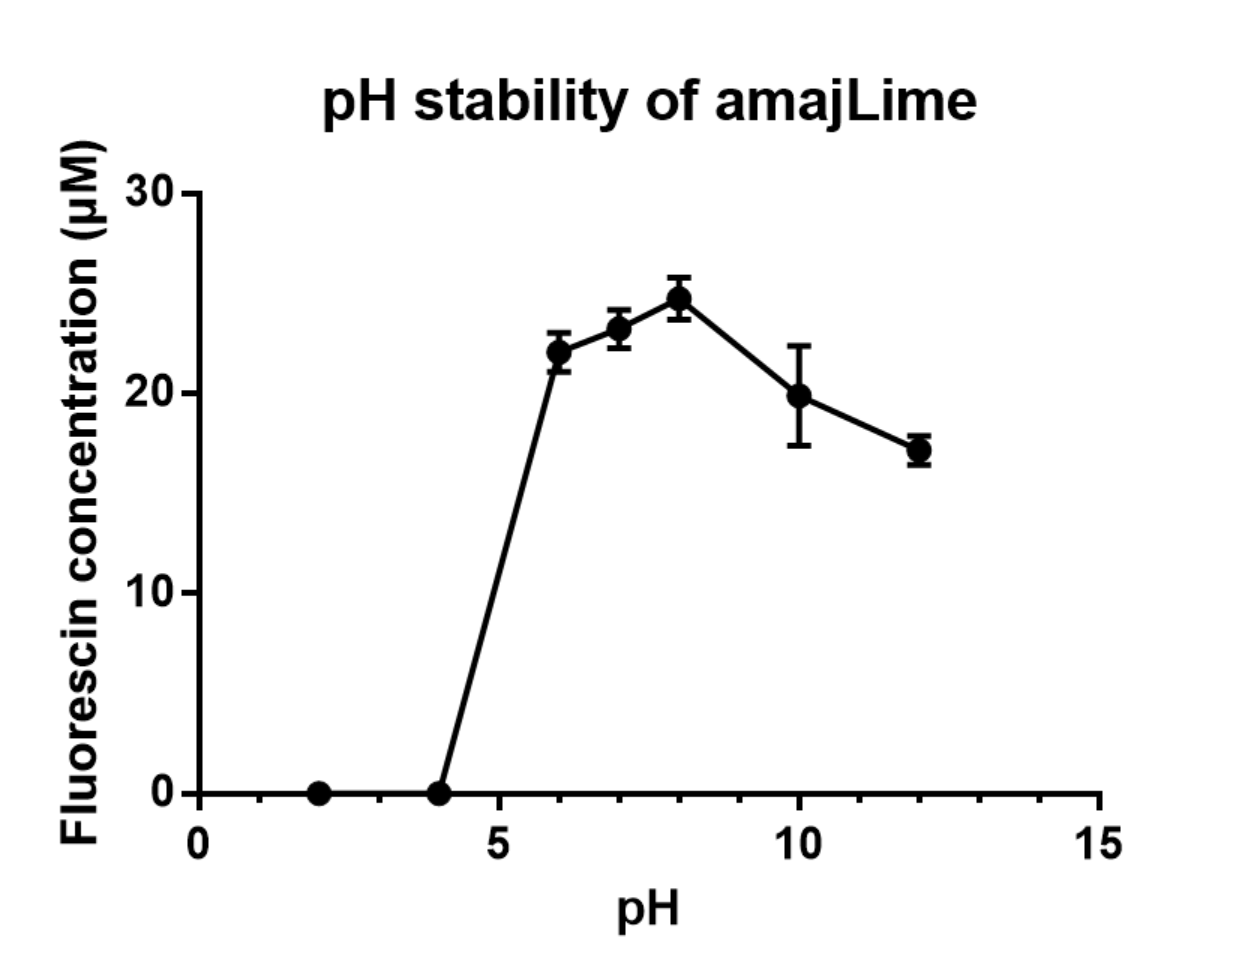
Summary: We measured the fluorescent signal of amajLime in buffers with different pH.
Documentation:
Charaterization of amajLime pH stabillity:
We transformed part BBa_K1033916 with constituitive promoter: J23100 in C41 and grew in 2XYT for 24 hours.. After purifying the amajLime by Ion Exchange Chromatography and Hydrophobic Interaction Chromatography, we measured the fluoresece (ex ,em ) of purified amajLime, which is diluted to 10µg/100µl (total 200µl) in triplicates, into different buffers (ranges from pH2 to pH12; Volume of amajLime:buffer = 1:4.3). To facilitate reproducibility of the experiment, we correlated the relative fluorescent intensity to an absolute fluorophore concentration by referring it to a standard curve of the corresponding fluorophores(Fluorescein) using the interlab study protocol. The result shows that the stability drops dramatically in pH condition below 6 and relatively stable in pH 6-10.
| Measurement Type | Fluorescence |
| Microplate name | COSTAR 96 |
| Scan mode | orbital averaging |
| Scan diameter [nm] | 3 |
| Excitation | 470-15 |
| Emission | 515-20 |
| Dichronic filter | auto 491.2 |
| Gain | 500 |
| Focal height [nm] | 9 |
NJTech_China 2020’s Characterisation
While most of our project was focused on signaling pathways of yeasts, we were also interested in chromoproteins. Specifically, we characterized the expression of amajLime and eforRed.
The amajLime sequence (Part:BBa_K1033916) optimized for E. coli was incorporated into plasmid pET-28a(+), transformed into E. coli BL21 for characterization and measurement. We provided amajLime with results and data based on protein expression and purification, TOF-Mass spectrometry, full wavelength measurement and Swiss-model.
Methods:
SDS-PAGE, TOF-Mass Spectrometry, BCA (Bicinchoninic acid) method, full wavelength measurement and Swiss-Model.
Results
Conclusion: The cell pellet was collected by harvesting 50mL culture after 24h of induction followed by centrifugation at 4 degrees and 6000 rpm for 10min. Then, we performed ultrasonic disruption and collected the supernatant after centrifugation. The protein was purified and collected through ultrafiltration and affinity chromatography.
1· amajLime- The culture after IPTG induction.
2· amajLime- The pellet after IPTG induction and ultrasound.
3· amajLime- Supernatant after IPTG induction and sonication.
4· amajLime- The culture without IPTG induction.
5· amajLime- The pellet without IPTG induction after ultrasound.
6· amajLime- Supernatant sample without IPTG induction after sonication.
7· amajLime- Protein sample after the ultrafiltration (diluted 20 times).
8· amajLime- Purified protein sample.
Conclusion: The protein gel preliminarily proved that the molecular mass of the amajLime protein was correct, which is consistent with the expected molecular mass of amajLime protein (the molecular mass of amajLime protein is about 26.8 kDa). Compared with lane 4, 5 and 6, lane 1, 2, and 3 indicate that more amajLime protein can be obtained with IPTG induction. As is shown in lane 7, the concentration of protein was increased after ultrafiltration concentration. Lane 8 shows that the purification effect of protein after nickel affinity chromatography was better, and the impurity protein was less than before affinity chromatography. In conclusion, it can be seen that our expression and purification strategy is effective.
We used the BCA (Bicinchoninic acid) method to measure the concentration of amajLime protein.
The concentration of blue chromoprotein was 0.6608 mg/ml.
The standard protein curve fitting equation (R2=0.96888) :
y=4.09079x+0.42975
It comes out that:
The concentration of amajLime is 0.6608 mg/ml.
Conclusion : We performed Time of Flight Mass Spectrometer on the purified HIS-tagged amajLime protein. The predicted molecular mass of this protein is about 26840Da. The result of TOF-Mass Spectrometry showed that the specific molecular mass of amajLime protein is 26.898kDa (the value of the sharpest peak is shown as the molecular mass of amajLime protein). Moreover, the intensity of 26.898kDa is up to 4x10⁵, which indicates the high concentration and purity of the amajLime protein. There are also some small protein peaks, suggesting that the noise had some effect, but not much.
amajLime protein full-wavelength scan profile :
1-198nm 2.551A
2-210nm 2.683A
3-276nm 0.146A
4-454nm 0.135A
Conclusion : The full-wavelength scan of amajLime protein shows that the strongest absorption peak of amajLime protein occurs at 210nm. As shown in the results, amajLime has a low intensity peak at 400 to 450 nm, which may be due to the fluorescence excitation demonstrated by previous teams such as Hong Kong-CUHK iGEM 2017.
Conclusion : The full wavelength measurement of amajLime (359-660nm) was compared with the excitation spectrum figure of 2013UPPSALA , indicating that the results of amajLime protein characterized by our team were similar to those of 2013 UPPSALA and Hong Kong-CUHK iGEM 2017.
Structural modeling results of the amajLime protein based on Swiss-Model
Conclusion: We used Swiss-Model to simulate the three-dimensional structure of amajLime protein. The above figures showed the modeling result of Swiss-Model.
References
[http://www.nature.com/nbt/journal/v17/n10/full/nbt1099_969.html] Matz, Mikhail V., et al. "Fluorescent proteins from nonbioluminescent Anthozoa species." Nature biotechnology 17.10 (1999): 969-973.
[http://www.pnas.org/content/102/36/12712.short] Henderson, J. Nathan, and S. James Remington. "Crystal structures and mutational analysis of amFP486, a cyan fluorescent protein from Anemonia majano." Proceedings of the National Academy of Sciences of the United States of America 102.36 (2005): 12712-12717.
[http://www.ncbi.nlm.nih.gov/pubmed/18648549] Alieva, N. O., et al. 2008. Diversity and evolution of coral fluorescent proteins. PLoS One 3:e2680.
[1] P. J. Cranfill et al., “Quantitative assessment of fluorescent proteins,” Nat. Methods, vol. 13, no. 7, pp. 557–562, Jun. 2016.
Sequence and Features
- 10COMPATIBLE WITH RFC[10]
- 12COMPATIBLE WITH RFC[12]
- 21COMPATIBLE WITH RFC[21]
- 23COMPATIBLE WITH RFC[23]
- 25COMPATIBLE WITH RFC[25]
- 1000COMPATIBLE WITH RFC[1000]
Functional Parameters: Austin_UTexas
Burden Imposed by this Part:

Burden is the percent reduction in the growth rate of E. coli cells transformed with a plasmid containing this BioBrick (± values are 95% confidence limits). This BioBrick did not exhibit a burden that was significantly greater than zero (i.e., it appears to have little to no impact on growth). Therefore, users can depend on this part to remain stable for many bacterial cell divisions and in large culture volumes. Refer to any one of the BBa_K3174002 - BBa_K3174007 pages for more information on the methods, an explanation of the sources of burden, and other conclusions from a large-scale measurement project conducted by the 2019 Austin_UTexas team.
This functional parameter was added by the 2020 Austin_UTexas team.

