Difference between revisions of "Part:BBa K3182108"
| (49 intermediate revisions by 5 users not shown) | |||
| Line 7: | Line 7: | ||
<h1>Introduction</h1> | <h1>Introduction</h1> | ||
| − | <partinfo>BBa_K3182108 short</partinfo>[[File:T--Linkoping_Sweden--fusionproteinillustration.jpg|420px|thumb|right|<b>Figure 1.</b> Mechanism of action for Novosite. The | + | <partinfo>BBa_K3182108 short</partinfo> |
| + | [[File:T--Linkoping_Sweden--fusionproteinillustration.jpg|420px|thumb|right|<b>Figure 1.</b> Mechanism of action for Novosite. The CBD<sub>cipA</sub>-fusion is attached to a polysaccaride material. By adding thrombin from any source the fusion protein will be cleaved and the C-terminal fusion protein will be released into the solution. By changing the fusion protein to an antimicrobial peptide/enzyme, and using the material as a bandage, the peptide/enzyme can be released into a wound by native human thrombin.]] | ||
| − | This part consists of a carbohydrate binding domain (CBD) from Clostridium thermocellum (C. thermocellum) cellulose scaffolding protein (CipA). This binding domain is a central part of Clostridium thermocellum's cellusome and has a strong affinity for cellulose. The CBD was fused to another protein using a flexible GS-linker (-GGGGSGGGGS-)in order to attach this complex to a polysaccaride material. A thrombin cleavage site (-LVPRGS-) was added to the end of the linker and its breakage will leave a glycine and serine attached to the N-terminal of the fusion protein. | + | This part consists of a carbohydrate binding domain (CBD) from <i>Clostridium thermocellum (C. thermocellum)</i> cellulose scaffolding protein (CipA). This binding domain is a central part of <i>Clostridium thermocellum's</i> cellusome and has a strong affinity for cellulose. The CBD was fused to another protein using a flexible GS-linker (-GGGGSGGGGS-) in order to attach this complex to a polysaccaride material. A thrombin cleavage site (-LVPRGS-) was added to the end of the linker and its breakage will leave a glycine and serine attached to the N-terminal of the fusion protein. The main mechanism of iGEM19 Linköping's project can be seen in Figure 1. |
<h3>Protease site and use</h3> | <h3>Protease site and use</h3> | ||
| Line 17: | Line 18: | ||
An internal BamHI recognition sequence (RS) has been added to enable interchangeable fusion proteins to the CBD. BamHI was chosen because its RS codes for glycine and serine, fitting it to the end of the thrombin site. It is also a cost-effective enzyme and is unaffected by methylated DNA. BamHI is a part of the RFC21 standard. | An internal BamHI recognition sequence (RS) has been added to enable interchangeable fusion proteins to the CBD. BamHI was chosen because its RS codes for glycine and serine, fitting it to the end of the thrombin site. It is also a cost-effective enzyme and is unaffected by methylated DNA. BamHI is a part of the RFC21 standard. | ||
| − | + | <br> | |
| − | <h2> | + | <h2>CBD<sub>cipA</sub> crystal structure</h2> |
| − | [[File:T--Linkoping_Sweden--rotatingcbdanimationloop.gif|420px|thumb|left|<b>Figure 2.</b> Crystal structure of | + | [[File:T--Linkoping_Sweden--rotatingcbdanimationloop.gif|420px|thumb|left|<b>Figure 2.</b> Crystal structure of CBD<sub>cipA</sub> with a resolution of 1.75 Å which were solved by [http://www.ncbi.nlm.nih.gov/pmc/PMC452321 Tormo et al. 1989]. PDB code 1NBC. In red from the left, W118, R112, D56, H57 and Y67, thought to be the surface which interacts strongly with polysaccarides.]] |
<h3>Important molecular faces</h3> | <h3>Important molecular faces</h3> | ||
| − | + | CBD<sub>cipA</sub> is composed of a nine-stranded beta sandwich with a jelly roll topology and binds a calcium ion, which can be seen in Figure 2. It further contains conserved residues exposed on the surface which map into two clear surfaces on each side of the molecule. One of the faces mainly contains planar strips of aromatic and polar residues which may be the carbohydrate binding part. Further aspects are unknown and unique to this CBD such as the other conserved residues which are contained in a groove. | |
<h3>Carbohydrate binding domain specificity</h3> | <h3>Carbohydrate binding domain specificity</h3> | ||
| Line 30: | Line 31: | ||
<h3>The choice of carbohydrate binding domain</h3> | <h3>The choice of carbohydrate binding domain</h3> | ||
| − | iGEM Linköping 2019 chose | + | iGEM Linköping 2019 chose CBD<sub>cipA</sub> due to the fact that many other iGEM teams had explored the possibilities of this domain. Our basic design was influenced by [http://2014.igem.org/Team:Imperial iGEM14 Imperial], [http://2015.igem.org/Team:edinburgh iGEM15 Edinburgh] and [http://2018.igem.org/Team:ecuador iGEM18 Ecuador]. Purification and where to place the fusion protein (N- or C-terminal) was determined by studying the former projects. CBD<sub>cipA</sub> also originates from a thermophilic bacteria which further increases the domain's applications. |
| − | + | ||
| − | + | ||
| − | + | ||
<br><br> | <br><br> | ||
<h2>Expression system</h2> | <h2>Expression system</h2> | ||
| − | + | The part has a strong expression with a T7-RNA-polymerase promotor (<partinfo>BBa_I719005</partinfo>), seen in Figure 3, as well as a 5'-UTR (<partinfo>BBa_K1758100</partinfo>) region which has been shown to further increase expression in <i>Escherichia coli</i> (<i>E. coli</i>) (<partinfo>BBa_K1758106</partinfo>), ([http://www.ncbi.nlm.nih.gov/pubmed/2676996 Olins et al. 1989]), ([http://www.ncbi.nlm.nih.gov/pubmed/23927491 Takahashi et al. 2013]). | |
| − | The part has a | + | |
[[File:T--Linkoping_Sweden--expression.png|900px|thumb|center|<b>Figure 3.</b> Benchling screenshot of the expression system. The T7-RNA-polymerase promotor is followed by a T7 g10 leader sequence which enhances the binding to the 16S ribosomal RNA. After the leader sequence a poly A spacer is found, which has been shown to increase translation in vitro. Before the start codon a strong RBS, g10-L, followed by an AT-rich spacer can be seen, which will slightly increase translation of the following gene.]] | [[File:T--Linkoping_Sweden--expression.png|900px|thumb|center|<b>Figure 3.</b> Benchling screenshot of the expression system. The T7-RNA-polymerase promotor is followed by a T7 g10 leader sequence which enhances the binding to the 16S ribosomal RNA. After the leader sequence a poly A spacer is found, which has been shown to increase translation in vitro. Before the start codon a strong RBS, g10-L, followed by an AT-rich spacer can be seen, which will slightly increase translation of the following gene.]] | ||
| + | |||
<h1>Usage and Biology</h1> | <h1>Usage and Biology</h1> | ||
| + | <h2>Domain affinity</h2> | ||
[[Image:T--Linkoping_Sweden--CBD-sfGFPbind.png|300px]] | [[Image:T--Linkoping_Sweden--CBD-sfGFPbind.png|300px]] | ||
[[Image:T--Linkoping_Sweden--CBD-sfGFPstorodl4.jpeg|300px]] | [[Image:T--Linkoping_Sweden--CBD-sfGFPstorodl4.jpeg|300px]] | ||
[[Image:T--Linkoping_Sweden--CBD-sfGFPrör4.jpeg|300px]] | [[Image:T--Linkoping_Sweden--CBD-sfGFPrör4.jpeg|300px]] | ||
| − | <b>Figure 4</b> Picture 1: Binding studies of the | + | <b>Figure 4</b> Picture 1: Binding studies of the CBD<sub>cipA</sub>-sfGFP bound to bacterial cellulose. Washed three times with either 70 % ethanol, PBS or deionized water. Picture 2: Induced culture after 16 hours. <i>E. coli</i> BL21 (DE3) cells were grown in prescence of 25 ug/mL chlorampenicol until an OD<sub>600</sub> of 0.8 at 37 °C, and later induced with 0.5 mM IPTG. The induced culture were then incubated in 18 °C for 16 hours. Picture 3: Left: CBD<sub>cipA</sub>-sfGFP bound to bacterial cellulose (Epiprotect, S2Medical) in form of a thin film, right: bacterial cellulose (Epiprotect, S2Medical) reference. Binding of CBD<sub>cipA</sub>-sfGFP was done the same way as the pictures below. |
<br><br> | <br><br> | ||
| Line 54: | Line 53: | ||
[[Image:T--Linkoping_Sweden--CBD-sfGFPrör3.jpeg|300px]] | [[Image:T--Linkoping_Sweden--CBD-sfGFPrör3.jpeg|300px]] | ||
| − | <b>Figure 5</b> Picture 1: Lysate containing | + | <b>Figure 5</b> Picture 1: Lysate containing CBD<sub>cipA</sub>-sfGFP with bacterial cellulose (Epiprotect, S2Medical) before incubation. Picture 2: Lysate (CBD<sub>cipA</sub>-sfGFP) bound to bacterial cellulose after incubation in room temperature for 30 minutes on an end-to-end rotator. Picture 3: Bacterial cellulose after incubation with 70 % ethanol in room temperature for 30 minutes on an end-to-end rotator. All pictures were taken on a 302 nm UV-table for better visualisation of the result. |
<br><br> | <br><br> | ||
| − | [[File:T--Linkoping_Sweden--agarosescbdsfpgf.png|900px|thumb|center|<b>Figure 6.</b> The negative controls refers to the agarose and agarose powder not being exposed to the CBD-sfGFP containing lysate. <I>A and B: </I>Agarose 2 | + | [[File:T--Linkoping_Sweden--agarosescbdsfpgf.png|900px|thumb|center|<b>Figure 6.</b> The negative controls refers to the agarose and agarose powder not being exposed to the CBD-sfGFP containing lysate. <I>A and B: </I>Agarose 2.2 % was used in. In <I>A</I> the agarose can be observed in normal white light and in <I>B</I> the agarose was put on an UV-table (302 nm). <I>C and D</I>: Agarose powder was incubated in ]] |
| − | In | + | In Figure 6 the same BL21CBD-sfGFP lysate was used and the samples were incubated the same amount of time, 30 min in room temperature. Both the CBD-sfGFP bound agarose and agarose that was not incubated CBD-sfGFP was washed in 70 % ethanol once. The agarose with CBD-sfGFP bound achieved a yellow tint in comparison to the agarose with no CBD-sfGFP which was the original transparent color. |
| − | [[File:T--Linkoping_Sweden--cottonandjelonet.png|400px|thumb|right|<b>Figure 7.</b> The cotton (A) and jelonet +parafin and -parafin (B) without sfGFP written out refers to negative controls. Both pictures are taken with a UV-table ( | + | [[File:T--Linkoping_Sweden--cottonandjelonet.png|400px|thumb|right|<b>Figure 7.</b> The cotton (A) and jelonet +parafin and -parafin (B) without sfGFP written out refers to negative controls. Both pictures are taken with a UV-table (302 nm). <I>A</I> Cotton was incubated in bacterial lysate containing CBD-sfGFP for 30 min and both cotton samples were washed with 70 % ethanol before analyzing on the UV-table.<I>B</I> The jelonet bandage was either washed with detergents to remove paraffin (-paraffin) or not (+paraffin). CBD-sfGFP -paraffin was incubated 30 min and washed with 70 % ethanol three times. ]] |
<br><br> | <br><br> | ||
| − | The samples in | + | The samples in Figure 7 were incubated in the same BL21 (DE3)lysate for 30 min and then washed three times with 70 % ethanol. In <i>A</i> normal cotton was incubated in sfGFP whilst in <i>B</i> a bandage called Jelonet was used. Jelonet contains cotton threads that are covered in paraffin. We discovered that the paraffin inhibited the binding of CBD-sfGFP, therefore using detergent we removed it for the CBD-sfGFP incubation. |
<br><br> | <br><br> | ||
| − | All of the | + | All of the Figures above are to illustrate the modularity of the CBD, proving that it does not only bind to cellulose such as in the first Figures, but also to other polysaccharide based materials. By binding CBD-sfGFP to Jelonet we aimed to prove that the construct can be bound to and improve already existing materials in the medical field. Jelonet is commonly used for open wounds such as burn wounds, both in order to create some antibacterial barrier and also to prevent the wounds sticking to gauze used above jelonet. |
<br><br> | <br><br> | ||
| − | The bacterial cellulose bandage used in | + | The bacterial cellulose bandage used in Figures 4 and 5 is named Epiprotect and is produced by S2Medical. Epiprotect is currently used for wounds such as burn wounds and chronic wounds. These tests were also performed to prove that the construct can be used in existing medical products. In Figures 11, 12 and 13 Epiprotect was used to observe the functionality of the thrombin cleavage mechanism of the construct. |
| − | + | <br><br> | |
| + | <h3>Epifluorescent microscopy</h3> | ||
| + | A cellulose bandage (Epiprotect, S2Medical) was incubated for 1 h at R.T in CBD-sfGFP lysate from BL21 (DE3) and afterwards washed thrice with 1 mL ethanol 70 %. The Negative control (Figure 8D-F) was washed thrice with 70 % ethanol. The bandages were mounted on a microscopy slide and photographed with a epifluorescent microscope. The relative fluorescent units (RFU) were measured in five places with one being a blank (bottom left corner, Figure 8B and E). The excitation was 485 nm and emission could be plotted in the graphs (Figure 8C and F) at approximately 510 nm. Figure 8A and D is broad spectrum photos while figure 8B and E is only the green spectrum captured. | ||
| + | [[File:T--Linkoping_Sweden--sfgfpmicro.png|900px|thumb|right|<b>Figure 8.</b> Figure 8A and D are broad spectrum captures of the CBD-sfGFP incubated bandage (A) or the negative control which has not been incubated (D). A capture of only the green spectra at 485 was performed in Figure 8B and E where five points were measured, including one blank at the corner where the bandage was not present (1-4, Blank). These five points were plotted against wavelength in C and F to measure emission.]] | ||
<br><br><br><br><br><br><br><br><br><br> | <br><br><br><br><br><br><br><br><br><br> | ||
| + | |||
| + | |||
<h2> Purification of CBD-sfGFP</h2> | <h2> Purification of CBD-sfGFP</h2> | ||
| − | [[File:T--Linkoping_Sweden--sfgfp-cbd-elution.png|500px|thumb|left|<b>Figure | + | [[File:T--Linkoping_Sweden--sfgfp-cbd-elution.png|500px|thumb|left|<b>Figure 9.</b>Purification with 2g of cellulose (Whatman, #CF11 medium length cellulose fibres) in a column. The first striped bar is the flow through after adding BL21 (DE3) Gold lysate. The black bars are the RFU of the 70 % ethanol washes. The blue bars are the distilled water (dH<sub>2</sub>O) elutions in which 1 mL dH<sub>2</sub>O was added until the column stopped dropping. The red and grey ethanol 70 % and dH<sub>2</sub>O bars illustrate the possible interfering RFU values of each fluid.]] |
| − | CBD-sfGFP was purified with | + | CBD-sfGFP was purified with 2 g cellulose fibers medium length (Whatman, #CF11 medium length cellulose fibres) in a column. The first striped graph is the flow through after adding BL21 (DE3) Gold lysate. |
<br><br> | <br><br> | ||
| − | The different washes of 70% ethanol (black bars) was to remove unspecifically bound CBD-sfGFP, leading to the bound CBD-sfGFP remaining. This can be seen in the bar graph due to the drastic drop of sfGFP elution which means that the 70% ethanol is not useful for CBD-sfGFP elution. The water washes ( | + | The different washes of 70 % ethanol (black bars) was to remove unspecifically bound CBD-sfGFP, leading to the bound CBD-sfGFP remaining. This can be seen in the bar graph due to the drastic drop of sfGFP elution which means that the 70 % ethanol is not useful for CBD-sfGFP elution. The water washes (dH<sub>2</sub>O, blue bars) indicate that an efficient elution of CBD-sfGFP can be performed within the first 4-6 elutions of dH<sub>2</sub>O. The last two bars (red, ethanol 70 % and grey, dH<sub>2</sub>O) indicate the endogenous fluorescent abilities of each solution. It is minimal for ethanol and none for dH<sub>2</sub>O. |
<br><br> | <br><br> | ||
| − | The washes and elutions can be observed in an SDS-gel in | + | The washes and elutions can be observed in an SDS-gel in Figure 13 below. In which the lanes 3-6 contain the four washes with 70 % ethanol and lanes 7-10 contain the four first elution fractions with dH<sub>2</sub>O. |
<br><br><br><br><br><br><br><br> | <br><br><br><br><br><br><br><br> | ||
| − | <h2> Binding | + | <h2> Binding assay of CBD-sfGFP </h2> |
| − | [[File:T--Linkoping_Sweden--progressive_sfGFP_binding_assay.jpeg|420px|thumb|left|<b>< | + | [[File:T--Linkoping_Sweden--progressive_sfGFP_binding_assay.jpeg|420px|thumb|left|<b><i>Figure 10.</i></b> This graph describes the fluorescence of CBD-sfGFP lysate after incubation with cellulose CF11. The volume of bacterial lysate remained constant at 700 uL and the mass of cellulose CF11 was varied between 0-100 mg, which can be seen on the x-axis. The fluorescence was plotted on the y-axis and was measured at emission 510 nm with a gain of 40.]] |
| − | The illustration to the left | + | The illustration to the left (Figure 10), shows that increasing mass of cellulose CF11 fibers leads to elevated the of CBD-sfGFP. |
<br><br> | <br><br> | ||
| − | To make the binding assay, Eppendorf tubes with varying mass of cellulose (Whatman, #CF11 medium length cellulose fibres) between 0 - 100 mg was mixed with a constant volume of CBD-sfGFP lysate (700 uL) and vortexed. The tubes | + | To make the binding assay, Eppendorf tubes with varying mass of cellulose (Whatman, #CF11 medium length cellulose fibres) between 0 - 100 mg was mixed with a constant volume of CBD-sfGFP lysate (700 uL) and vortexed. The tubes were then attached to an end-to-end rotator for 30 minutes, thereafter they were placed in a tube holder until the cellulose powder settled in the bottom and the supernatant containing lysate was clear from cellulose. |
After that 100 µL from each of the supernatants was applied on a plate reader which measured the fluorescence of CBD-sfGFP at 485 nm. | After that 100 µL from each of the supernatants was applied on a plate reader which measured the fluorescence of CBD-sfGFP at 485 nm. | ||
| − | <br><br> | + | <br><br> |
| − | + | <br><br> | |
| − | + | <br><br> | |
| − | + | <br><br> | |
| − | + | ||
| − | + | ||
| − | + | ||
| − | + | ||
| − | + | ||
| − | + | ||
| − | + | ||
| − | + | ||
| − | + | ||
| − | + | ||
| − | + | ||
| − | + | ||
| − | <br><br> | + | |
| − | + | ||
| + | <br><br> | ||
| + | <br><br> | ||
| + | <br><br> | ||
| + | <br><br> | ||
| + | <br><br> | ||
<h2>Reporter of successful cleavage and release from the cellulose binding domain</h2> | <h2>Reporter of successful cleavage and release from the cellulose binding domain</h2> | ||
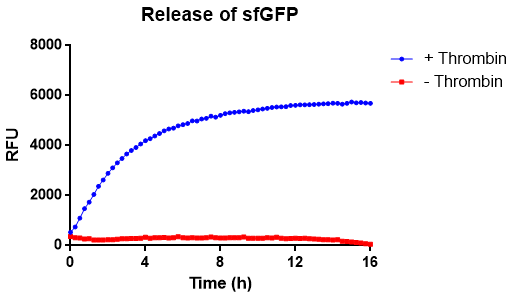
| − | [[File:T--Linkoping_Sweden--trombinövertid.png|420px|thumb|left|<b>Figure 11.</b> A kinetic experiment of | + | [[File:T--Linkoping_Sweden--trombinövertid.png|420px|thumb|left|<b>Figure 11.</b> A kinetic experiment of thrombin's protease activity. Bacterial cellulose, with CBD<sub>cipA</sub>-sfGFP attached,was analyzed spectrophotometrically.]] |
| − | <h3> | + | <h3>Spectrophotometric analysis of thrombin cleavage</h3> |
| − | In | + | In Figure 11 the release of sfGFP from the bacterial cellulose bandage (Epiprotect, S2Medical) can be seen over time. The approximate area och the cellulose was 1 cm<sup>2</sup>. The cellulose-CBD-sfGFP were attached to the side of wells of a 96-well plate using strings, allowing the spectrophotometer to measure the supernatant in the center of the well, bottom up (ex. 485 nm, em. 510 nm) for 16 hours. The well further contained 200 uL 1X thrombin cleavage buffer (20 mM Tris-HCl, 150 mM NaCl and 2.5 mM CaCl<sub>2</sub>). In the positive sample, measuring thrombin cleavage (blue), an amount of 0.03 units of human thrombin (Novagen) was added. In the graph (blue), successful release of sfGFP from the CBD can be seen. The maximun amount of fluorescence is reached after about 8 h. In red, the negative control experiment can be seen, where thrombin buffer was added containing no thrombin. No significant amount of fluorescence can be observed. The temperature was set to 37 °C. A visual representation of this can be observed below in Figure 12. |
| − | + | <br><br> | |
| − | [[File:T--Linkoping_Sweden--Thrombincontrolphoto.jpg|420px|thumb|left|<b>Figure 12.</b> Visual control of human thrombin protease activity. Bacterial cellulose was incubated with CBD-sfGFP for 30 minutes on an end-to-end rotator in room temperature. The samples were incubated | + | [[File:T--Linkoping_Sweden--Thrombincontrolphoto.jpg|420px|thumb|left|<b>Figure 12.</b> Visual control of human thrombin protease activity. Bacterial cellulose was incubated with CBD-sfGFP for 30 minutes on an end-to-end rotator in room temperature. The samples were incubated either in only thrombin cleavage buffer (negative control) or thrombin and thrombin cleavage buffer (thrombin (+)) over-night on an end-to-end rotator in room temperature.]] |
<h3>Visual experiment of thrombin cleavage</h3> | <h3>Visual experiment of thrombin cleavage</h3> | ||
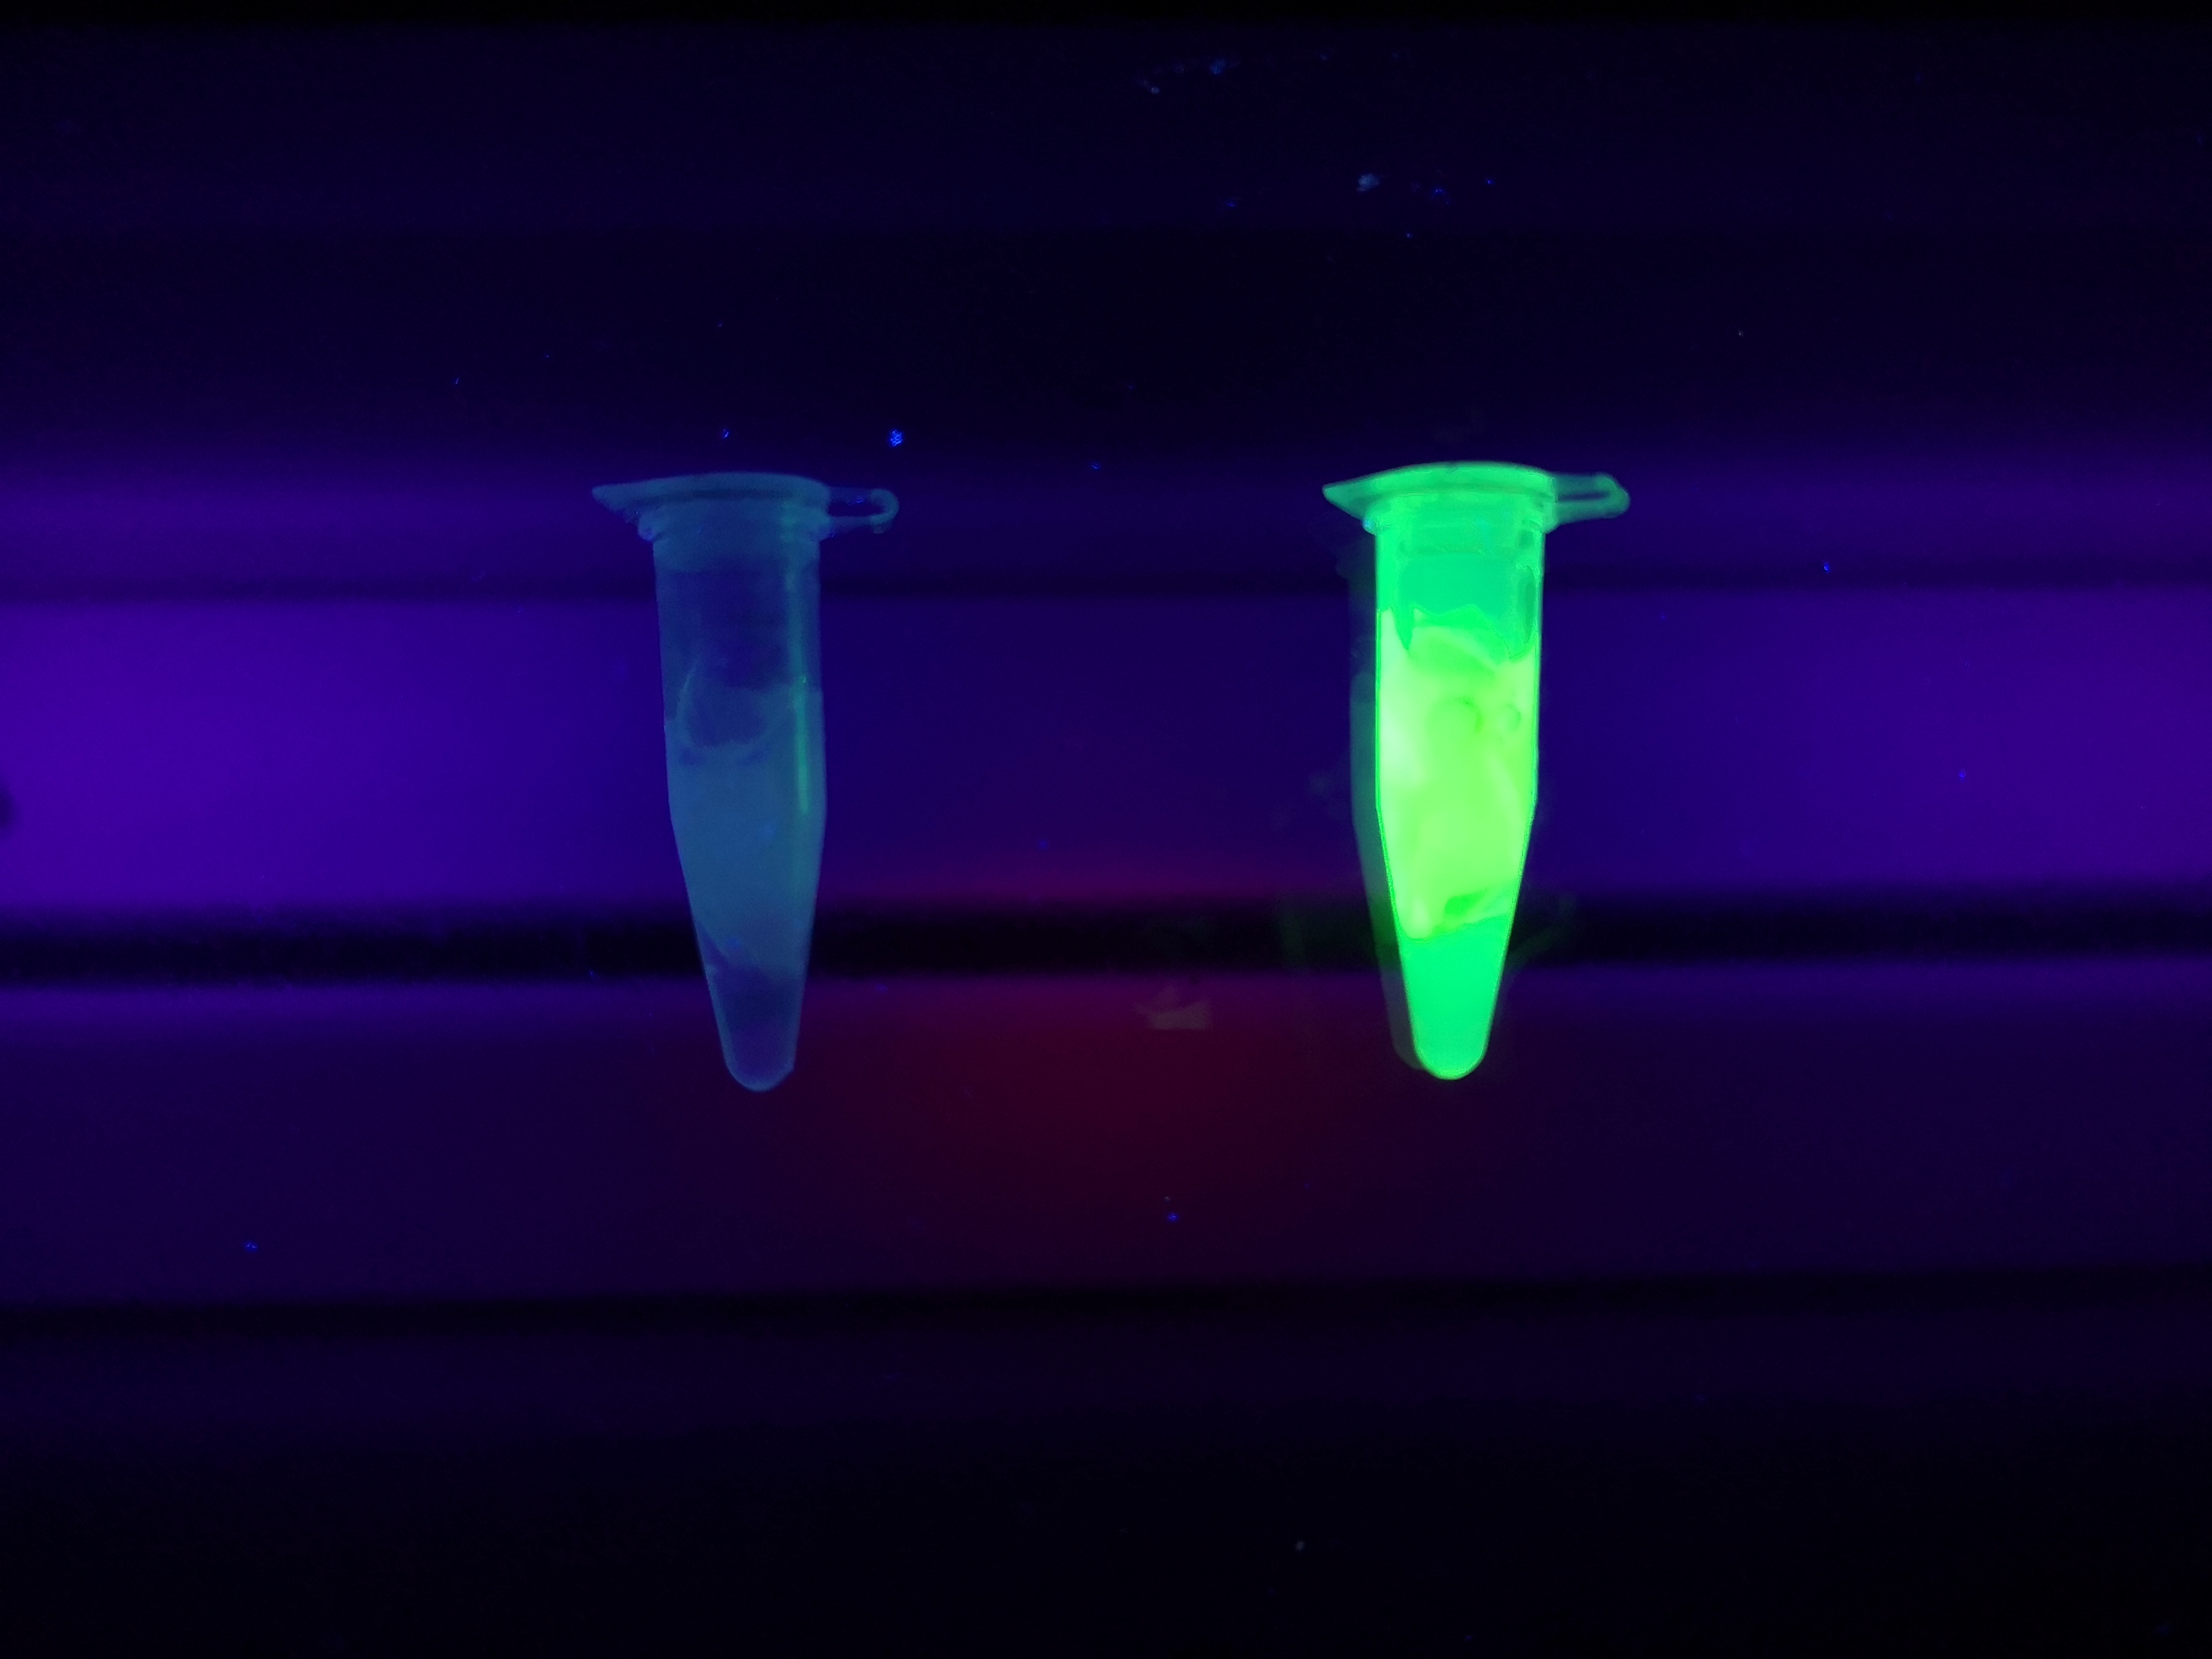
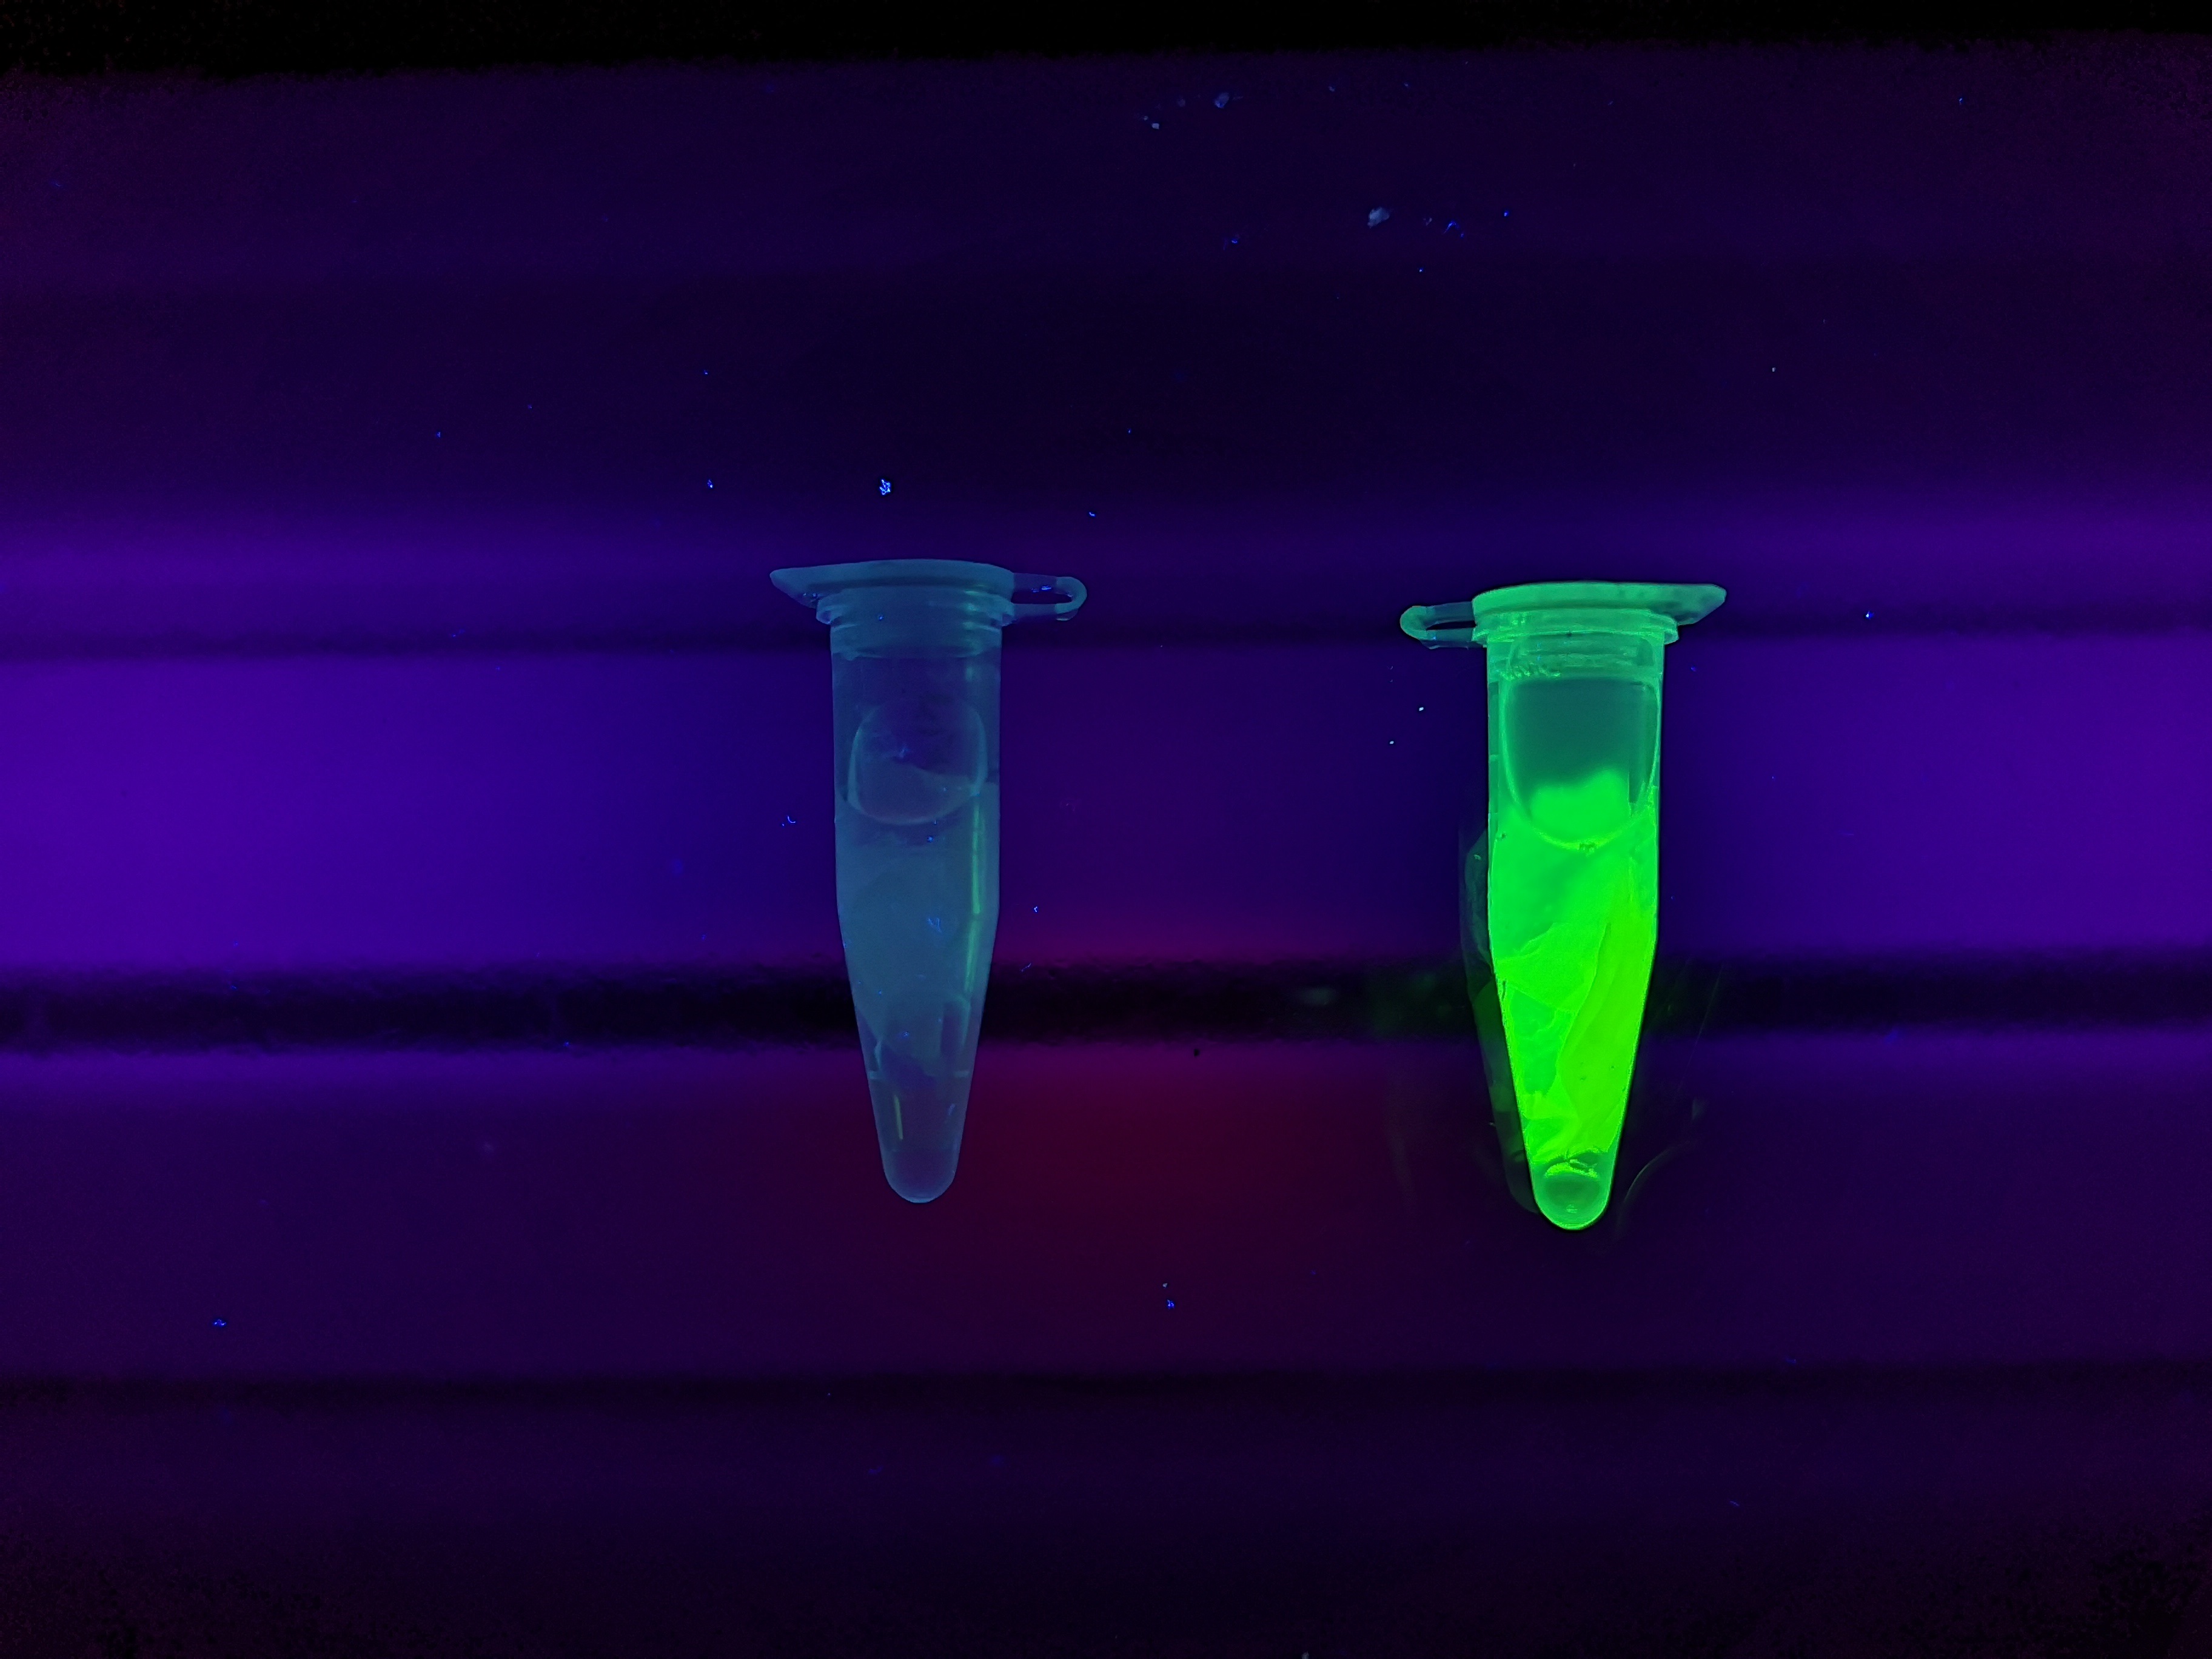
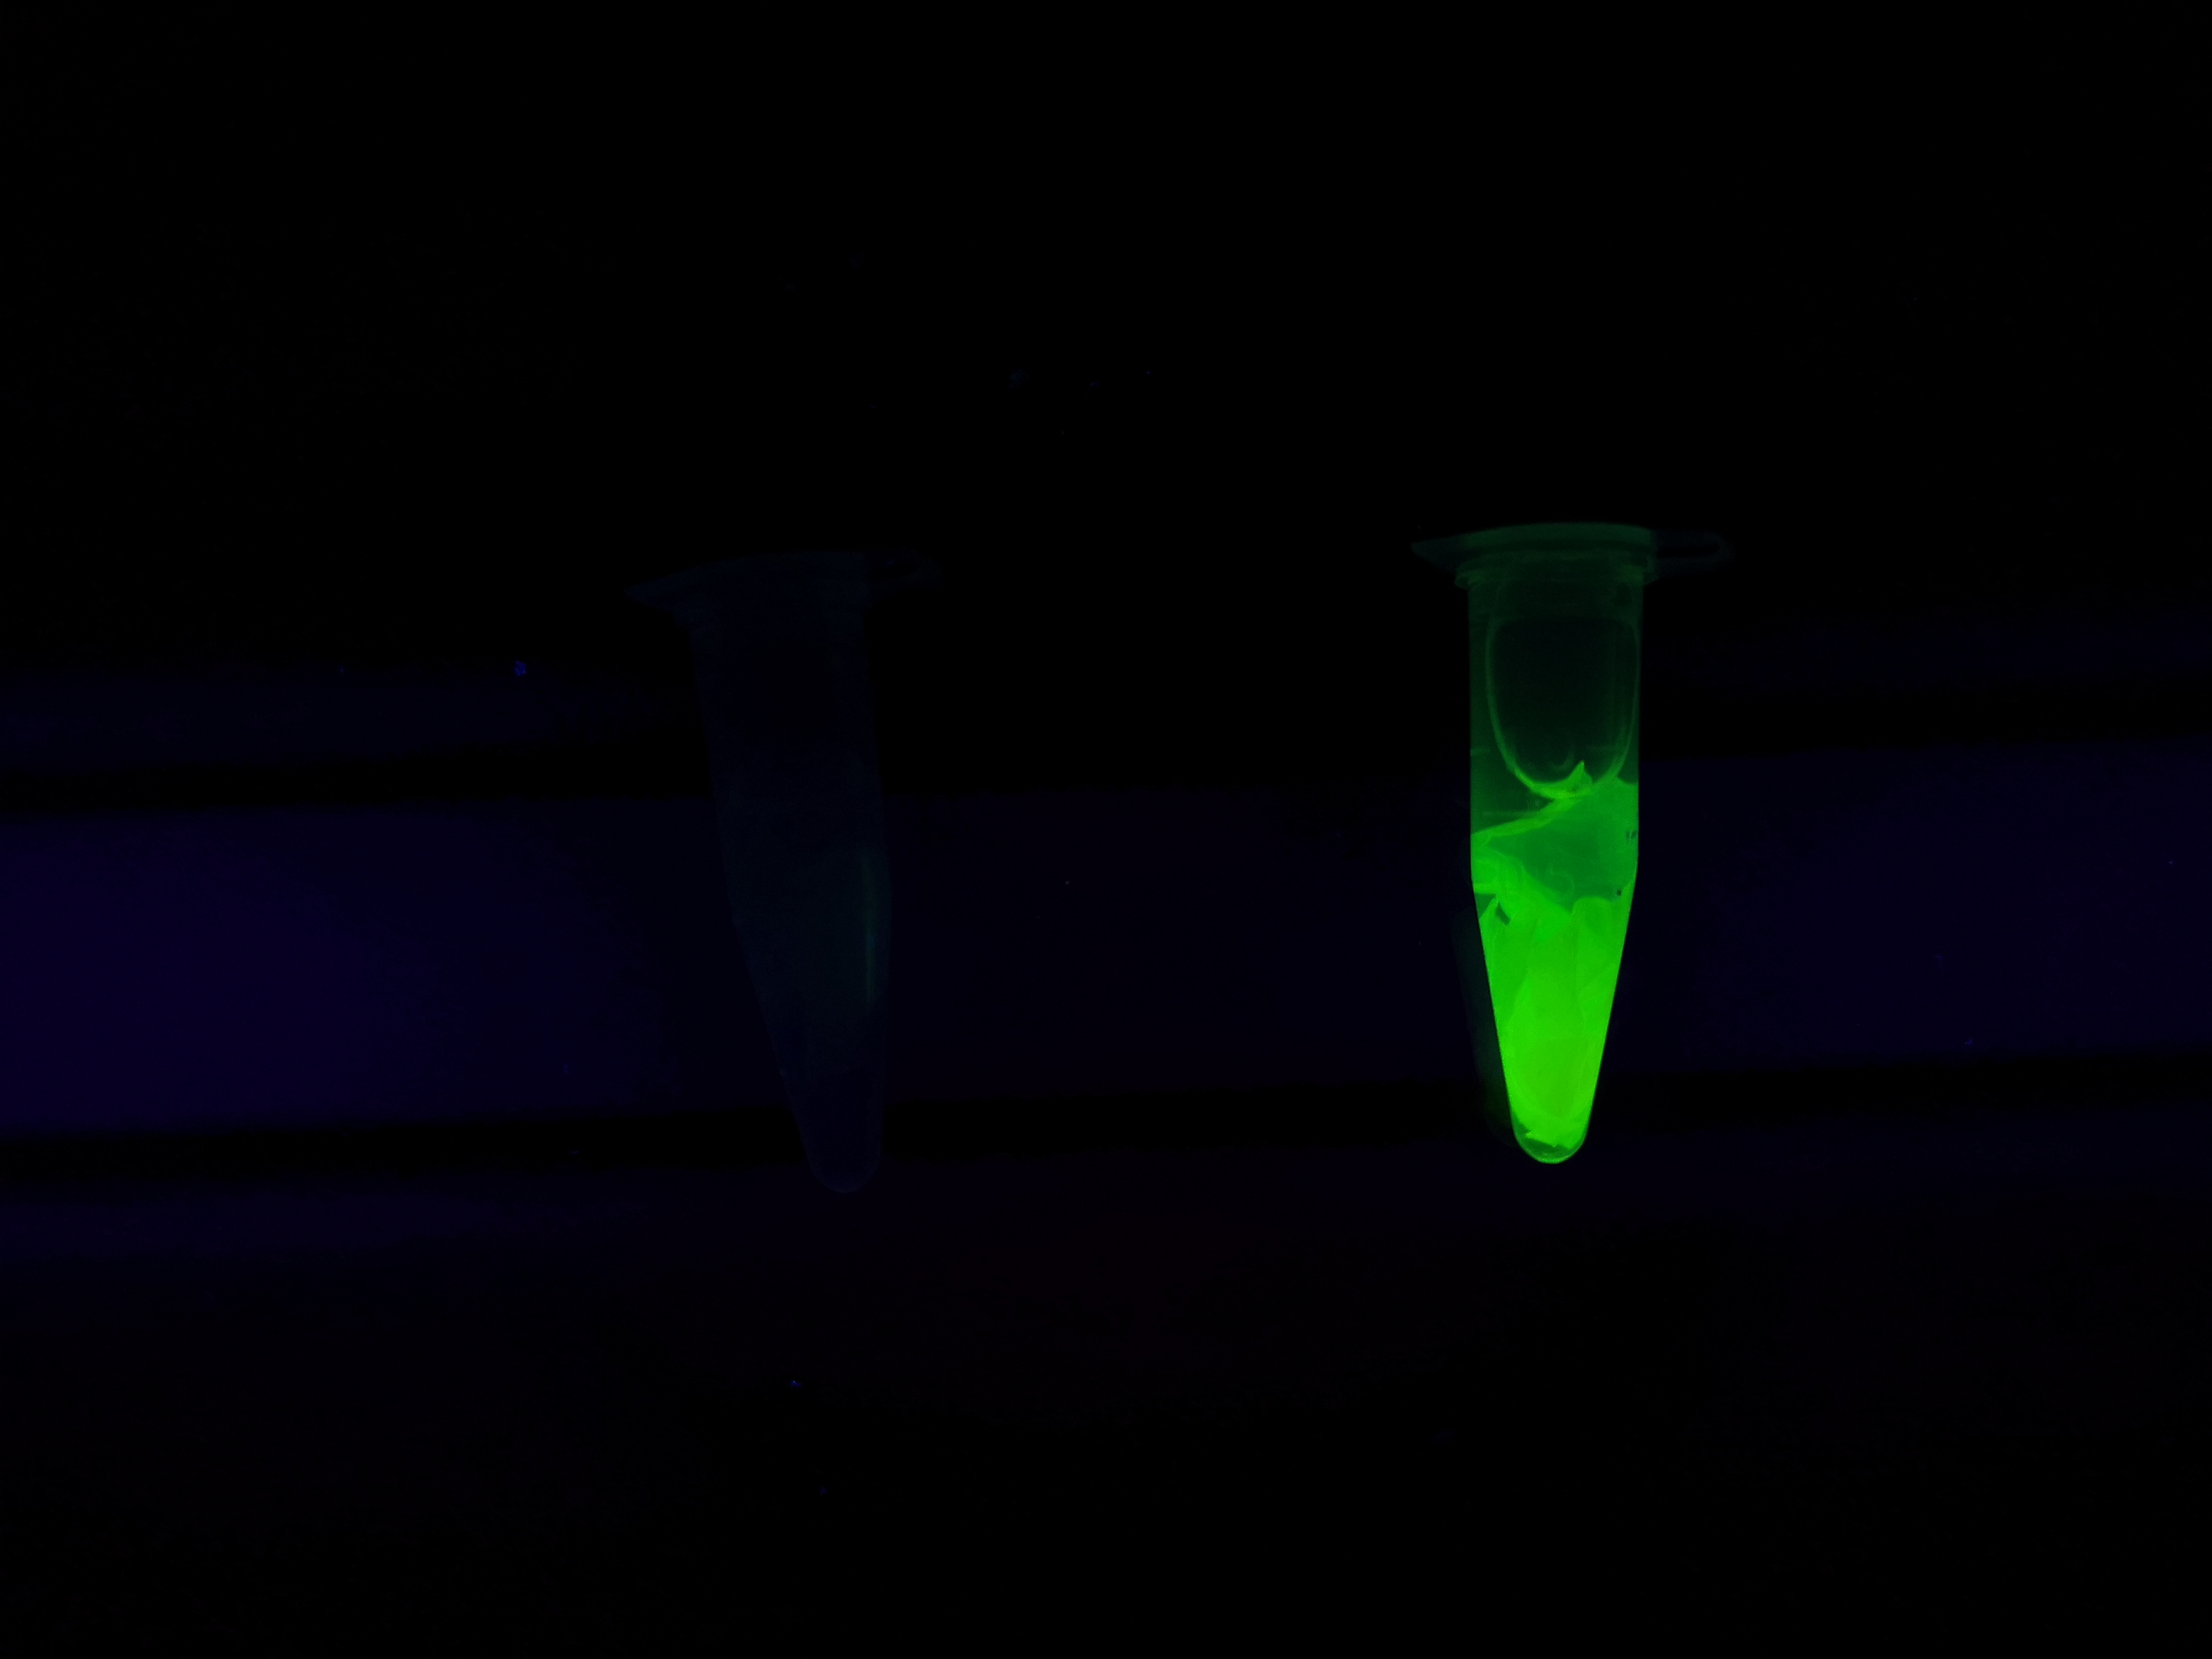
| − | To the left a visual experiment with this part can be seen. After unbound protein had been removed the cellulose was washed three times with 70 % ethanol. To test the activity, 200 uL thrombin cleavage buffer (20 mM Tris-HCl, 150 mM NaCl and 2.5 mM | + | To the left a visual experiment with this part can be seen. After unbound protein had been removed the cellulose was washed three times with 70 % ethanol. To test the activity, 200 uL thrombin cleavage buffer (20 mM Tris-HCl, 150 mM NaCl and 2.5 mM CaCl<sub>2</sub>) were added along side 0.03 units of human thrombin (Novagen, #69671-3) to the bacterial cellulose (Epiprotect, S2Medical). To the right in the Figure, the successful cleavage of CBD-sfGFP can be seen. The cellulose is to the left of the tube where free (cleaved at the thrombin site) sfGFP can be seen. To the left, the control sample can be seen, where no sfGFP can be seen in the supernatant. The picture is taken on a 302 nm UV-table to better visualize the results. Both samples were incubated in room temperature over-night on an end-to end rotator. |
<br><br> | <br><br> | ||
The thrombin containing sample (thrombin (+)) has a clear cleavage of the linker which can be observed in the tube's supernatant whilst the negative control does not have any sfGFP in its supernatant. Not all sfGFP has been cleaved from the cellulose bandage, this is probably due to the thrombin buffer running out of needed content for the thrombin cleavage. | The thrombin containing sample (thrombin (+)) has a clear cleavage of the linker which can be observed in the tube's supernatant whilst the negative control does not have any sfGFP in its supernatant. Not all sfGFP has been cleaved from the cellulose bandage, this is probably due to the thrombin buffer running out of needed content for the thrombin cleavage. | ||
<br><br><br><br><br> | <br><br><br><br><br> | ||
| − | [[File:T--Linkoping_Sweden--GFPSDS.png|420px|thumb|left|<b>Figure 13.</b> SDS-PAGE analysis of CBD-sfGFP and thrombin cleavage product. The gel to the left is a 4–20% Mini-PROTEAN® TGX™ by BioRad and the ladder is a PageRuler™ Prestained Protein Ladder. The gel was run at 200 V for 30 minutes. Lane 1 contains the ladder, lane 2 bacterial lysate with CBD-sfGFP, lane 3-6 | + | [[File:T--Linkoping_Sweden--GFPSDS.png|420px|thumb|left|<b>Figure 13.</b> SDS-PAGE analysis of CBD-sfGFP and thrombin cleavage product. The gel to the left is a 4–20% Mini-PROTEAN® TGX™ by BioRad and the ladder is a PageRuler™ Prestained Protein Ladder. The gel was run at 200 V for 30 minutes. Lane 1 contains the ladder, lane 2 bacterial lysate with CBD-sfGFP, lane 3-6 contain four washes with 70 % ethanol, lane 7-10 contain four elution fractions with deionized water. Lane 11 contains sfGFP (from cleaving with thrombin).]] |
<h3>SDS-PAGE analysis of cleavage and expression</h3> | <h3>SDS-PAGE analysis of cleavage and expression</h3> | ||
| − | E. coli BL21 (DE3) Gold cells were grown in presence of 25 ug/mL chlorampenicol until an | + | <i>E. coli</i> BL21 (DE3) Gold cells were grown in presence of 25 ug/mL chlorampenicol until an OD<sub>600</sub> of 0.8 at 37 °C, and later induced with 0.5 mM IPTG. The induced culture was then incubated in 18 °C for 16 hours. The bacteria was then lysed with sonication at 30 % for 6 minutes. Most of this part could be found in the soluble fraction. The lysate (1 mL) was then incubated with cellulose (CF11) for 30 minutes in room temperature. Four washes with 70 % ethanol was then conducted all with a volume of 1 mL. Elution of CBD<sub>cipA</sub>-sfGFP was done with 1 mL fractions of dH<sub>2</sub>O. One replicate was instead cleaved with thrombin instead. Thrombin cleavage buffer (20 mM Tris-HCl, 150 mM NaCl and 2.5 mM CaCl<sub>2</sub>)) was added to the Eppendorf tube with the cellulose at a volume of 500 uL, and 0.03 units was then added to the solution. The cleavage was done in room temperature over 16 hours, with inversion of the tube. |
<br><br> | <br><br> | ||
| − | Other bacterial proteins | + | Other bacterial proteins were washed away by ethanol which can be observed by the other fragments shown in the 3-6 lanes. All of the proteins can also be observed in the bacterial lysate in lane 2. In lanes 7-10 water (dH<sub>2</sub>O) elutions can be observed. They also contain some of the other bacterial proteins though they are very faint and the last lane is almost only CBD-sfGFP. These elutions were the same as those in Figure 9. Lane 11 contains only sfGFP which has been cleaved from the CBD construct, proving a successful cleavage of the linker. A photo of this cleavage can be seen in Figure 12. |
| + | |||
| + | [[File:T--Linkoping_Sweden--vmaxsfgfp.png|420px|thumb|left|<b>Figure 14.</b> This biobrick expressed in <i>V.natriegens</i> Vmax was incubated for 16 h in 37 °C on an LB-Miller V2 Agar plate. The control expressed the biobrick BBa_K3182100 and express no fluorescent protein. The Figure is illuminated on an UV-table in 302 nm light.]] | ||
| + | |||
| + | <h2>Utilizing <i>Vibrio natriegens</i></h2> | ||
| + | The antibiotic concentrations used were taken from [http://2018.igem.org/Team:Marburg iGEM18 Marburg]. For more information of chemical competent cells, transformation and medium please see the original article: [https://www.ncbi.nlm.nih.gov/pubmed/27571549 Gibson et al. 2016]. | ||
| + | |||
| + | In order to see if sfGFP worked in <i>Vibrio natriegens</i> using the strain Vmax, pUC19-CBD-sfGFP <partinfo>BBa_K3182108</partinfo> and pUC19-CBD-pCons-AsPink <partinfo>BBa_K3182100</partinfo> was heat shocked into Vmax. Thereafter, the bacteria was spread onto LB-Miller V2 agar plates with 200 µg/ml carbenicillin and incubated in 37 °C for 16 hours. Both plates were illuminated on an UV-table at 302 nm light (Figure 14). Figure 14 shows CBD-sfGFP in Vmax, emitts a strong green fluorescence, in comparison to the control CBD-pCons-AsPink in Vmax. This indicates that pUC19-CBD-sfGFP was able to replicate and the protein could be expressed. | ||
| + | |||
| + | [[File:T--Linkoping_Sweden--VMAX.png|420px|thumb|left|<b>Figure 15.</b> CBD-sfGFP expression in different chassis. The orange line represent Vmax at 600 µg/mL carbenicillin, blue represents Vmax at 200 µg/mL carbenicillin, and green represents <i> E. coli </i> BL21 at 100 µg/mL carbenicillin. The y-axis depicts relative fluorescent units and the x-axis represents the time over 28 hours. ]] | ||
| + | |||
| + | <br> | ||
| + | <br> | ||
| + | <br> | ||
| + | <br> | ||
| + | <br> | ||
| + | <br> | ||
| + | <h2>Kinetic expression in <i>Vibrio natriegens</i></h2> | ||
| + | To measure the protein expression of this part in different bacteria and carbenicillin concentrations. <i>E. coli</i> BL21 (DE3) and <i> Vibrio natriegens </i>, using the strain Vmax, was grown in Falcon tubes to 0.5 OD<sub>600</sub>. Vmax was grown with two different carbenicillin concentrations, 200 and 600 µg/mL, while BL21 (DE3) had 100 µg/mL carbenicillin. The bacteria was induced with 1 mM IPTG and placed in a 96-well plate in 4 replicates with 200 µL per well. A spectrometry experiment was conducted and measured the fluorescence (excitation 470 nm, emission 515 nm) during 28 hours in 37 °C. The results seen in Figure 15 shows that expression in Vmax with 600 µg/mL carbenicillin gave the highest protein yield. Another important factor was the use of an optimal concentration of carbenicillin (600 µg/mL) for Vmax which retained the plasmid more efficiently than Vmax at 200 µg/mL carbenicillin. | ||
<!-- Uncomment this to enable Functional Parameter display | <!-- Uncomment this to enable Functional Parameter display | ||
Latest revision as of 16:55, 20 October 2019
Contents
Sequence and Features
- 10COMPATIBLE WITH RFC[10]
- 12COMPATIBLE WITH RFC[12]
- 21INCOMPATIBLE WITH RFC[21]Illegal BamHI site found at 580
- 23COMPATIBLE WITH RFC[23]
- 25COMPATIBLE WITH RFC[25]
- 1000INCOMPATIBLE WITH RFC[1000]Illegal SapI.rc site found at 598
Introduction
pT7-CBDcipA-sfGFP

This part consists of a carbohydrate binding domain (CBD) from Clostridium thermocellum (C. thermocellum) cellulose scaffolding protein (CipA). This binding domain is a central part of Clostridium thermocellum's cellusome and has a strong affinity for cellulose. The CBD was fused to another protein using a flexible GS-linker (-GGGGSGGGGS-) in order to attach this complex to a polysaccaride material. A thrombin cleavage site (-LVPRGS-) was added to the end of the linker and its breakage will leave a glycine and serine attached to the N-terminal of the fusion protein. The main mechanism of iGEM19 Linköping's project can be seen in Figure 1.
Protease site and use
The thrombin site was added to enable the ability to release the fusion protein down into skin wounds. Thanks to our integrated human practice we learned that infections span much deeper into wounds that we thought. Simply attaching the CBD-fusion protein to a carbohydrate material would not enable the fusion protein to reach far into the wound. The thrombin site was also chosen because of thrombin's endogenous existence in humans.
Assembly compabilities
An internal BamHI recognition sequence (RS) has been added to enable interchangeable fusion proteins to the CBD. BamHI was chosen because its RS codes for glycine and serine, fitting it to the end of the thrombin site. It is also a cost-effective enzyme and is unaffected by methylated DNA. BamHI is a part of the RFC21 standard.
CBDcipA crystal structure
Important molecular faces
CBDcipA is composed of a nine-stranded beta sandwich with a jelly roll topology and binds a calcium ion, which can be seen in Figure 2. It further contains conserved residues exposed on the surface which map into two clear surfaces on each side of the molecule. One of the faces mainly contains planar strips of aromatic and polar residues which may be the carbohydrate binding part. Further aspects are unknown and unique to this CBD such as the other conserved residues which are contained in a groove.
Carbohydrate binding domain specificity
Since the CBD is from the cellusome of C. thermocellum some research labeled it a cellulose binding domain. However, iGEM19 Linköping noticed that this domain could also bind to different sources of polysaccaride materials. This serves as a domain for iGEM19 Linköpings modular bandage, where the polysaccaride material can be exchanged for other/similar materials and not exclusively cellulose.
The choice of carbohydrate binding domain
iGEM Linköping 2019 chose CBDcipA due to the fact that many other iGEM teams had explored the possibilities of this domain. Our basic design was influenced by [http://2014.igem.org/Team:Imperial iGEM14 Imperial], [http://2015.igem.org/Team:edinburgh iGEM15 Edinburgh] and [http://2018.igem.org/Team:ecuador iGEM18 Ecuador]. Purification and where to place the fusion protein (N- or C-terminal) was determined by studying the former projects. CBDcipA also originates from a thermophilic bacteria which further increases the domain's applications.
Expression system
The part has a strong expression with a T7-RNA-polymerase promotor (BBa_I719005), seen in Figure 3, as well as a 5'-UTR (BBa_K1758100) region which has been shown to further increase expression in Escherichia coli (E. coli) (BBa_K1758106), ([http://www.ncbi.nlm.nih.gov/pubmed/2676996 Olins et al. 1989]), ([http://www.ncbi.nlm.nih.gov/pubmed/23927491 Takahashi et al. 2013]).

Usage and Biology
Domain affinity
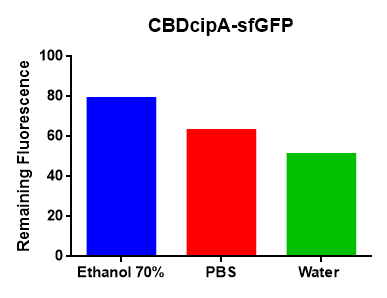
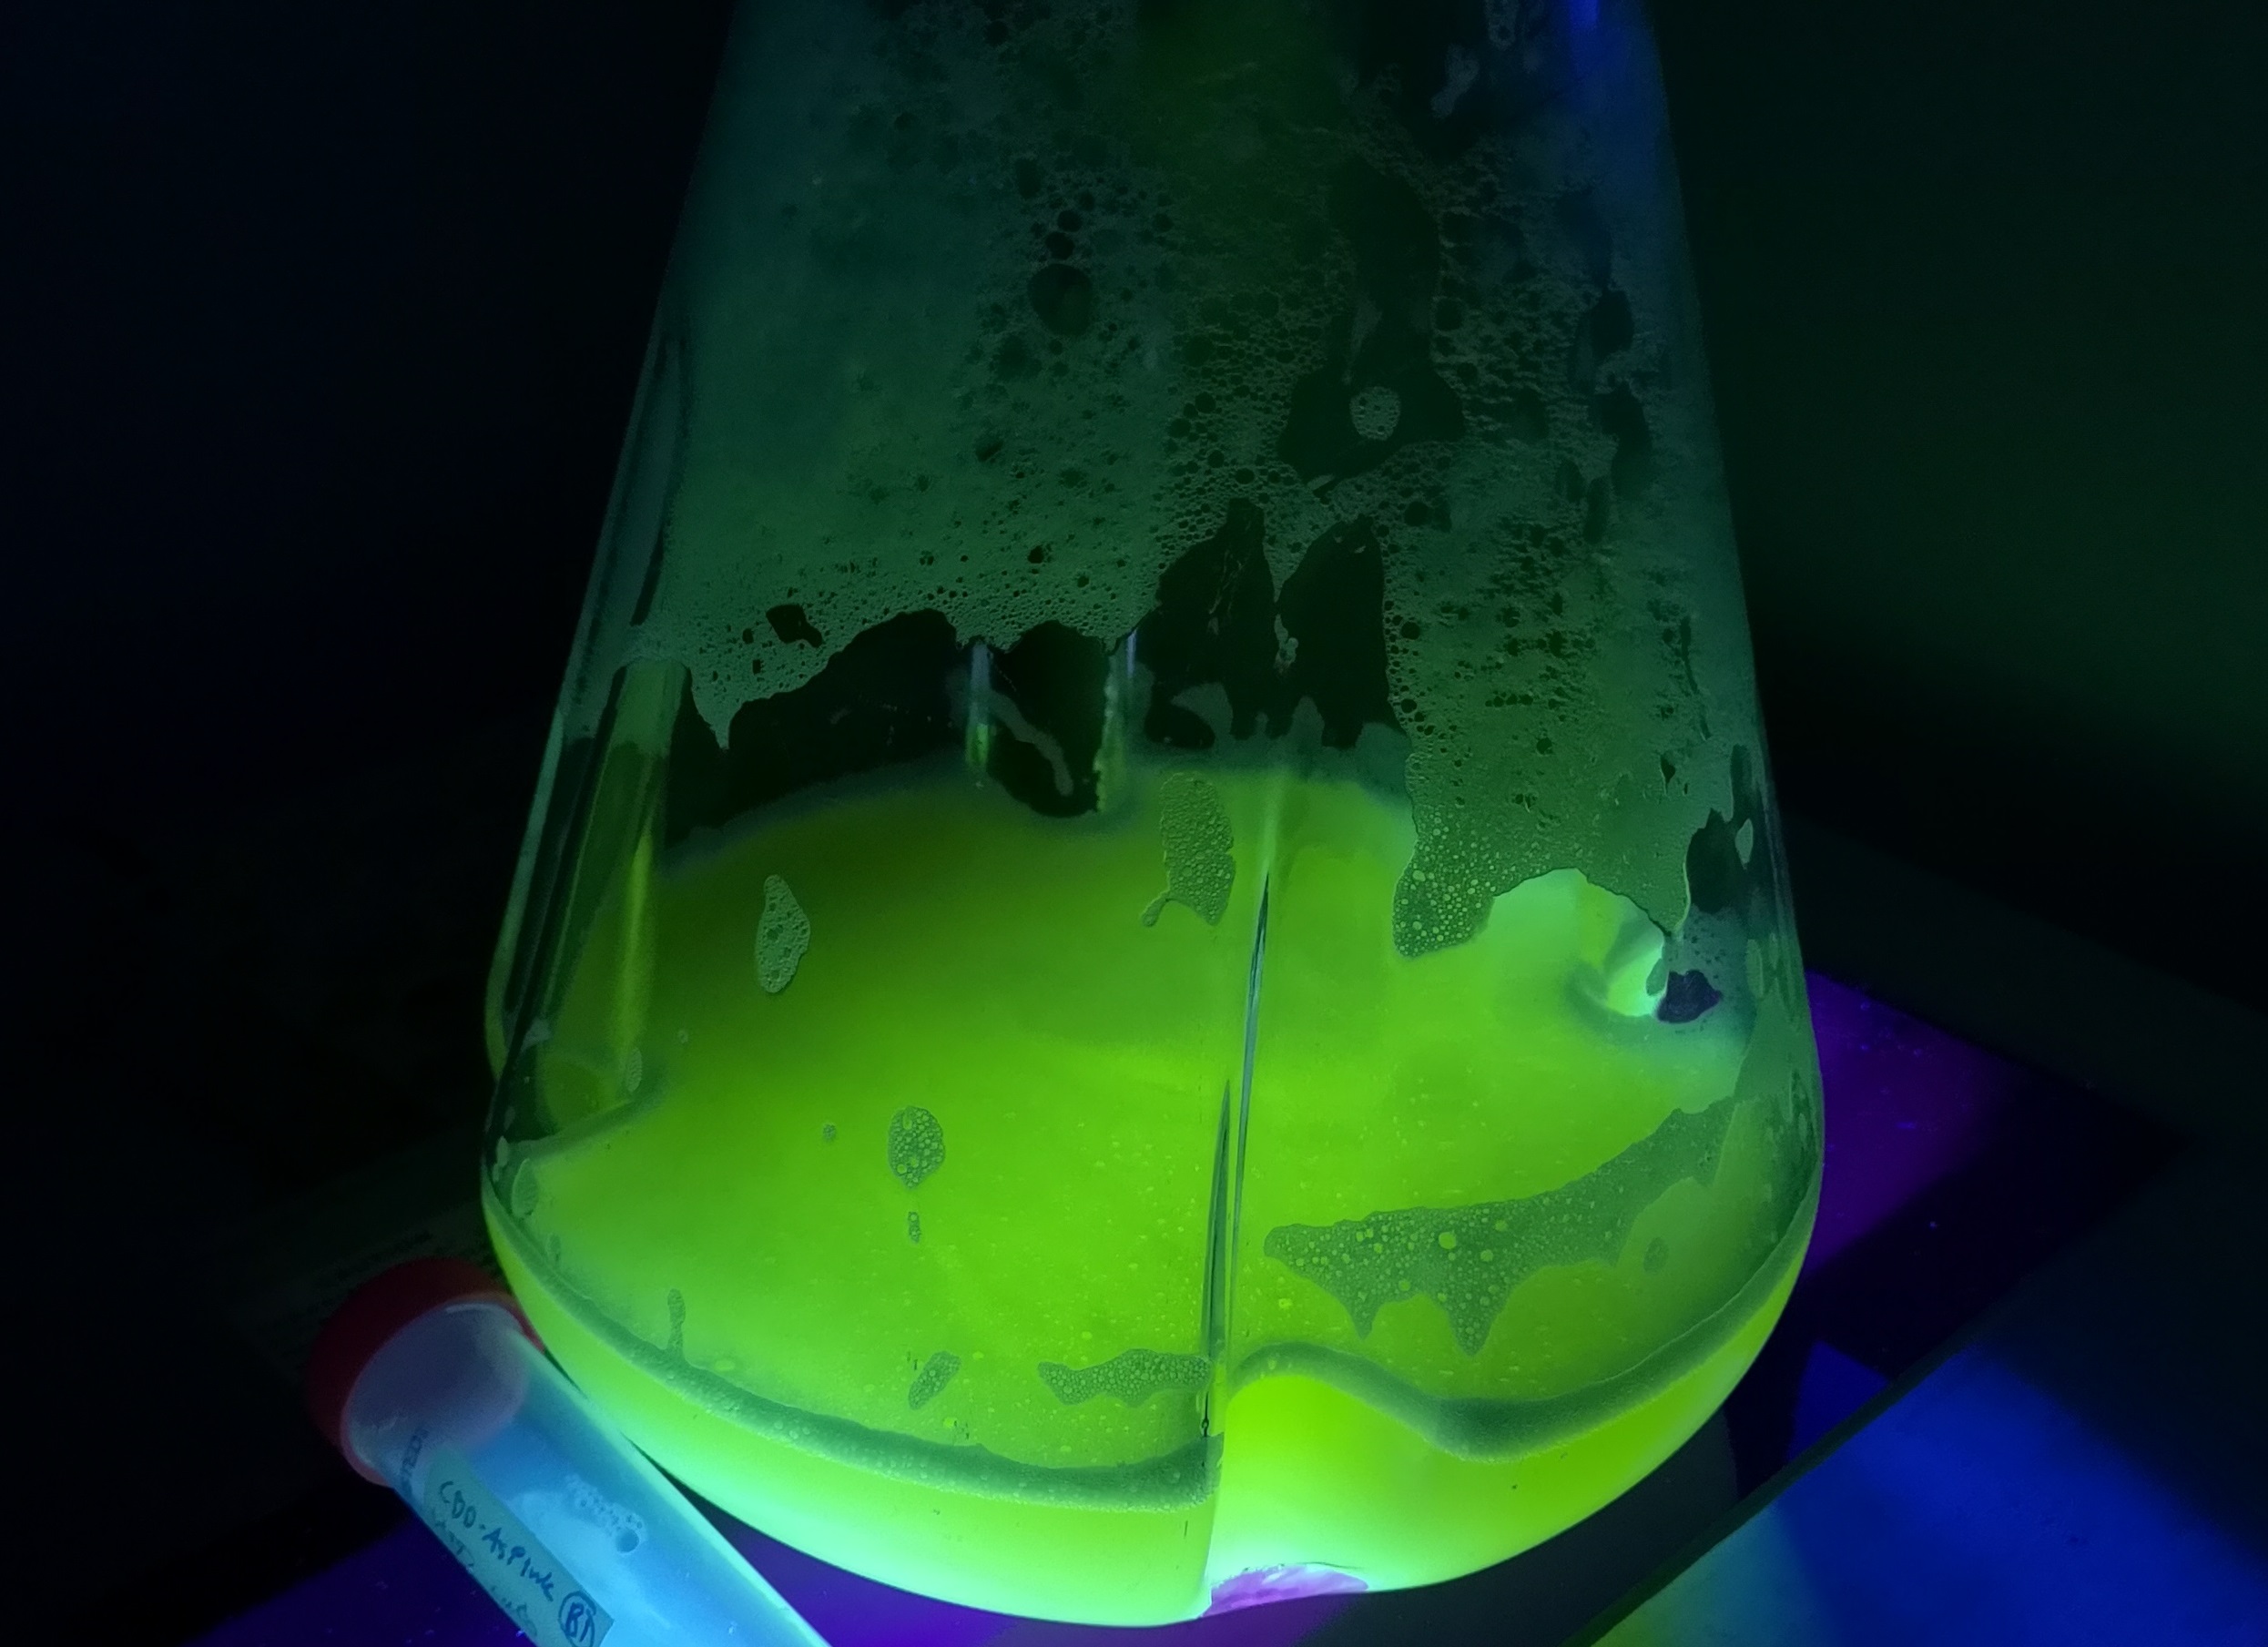
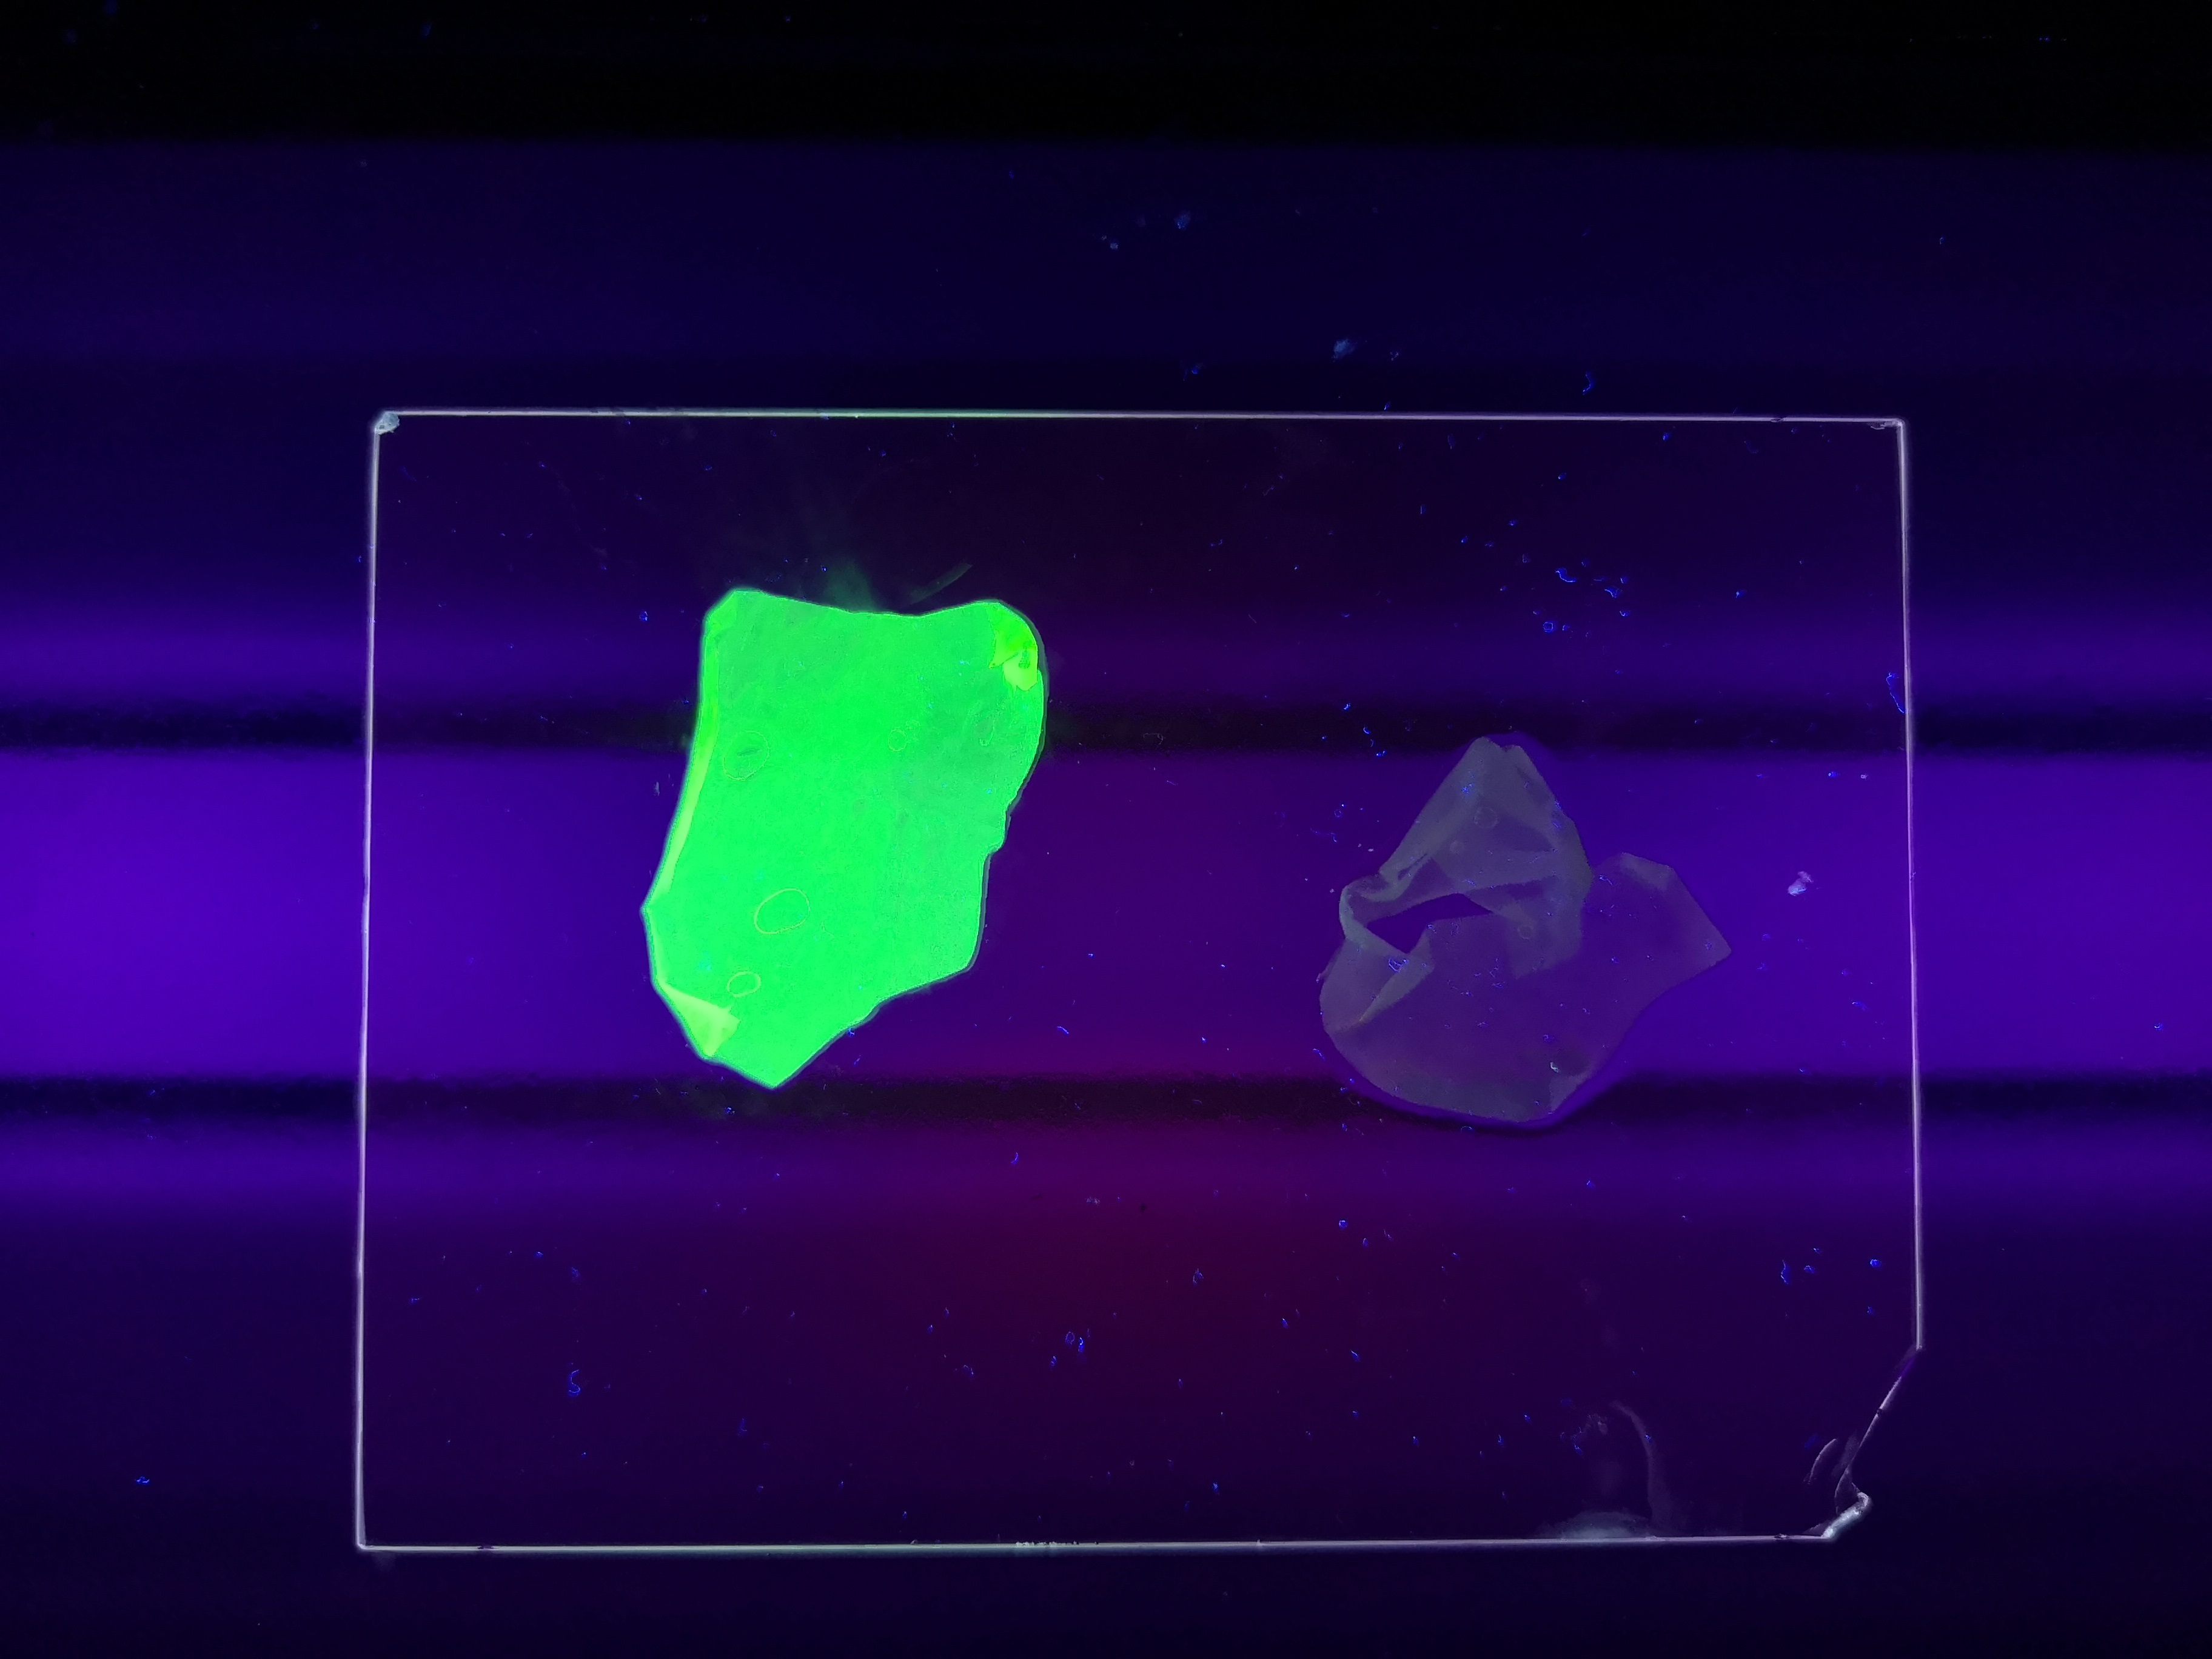 Figure 4 Picture 1: Binding studies of the CBDcipA-sfGFP bound to bacterial cellulose. Washed three times with either 70 % ethanol, PBS or deionized water. Picture 2: Induced culture after 16 hours. E. coli BL21 (DE3) cells were grown in prescence of 25 ug/mL chlorampenicol until an OD600 of 0.8 at 37 °C, and later induced with 0.5 mM IPTG. The induced culture were then incubated in 18 °C for 16 hours. Picture 3: Left: CBDcipA-sfGFP bound to bacterial cellulose (Epiprotect, S2Medical) in form of a thin film, right: bacterial cellulose (Epiprotect, S2Medical) reference. Binding of CBDcipA-sfGFP was done the same way as the pictures below.
Figure 5 Picture 1: Lysate containing CBDcipA-sfGFP with bacterial cellulose (Epiprotect, S2Medical) before incubation. Picture 2: Lysate (CBDcipA-sfGFP) bound to bacterial cellulose after incubation in room temperature for 30 minutes on an end-to-end rotator. Picture 3: Bacterial cellulose after incubation with 70 % ethanol in room temperature for 30 minutes on an end-to-end rotator. All pictures were taken on a 302 nm UV-table for better visualisation of the result.
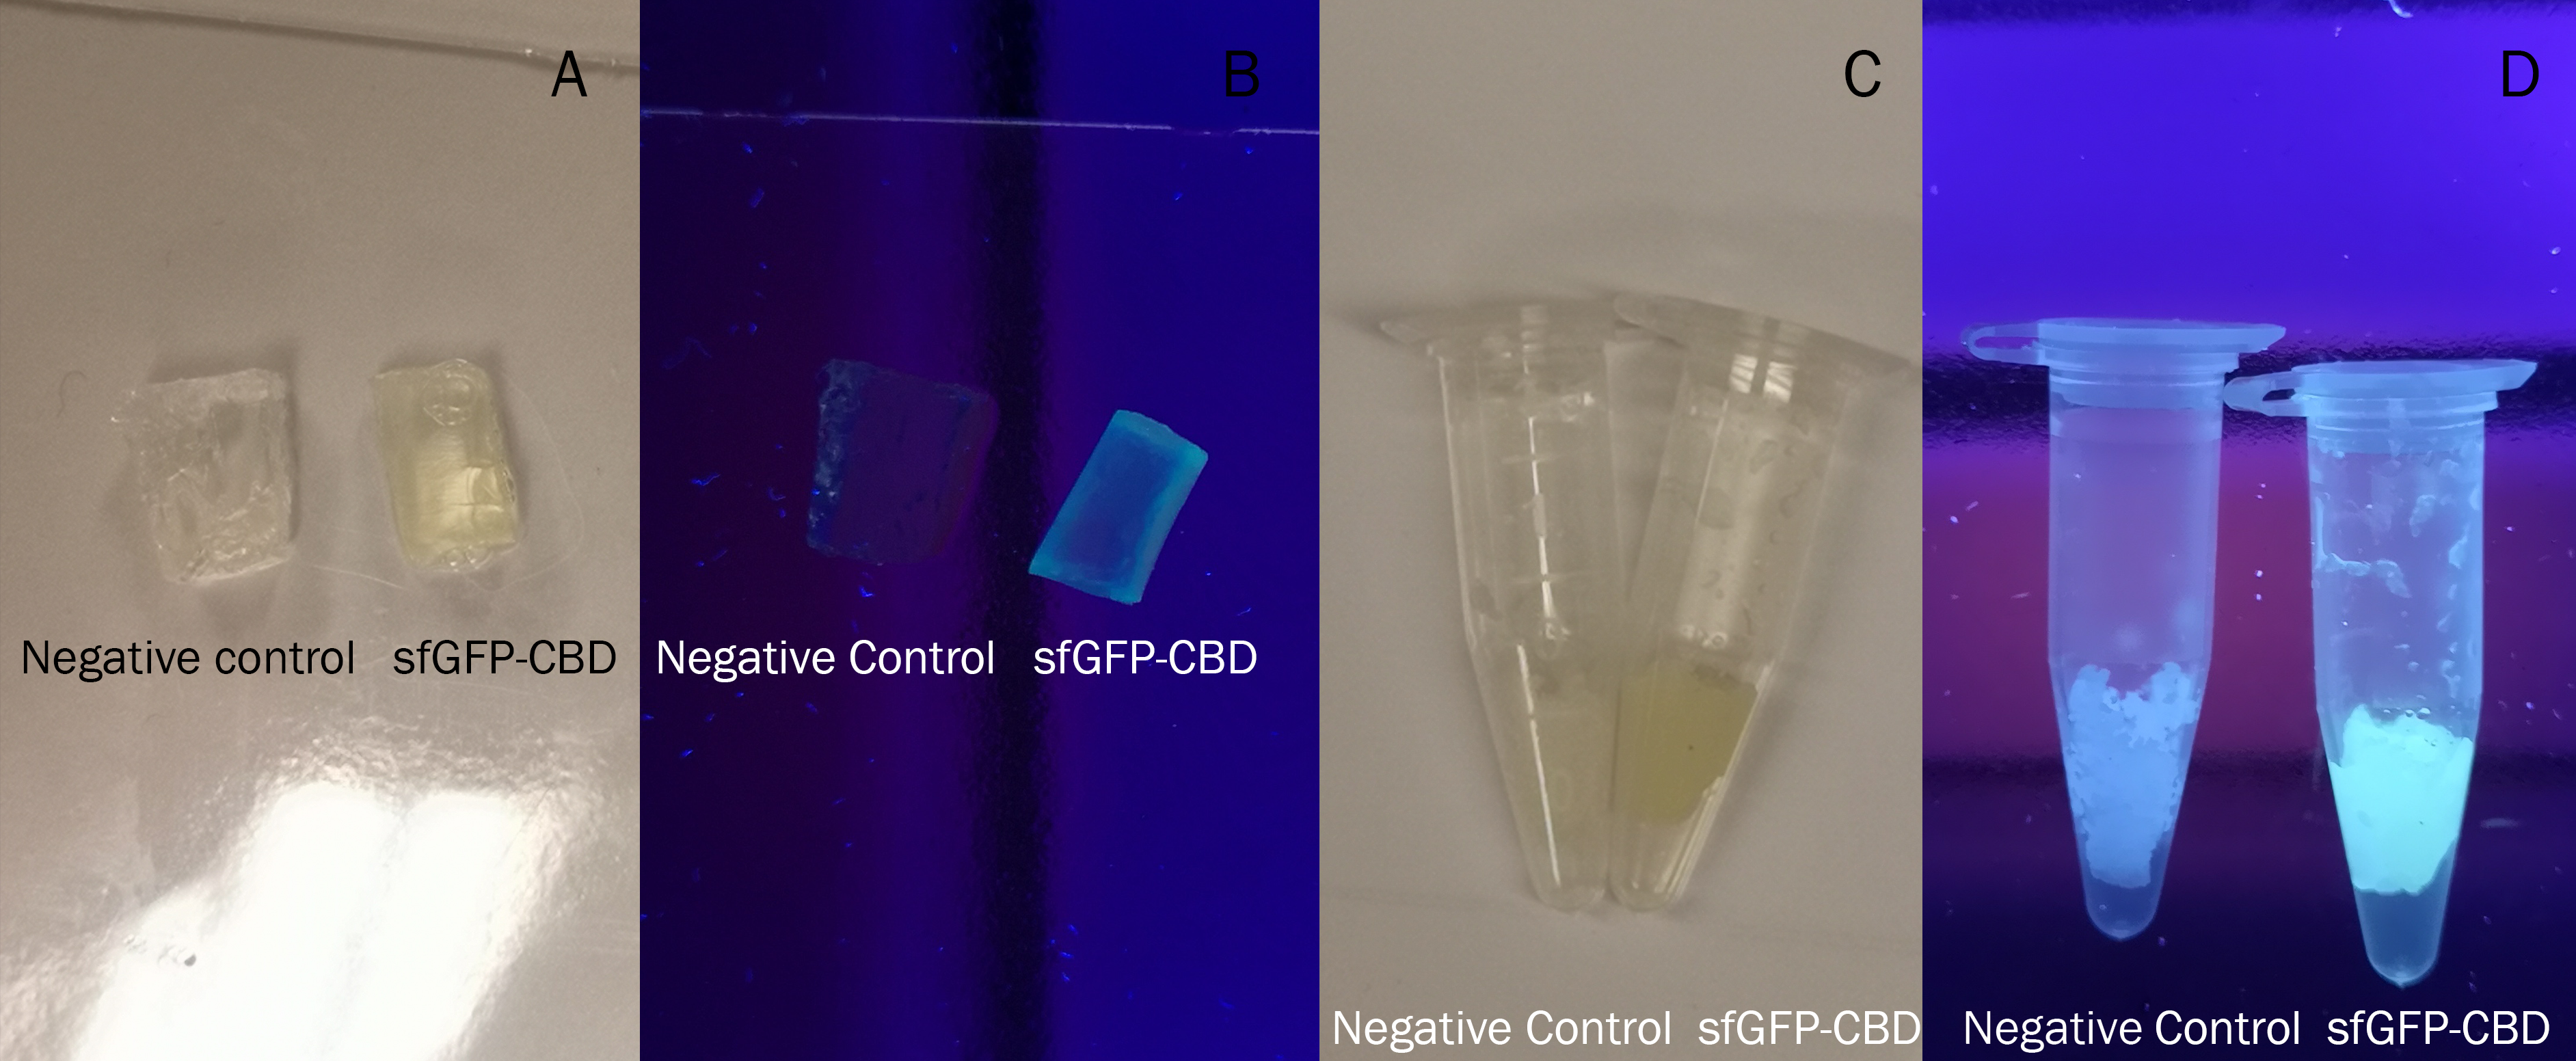
In Figure 6 the same BL21CBD-sfGFP lysate was used and the samples were incubated the same amount of time, 30 min in room temperature. Both the CBD-sfGFP bound agarose and agarose that was not incubated CBD-sfGFP was washed in 70 % ethanol once. The agarose with CBD-sfGFP bound achieved a yellow tint in comparison to the agarose with no CBD-sfGFP which was the original transparent color.
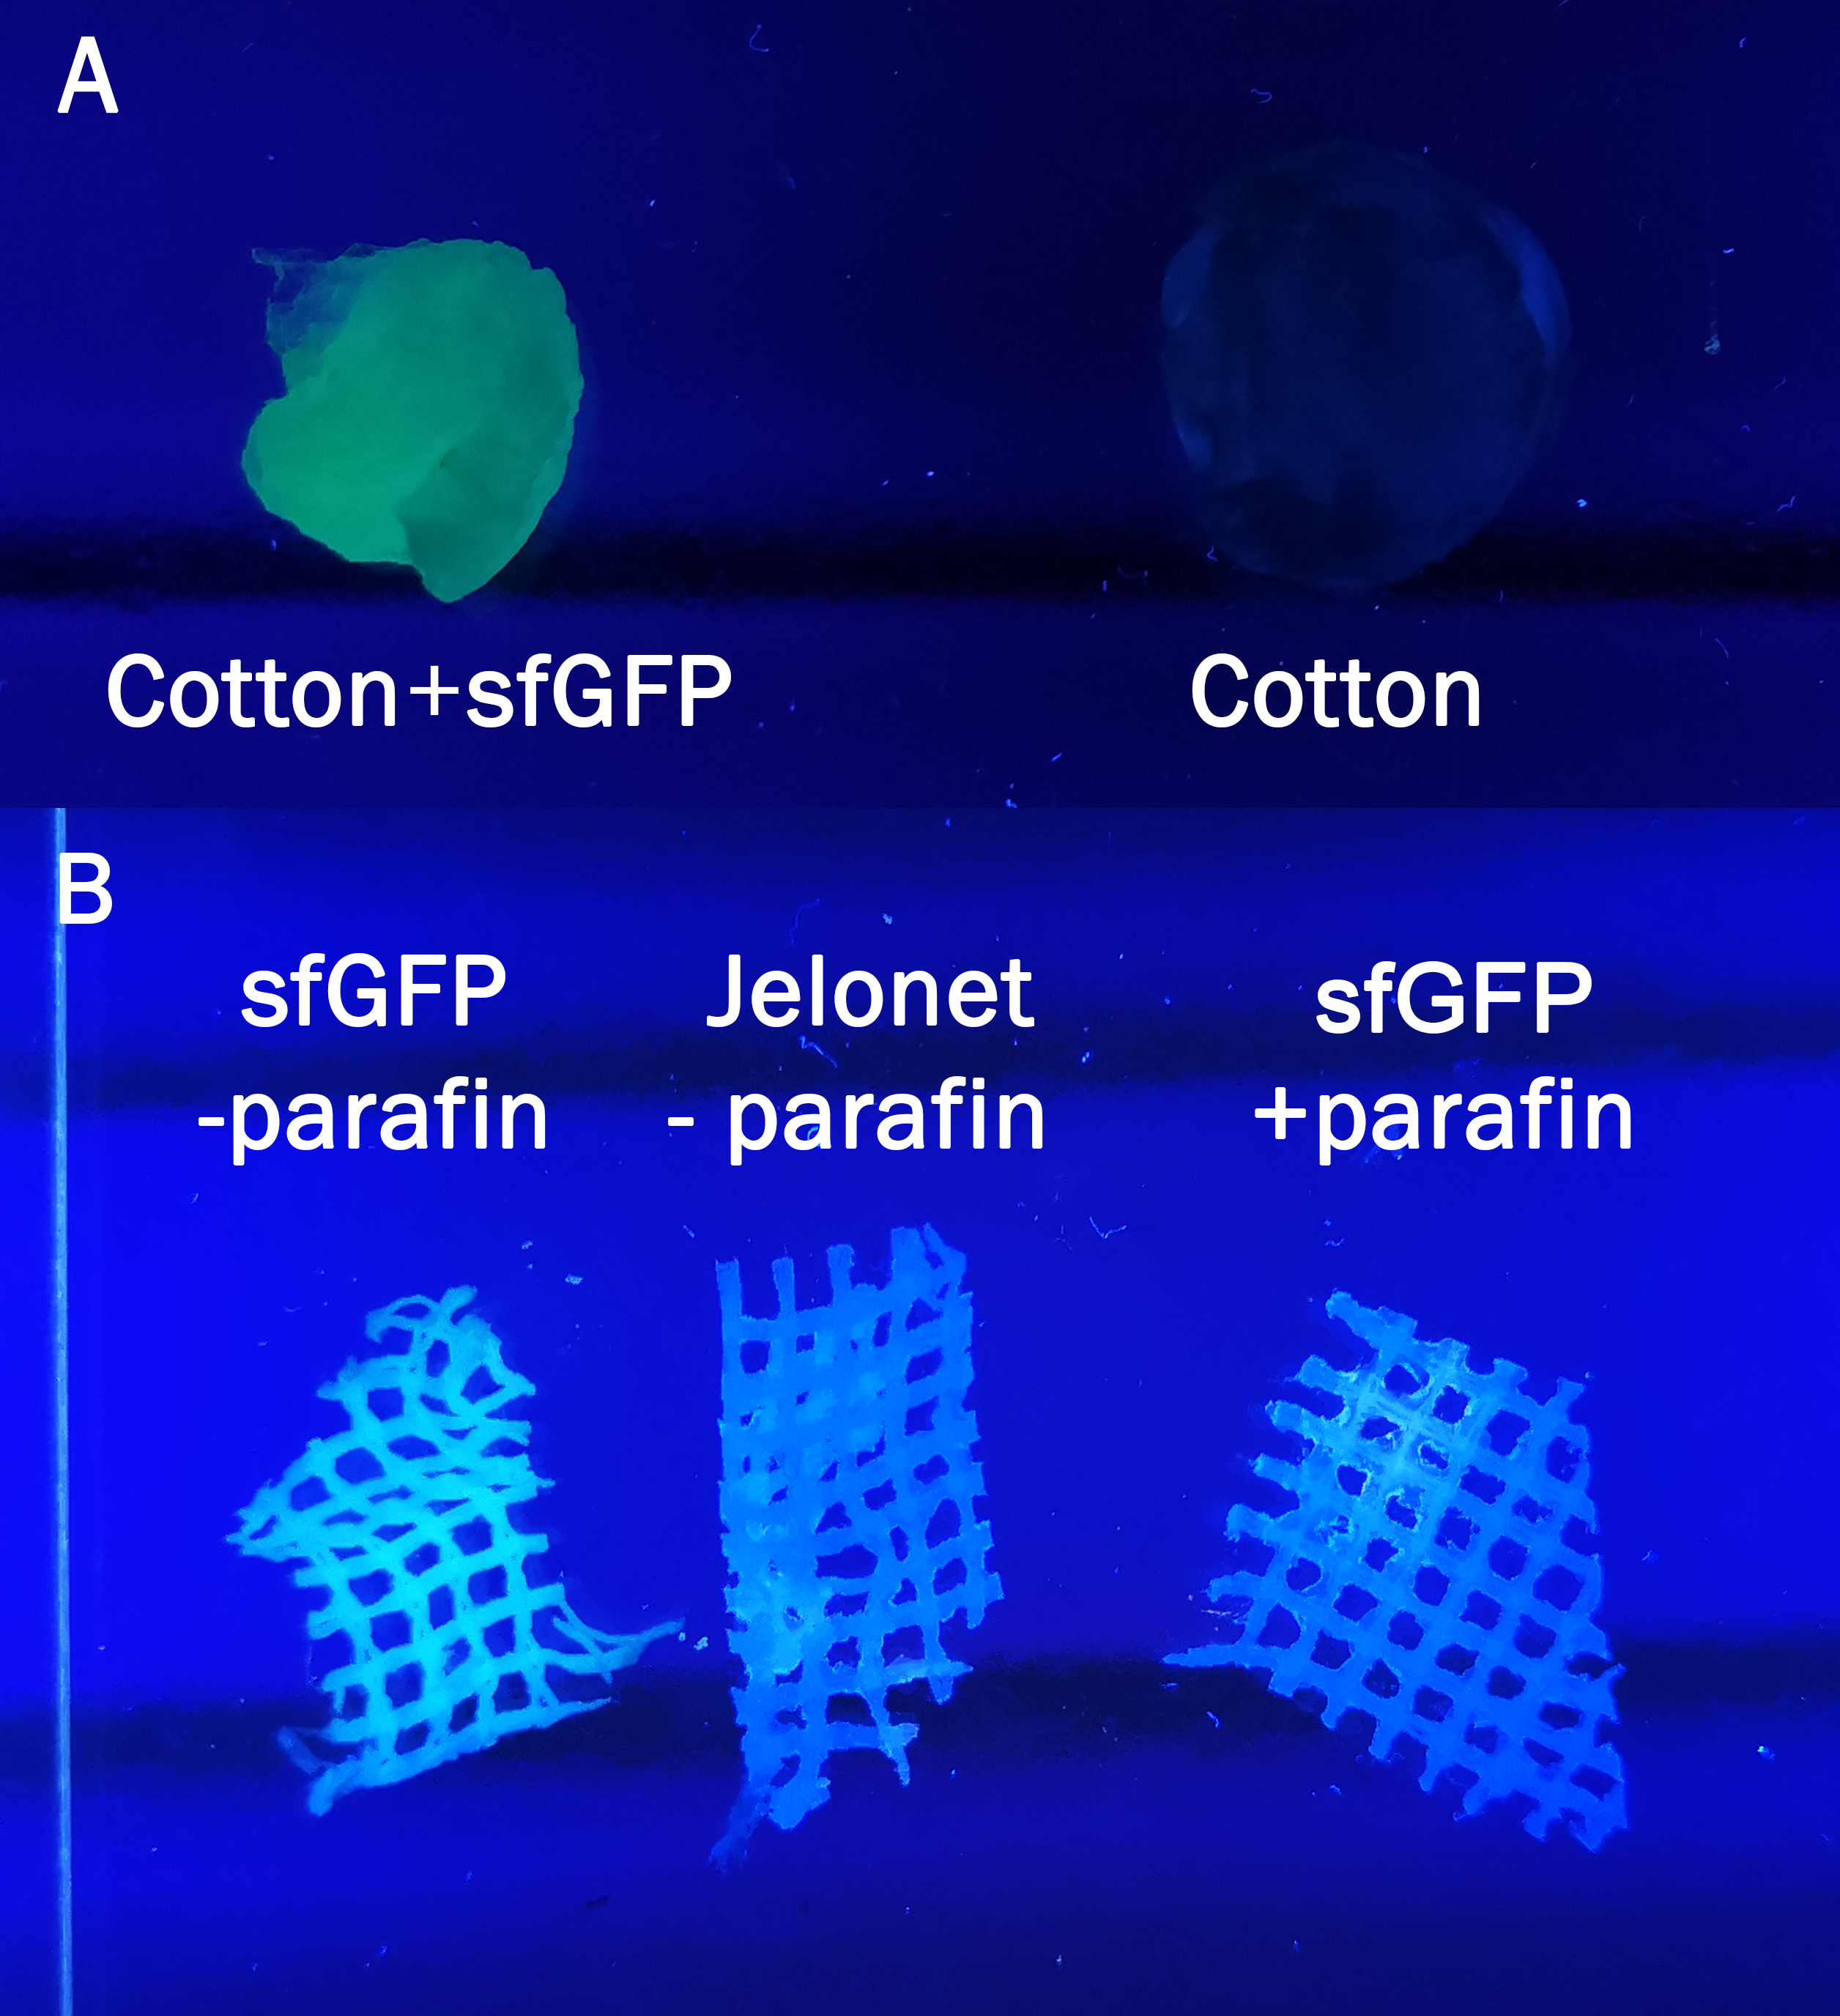
The samples in Figure 7 were incubated in the same BL21 (DE3)lysate for 30 min and then washed three times with 70 % ethanol. In A normal cotton was incubated in sfGFP whilst in B a bandage called Jelonet was used. Jelonet contains cotton threads that are covered in paraffin. We discovered that the paraffin inhibited the binding of CBD-sfGFP, therefore using detergent we removed it for the CBD-sfGFP incubation.
All of the Figures above are to illustrate the modularity of the CBD, proving that it does not only bind to cellulose such as in the first Figures, but also to other polysaccharide based materials. By binding CBD-sfGFP to Jelonet we aimed to prove that the construct can be bound to and improve already existing materials in the medical field. Jelonet is commonly used for open wounds such as burn wounds, both in order to create some antibacterial barrier and also to prevent the wounds sticking to gauze used above jelonet.
The bacterial cellulose bandage used in Figures 4 and 5 is named Epiprotect and is produced by S2Medical. Epiprotect is currently used for wounds such as burn wounds and chronic wounds. These tests were also performed to prove that the construct can be used in existing medical products. In Figures 11, 12 and 13 Epiprotect was used to observe the functionality of the thrombin cleavage mechanism of the construct.
Epifluorescent microscopy
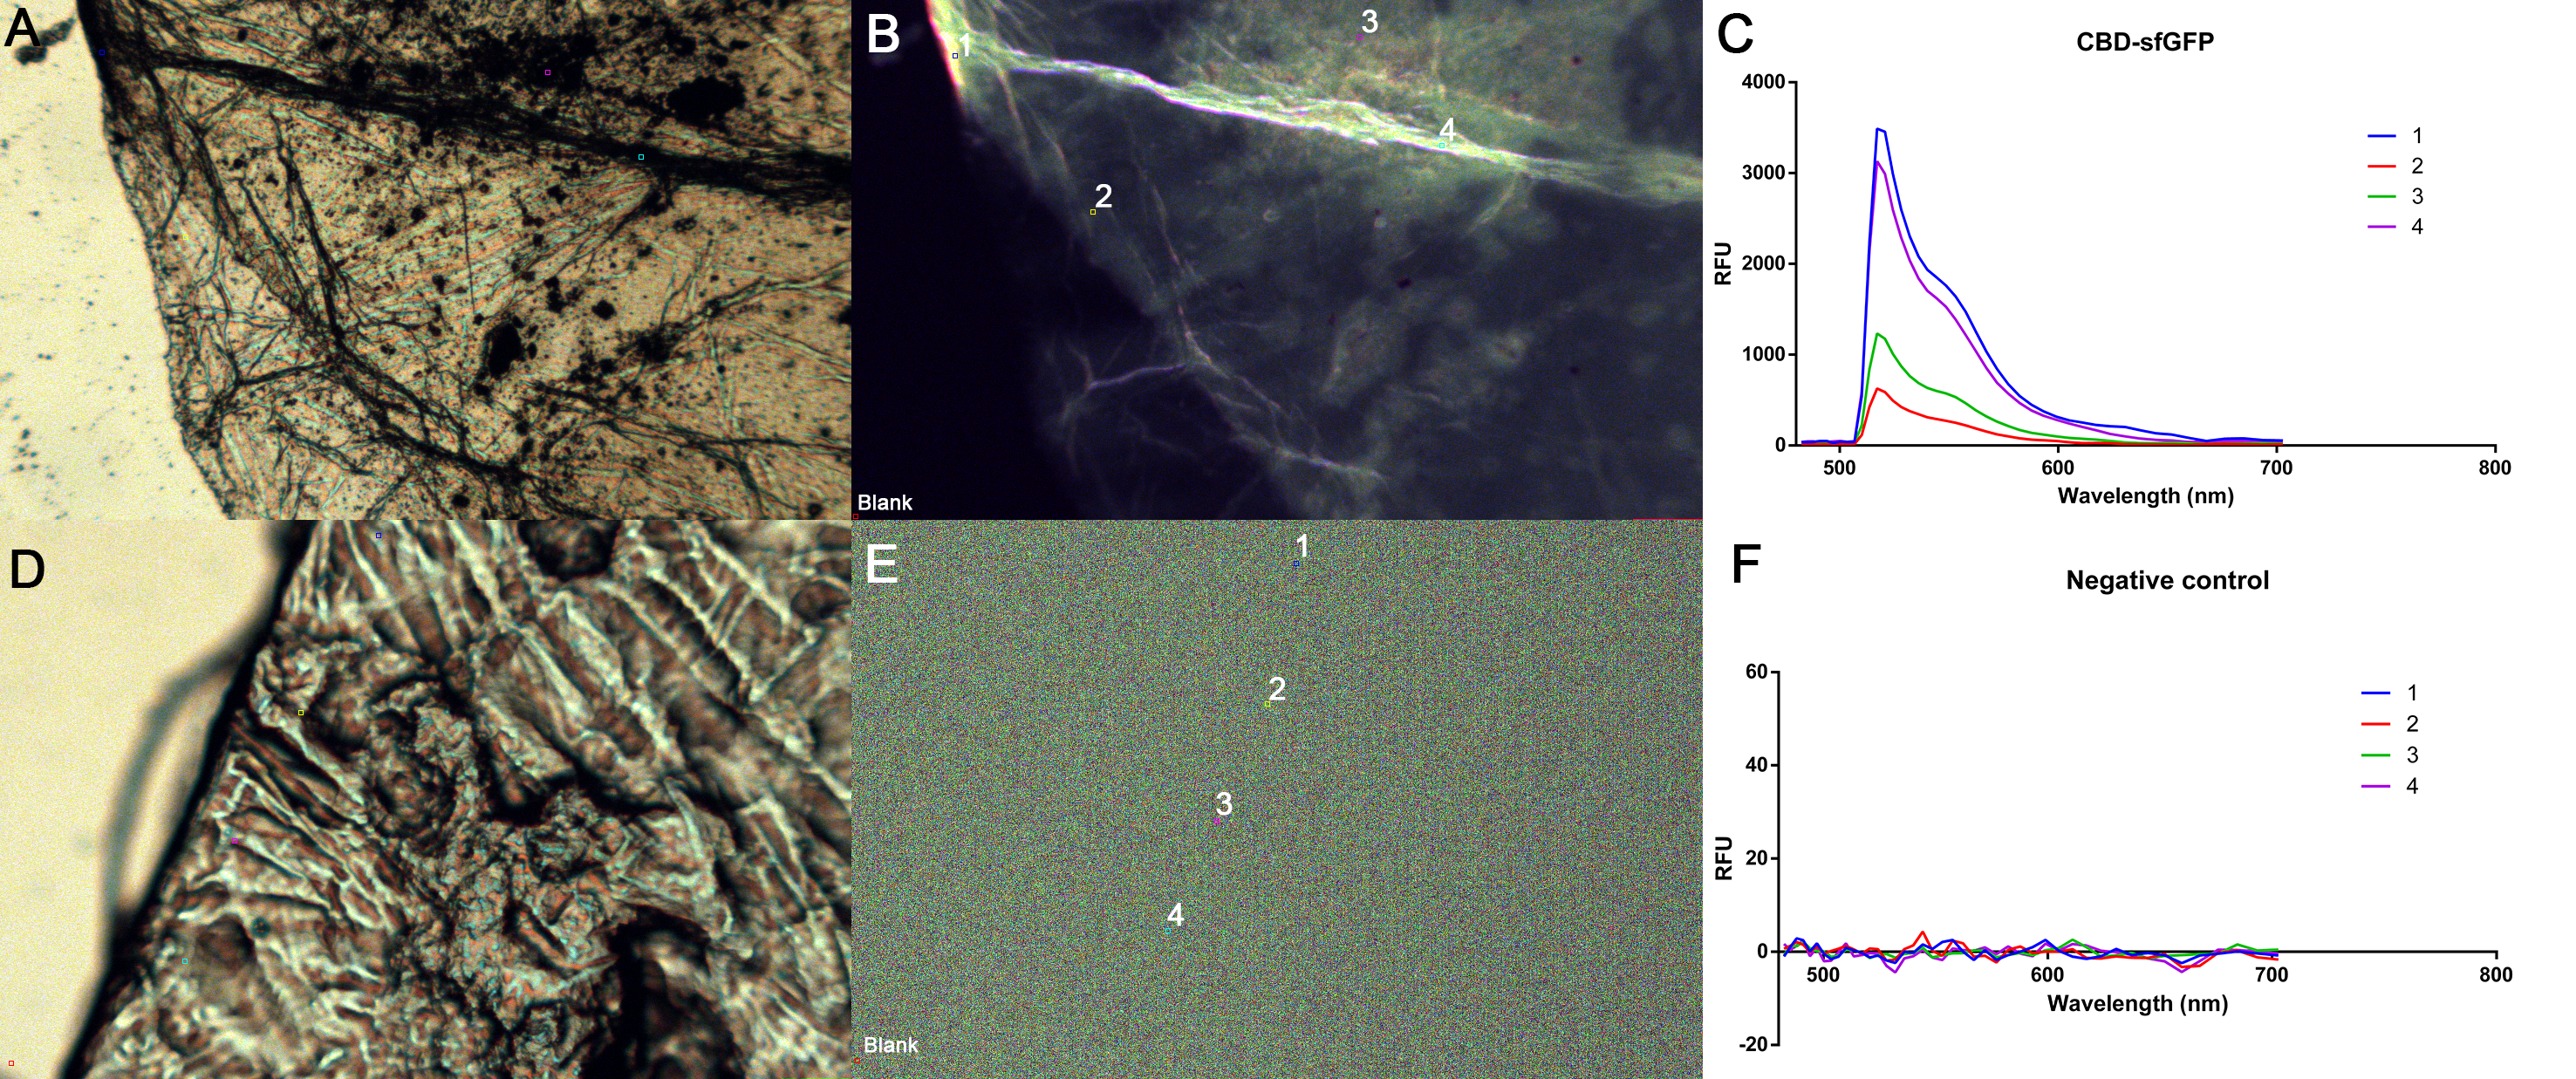
A cellulose bandage (Epiprotect, S2Medical) was incubated for 1 h at R.T in CBD-sfGFP lysate from BL21 (DE3) and afterwards washed thrice with 1 mL ethanol 70 %. The Negative control (Figure 8D-F) was washed thrice with 70 % ethanol. The bandages were mounted on a microscopy slide and photographed with a epifluorescent microscope. The relative fluorescent units (RFU) were measured in five places with one being a blank (bottom left corner, Figure 8B and E). The excitation was 485 nm and emission could be plotted in the graphs (Figure 8C and F) at approximately 510 nm. Figure 8A and D is broad spectrum photos while figure 8B and E is only the green spectrum captured.
Purification of CBD-sfGFP
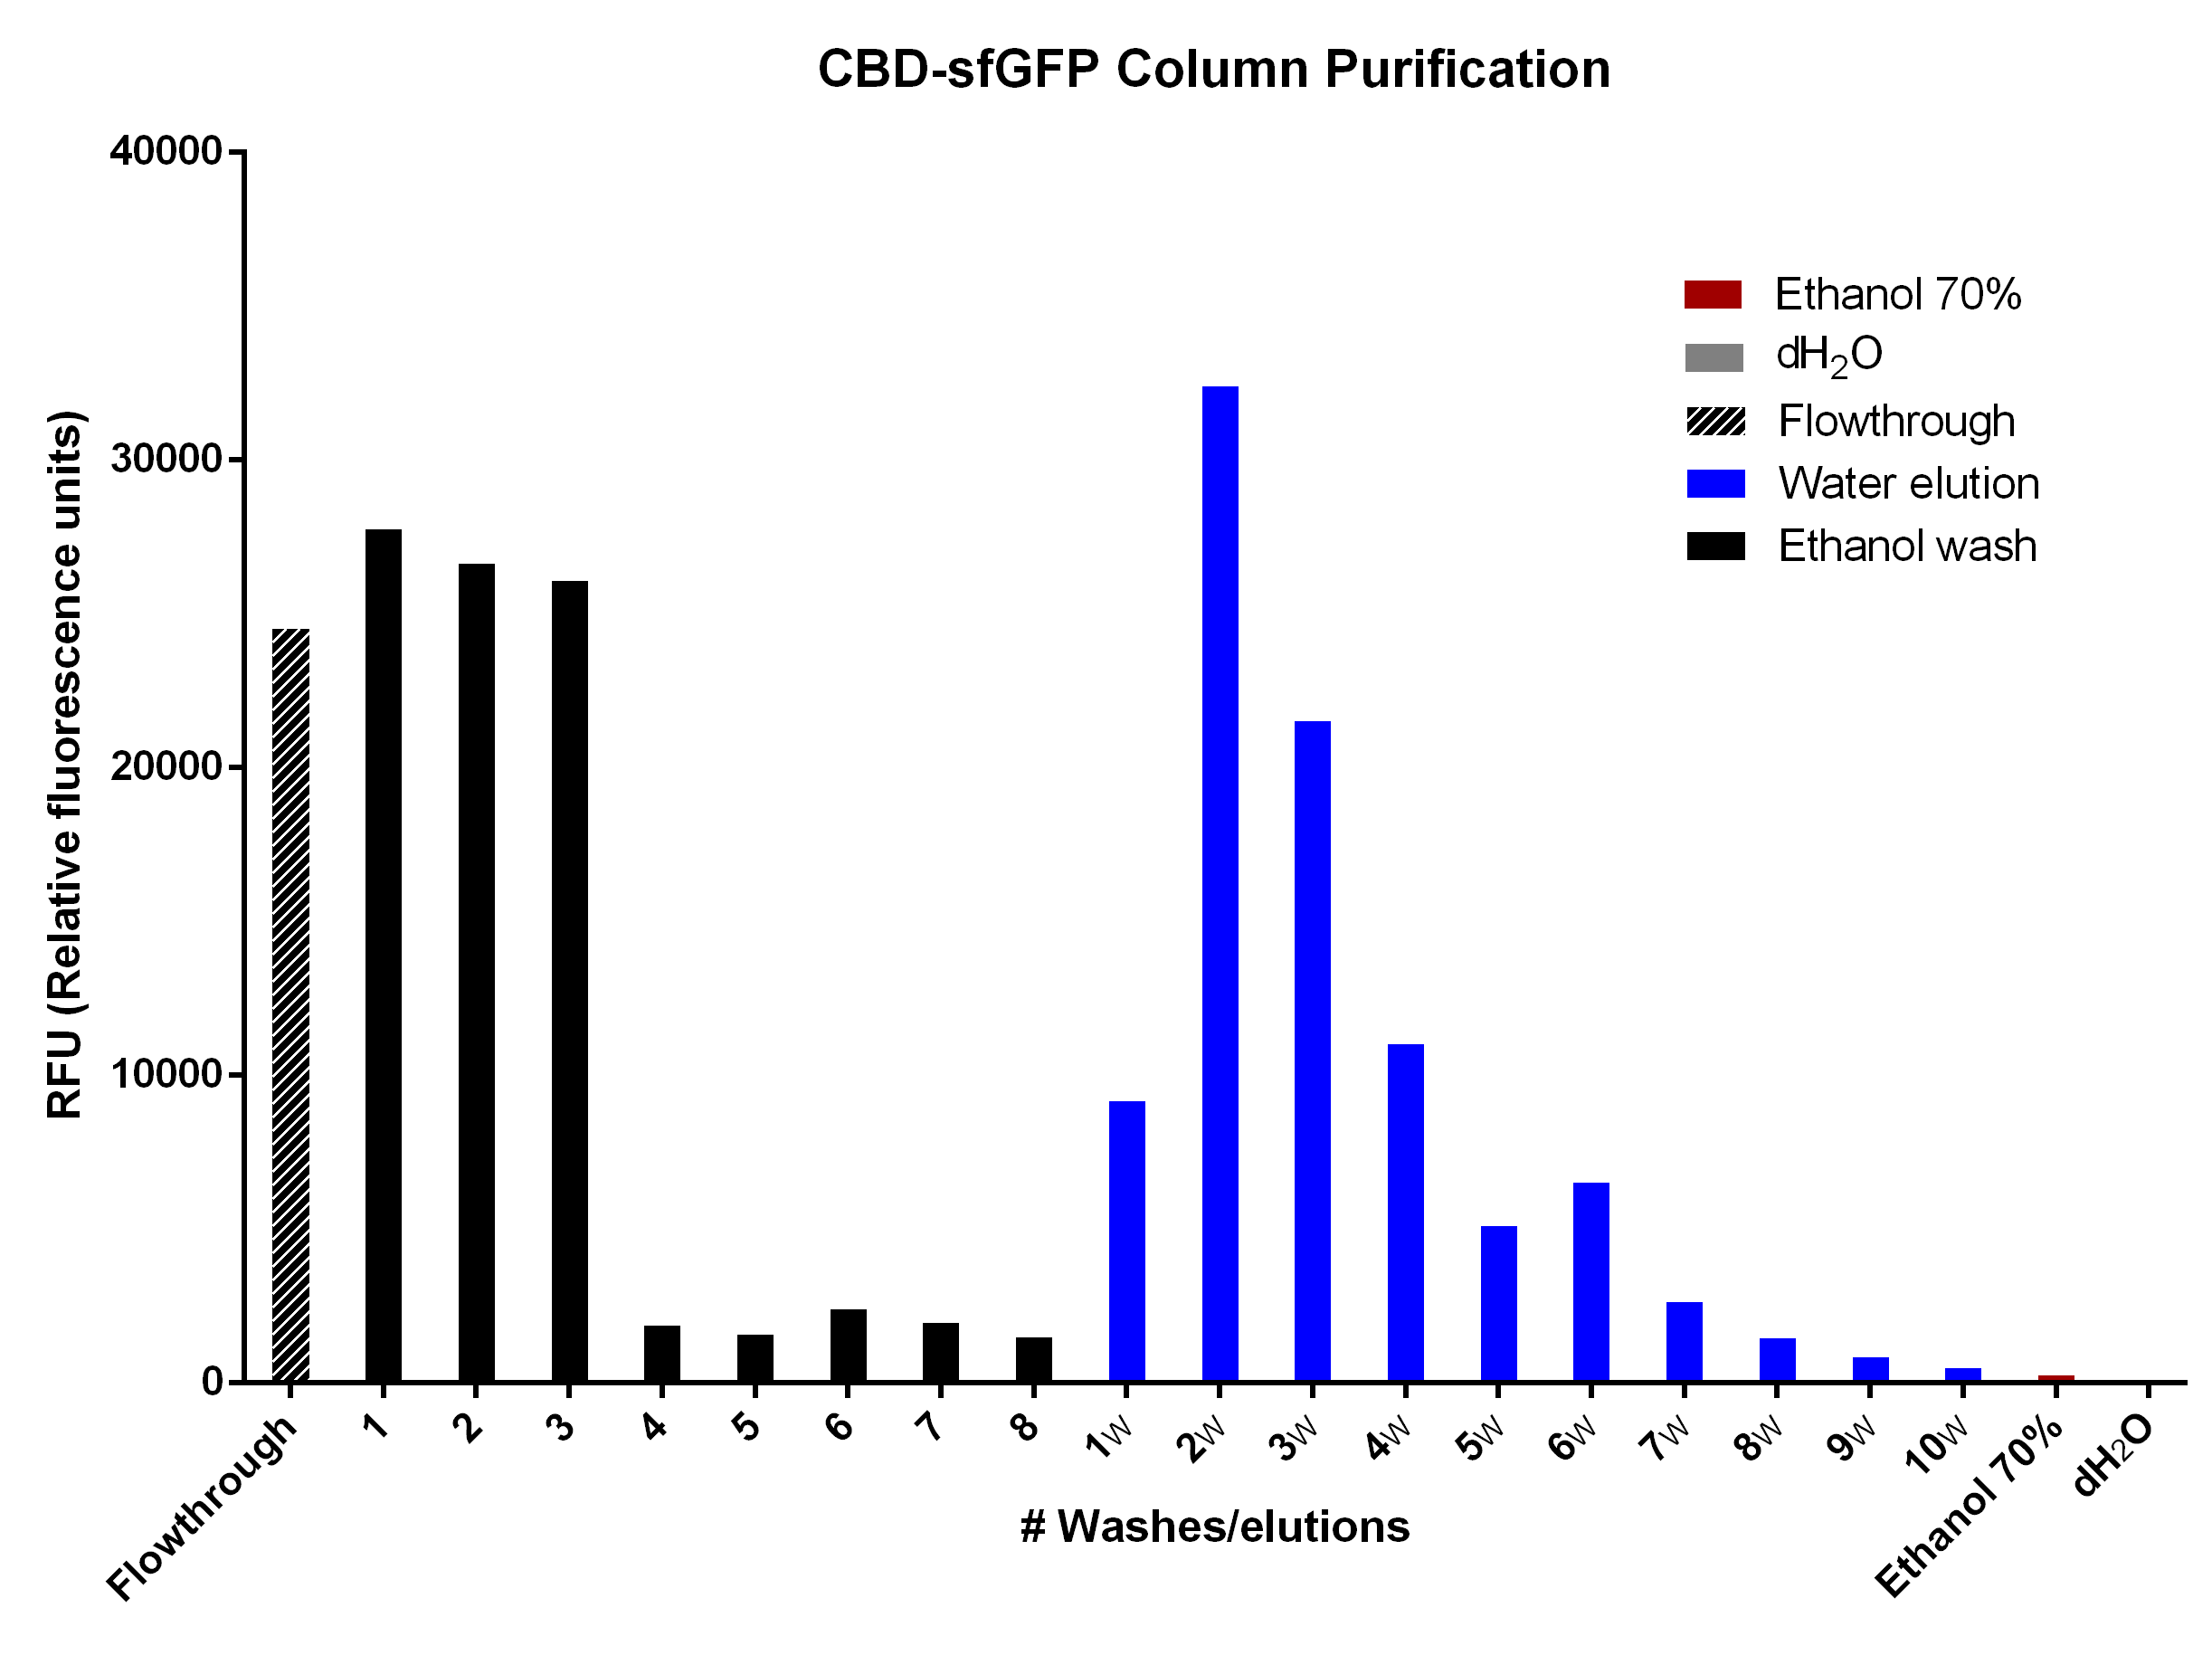
CBD-sfGFP was purified with 2 g cellulose fibers medium length (Whatman, #CF11 medium length cellulose fibres) in a column. The first striped graph is the flow through after adding BL21 (DE3) Gold lysate.
The different washes of 70 % ethanol (black bars) was to remove unspecifically bound CBD-sfGFP, leading to the bound CBD-sfGFP remaining. This can be seen in the bar graph due to the drastic drop of sfGFP elution which means that the 70 % ethanol is not useful for CBD-sfGFP elution. The water washes (dH2O, blue bars) indicate that an efficient elution of CBD-sfGFP can be performed within the first 4-6 elutions of dH2O. The last two bars (red, ethanol 70 % and grey, dH2O) indicate the endogenous fluorescent abilities of each solution. It is minimal for ethanol and none for dH2O.
The washes and elutions can be observed in an SDS-gel in Figure 13 below. In which the lanes 3-6 contain the four washes with 70 % ethanol and lanes 7-10 contain the four first elution fractions with dH2O.
Binding assay of CBD-sfGFP
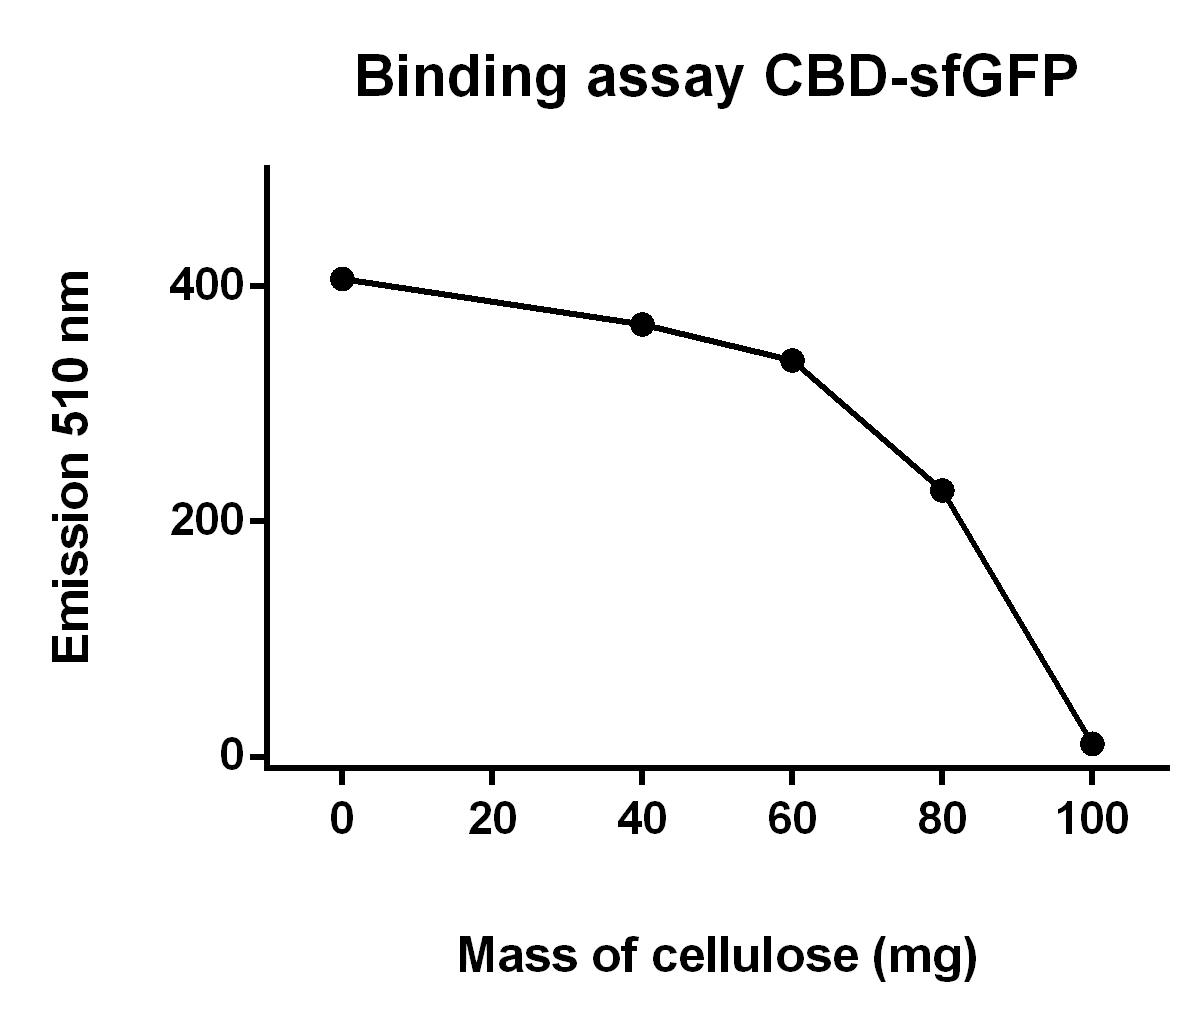
The illustration to the left (Figure 10), shows that increasing mass of cellulose CF11 fibers leads to elevated the of CBD-sfGFP.
To make the binding assay, Eppendorf tubes with varying mass of cellulose (Whatman, #CF11 medium length cellulose fibres) between 0 - 100 mg was mixed with a constant volume of CBD-sfGFP lysate (700 uL) and vortexed. The tubes were then attached to an end-to-end rotator for 30 minutes, thereafter they were placed in a tube holder until the cellulose powder settled in the bottom and the supernatant containing lysate was clear from cellulose.
After that 100 µL from each of the supernatants was applied on a plate reader which measured the fluorescence of CBD-sfGFP at 485 nm.
Reporter of successful cleavage and release from the cellulose binding domain
Spectrophotometric analysis of thrombin cleavage
In Figure 11 the release of sfGFP from the bacterial cellulose bandage (Epiprotect, S2Medical) can be seen over time. The approximate area och the cellulose was 1 cm2. The cellulose-CBD-sfGFP were attached to the side of wells of a 96-well plate using strings, allowing the spectrophotometer to measure the supernatant in the center of the well, bottom up (ex. 485 nm, em. 510 nm) for 16 hours. The well further contained 200 uL 1X thrombin cleavage buffer (20 mM Tris-HCl, 150 mM NaCl and 2.5 mM CaCl2). In the positive sample, measuring thrombin cleavage (blue), an amount of 0.03 units of human thrombin (Novagen) was added. In the graph (blue), successful release of sfGFP from the CBD can be seen. The maximun amount of fluorescence is reached after about 8 h. In red, the negative control experiment can be seen, where thrombin buffer was added containing no thrombin. No significant amount of fluorescence can be observed. The temperature was set to 37 °C. A visual representation of this can be observed below in Figure 12.
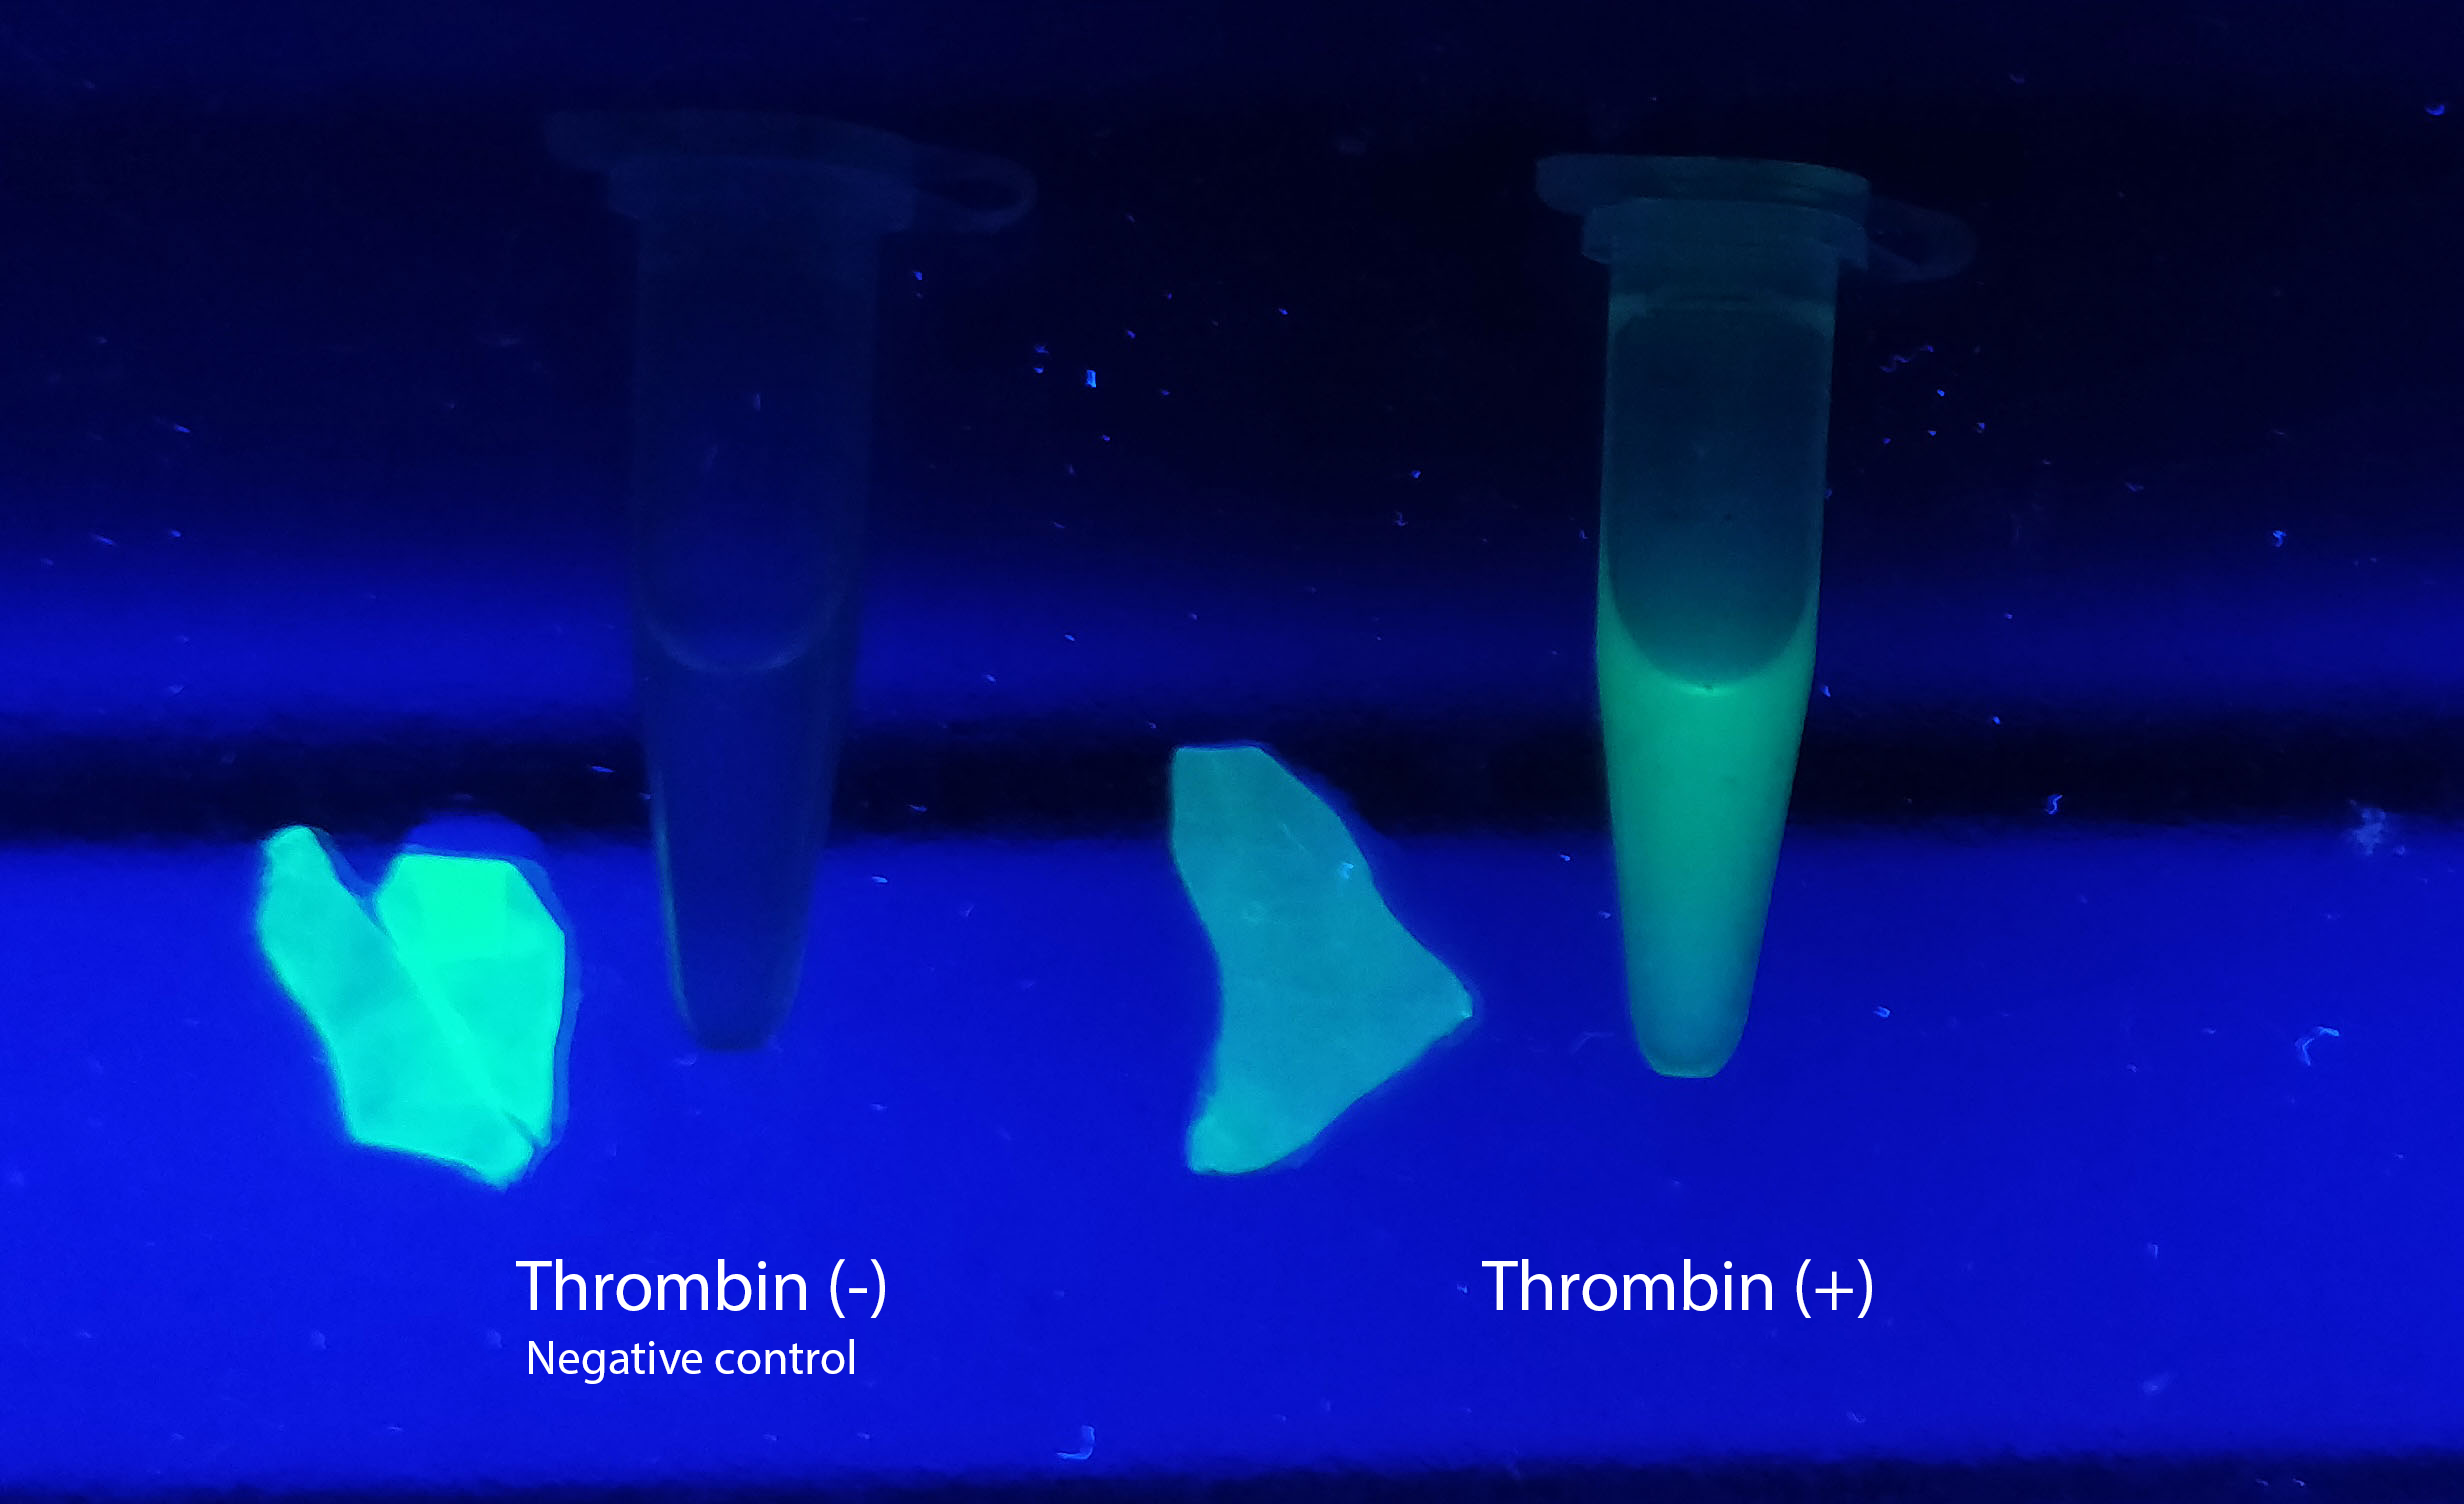
Visual experiment of thrombin cleavage
To the left a visual experiment with this part can be seen. After unbound protein had been removed the cellulose was washed three times with 70 % ethanol. To test the activity, 200 uL thrombin cleavage buffer (20 mM Tris-HCl, 150 mM NaCl and 2.5 mM CaCl2) were added along side 0.03 units of human thrombin (Novagen, #69671-3) to the bacterial cellulose (Epiprotect, S2Medical). To the right in the Figure, the successful cleavage of CBD-sfGFP can be seen. The cellulose is to the left of the tube where free (cleaved at the thrombin site) sfGFP can be seen. To the left, the control sample can be seen, where no sfGFP can be seen in the supernatant. The picture is taken on a 302 nm UV-table to better visualize the results. Both samples were incubated in room temperature over-night on an end-to end rotator.
The thrombin containing sample (thrombin (+)) has a clear cleavage of the linker which can be observed in the tube's supernatant whilst the negative control does not have any sfGFP in its supernatant. Not all sfGFP has been cleaved from the cellulose bandage, this is probably due to the thrombin buffer running out of needed content for the thrombin cleavage.
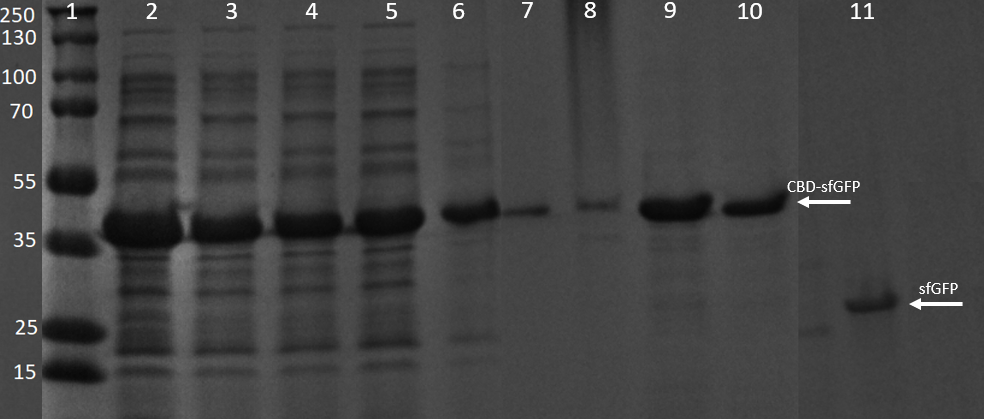
SDS-PAGE analysis of cleavage and expression
E. coli BL21 (DE3) Gold cells were grown in presence of 25 ug/mL chlorampenicol until an OD600 of 0.8 at 37 °C, and later induced with 0.5 mM IPTG. The induced culture was then incubated in 18 °C for 16 hours. The bacteria was then lysed with sonication at 30 % for 6 minutes. Most of this part could be found in the soluble fraction. The lysate (1 mL) was then incubated with cellulose (CF11) for 30 minutes in room temperature. Four washes with 70 % ethanol was then conducted all with a volume of 1 mL. Elution of CBDcipA-sfGFP was done with 1 mL fractions of dH2O. One replicate was instead cleaved with thrombin instead. Thrombin cleavage buffer (20 mM Tris-HCl, 150 mM NaCl and 2.5 mM CaCl2)) was added to the Eppendorf tube with the cellulose at a volume of 500 uL, and 0.03 units was then added to the solution. The cleavage was done in room temperature over 16 hours, with inversion of the tube.
Other bacterial proteins were washed away by ethanol which can be observed by the other fragments shown in the 3-6 lanes. All of the proteins can also be observed in the bacterial lysate in lane 2. In lanes 7-10 water (dH2O) elutions can be observed. They also contain some of the other bacterial proteins though they are very faint and the last lane is almost only CBD-sfGFP. These elutions were the same as those in Figure 9. Lane 11 contains only sfGFP which has been cleaved from the CBD construct, proving a successful cleavage of the linker. A photo of this cleavage can be seen in Figure 12.
Utilizing Vibrio natriegens
The antibiotic concentrations used were taken from [http://2018.igem.org/Team:Marburg iGEM18 Marburg]. For more information of chemical competent cells, transformation and medium please see the original article: Gibson et al. 2016.
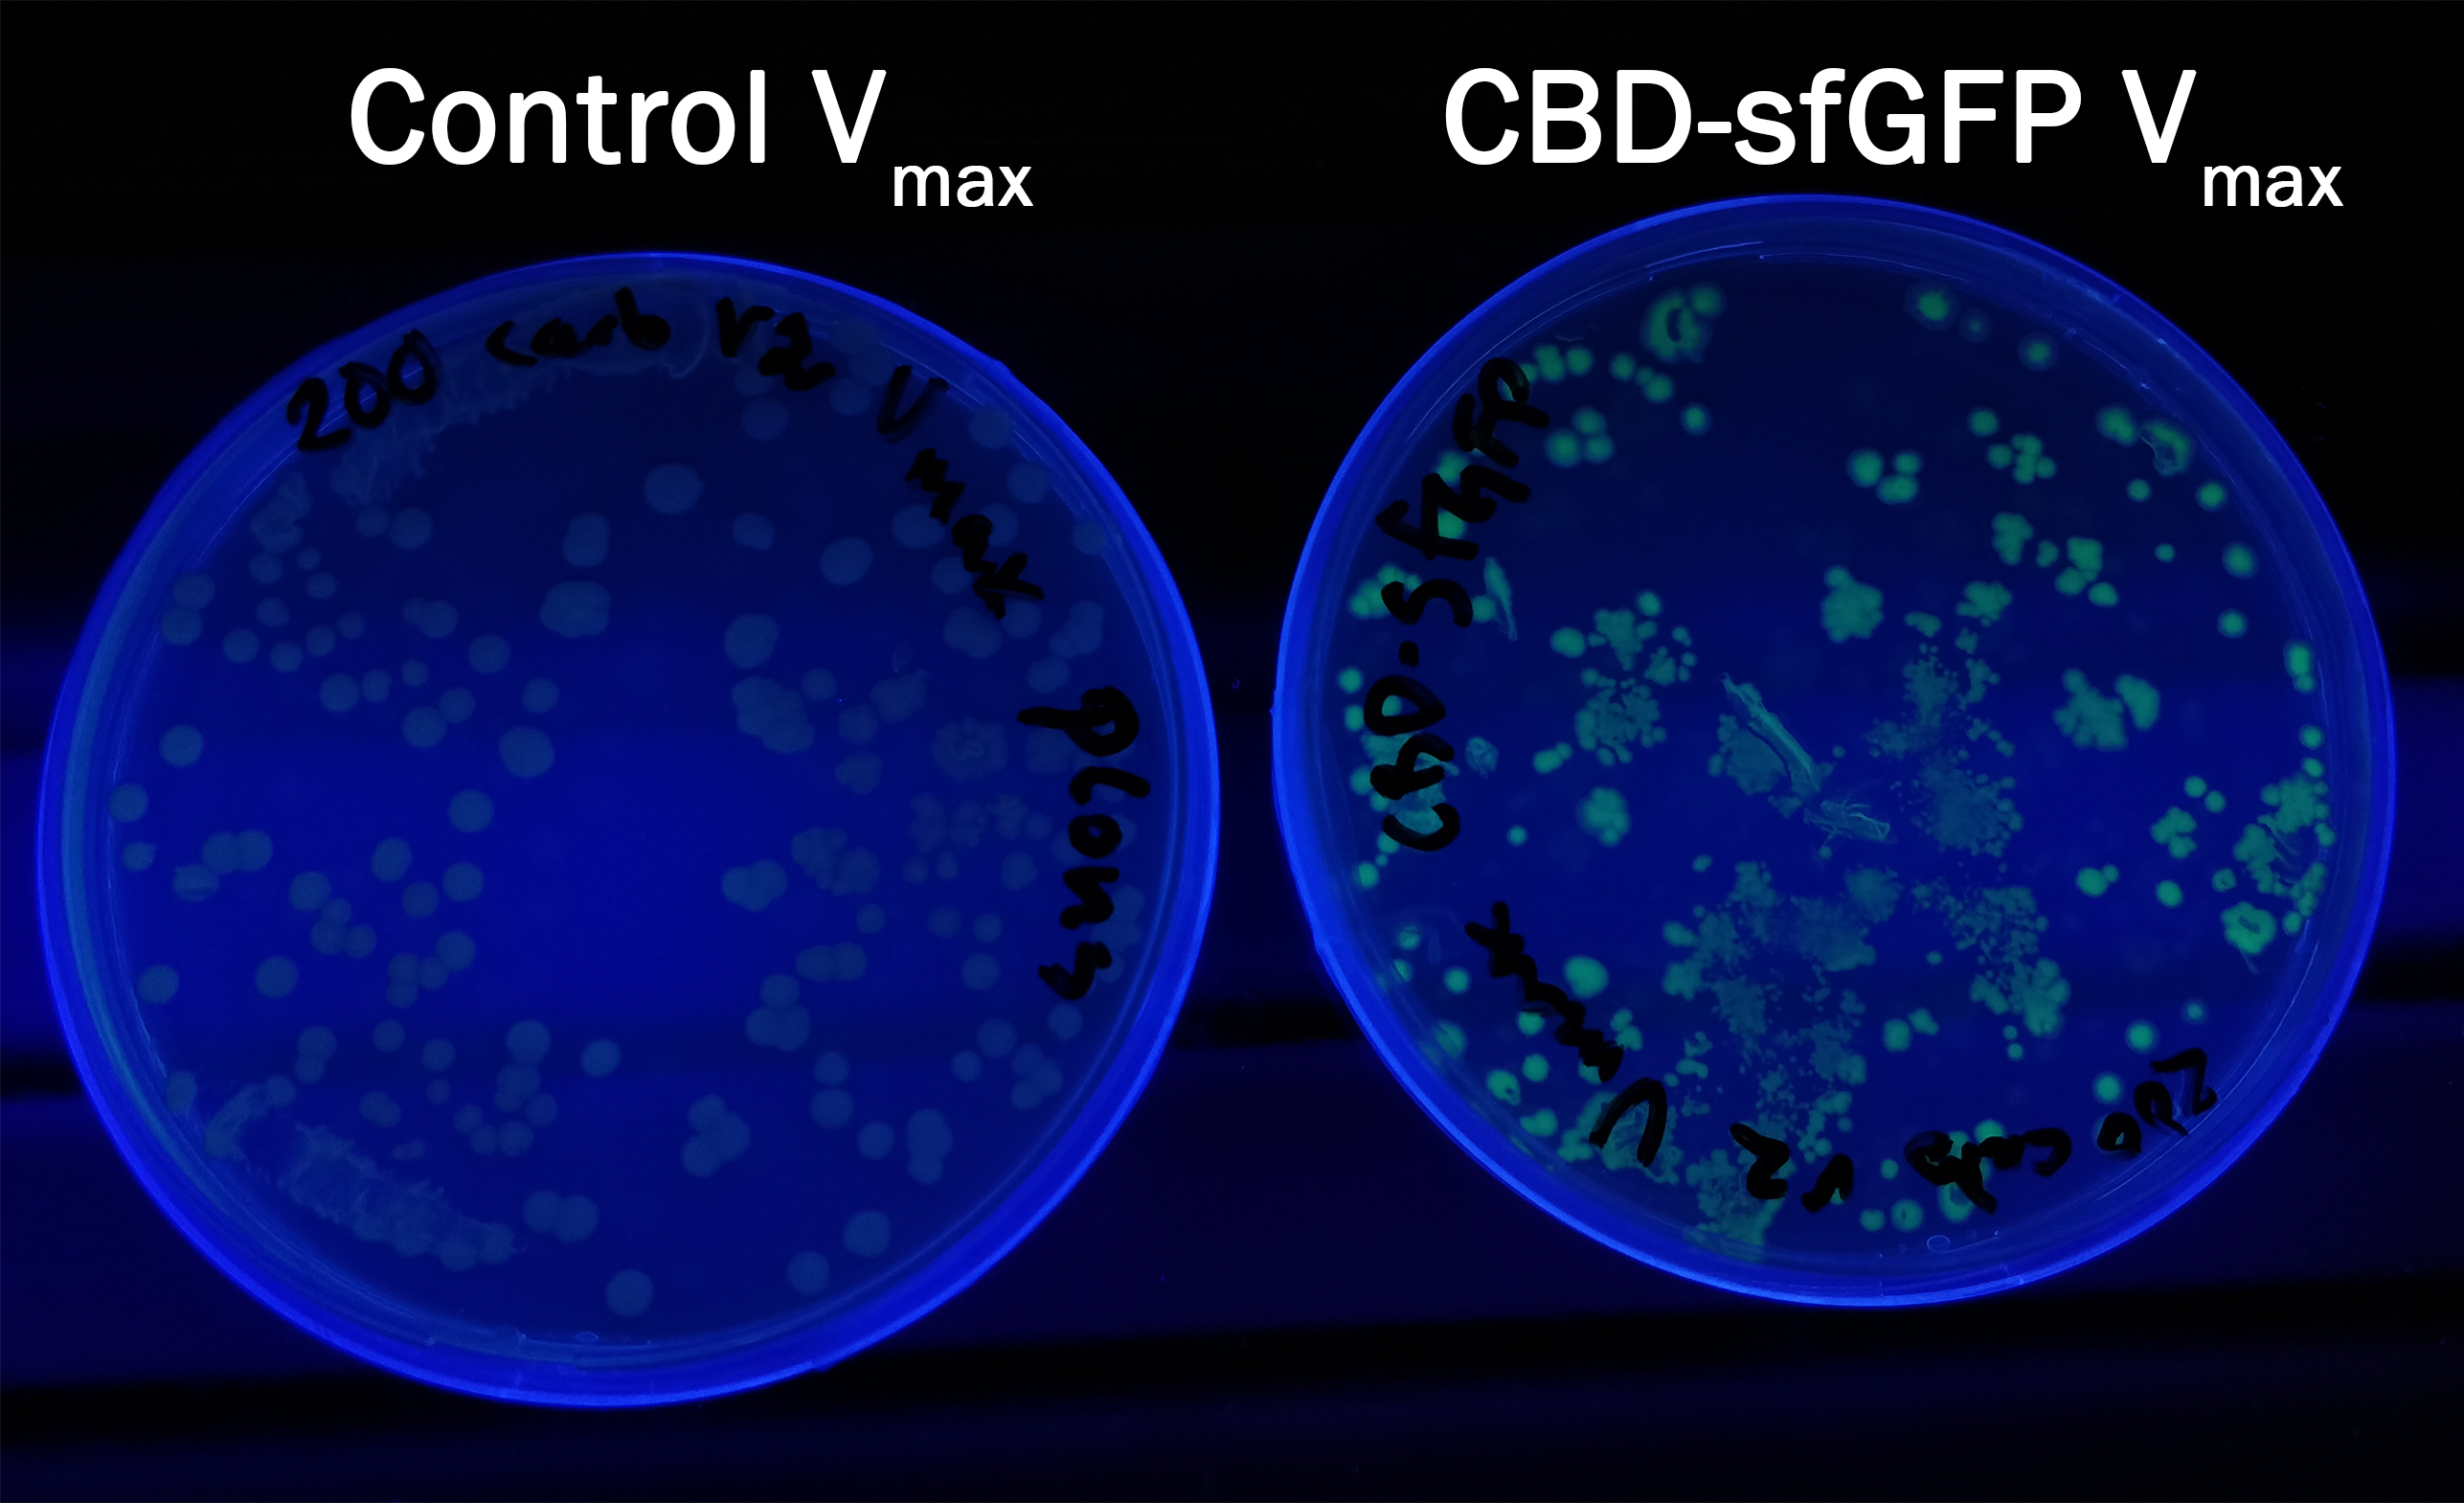
In order to see if sfGFP worked in Vibrio natriegens using the strain Vmax, pUC19-CBD-sfGFP BBa_K3182108 and pUC19-CBD-pCons-AsPink BBa_K3182100 was heat shocked into Vmax. Thereafter, the bacteria was spread onto LB-Miller V2 agar plates with 200 µg/ml carbenicillin and incubated in 37 °C for 16 hours. Both plates were illuminated on an UV-table at 302 nm light (Figure 14). Figure 14 shows CBD-sfGFP in Vmax, emitts a strong green fluorescence, in comparison to the control CBD-pCons-AsPink in Vmax. This indicates that pUC19-CBD-sfGFP was able to replicate and the protein could be expressed.
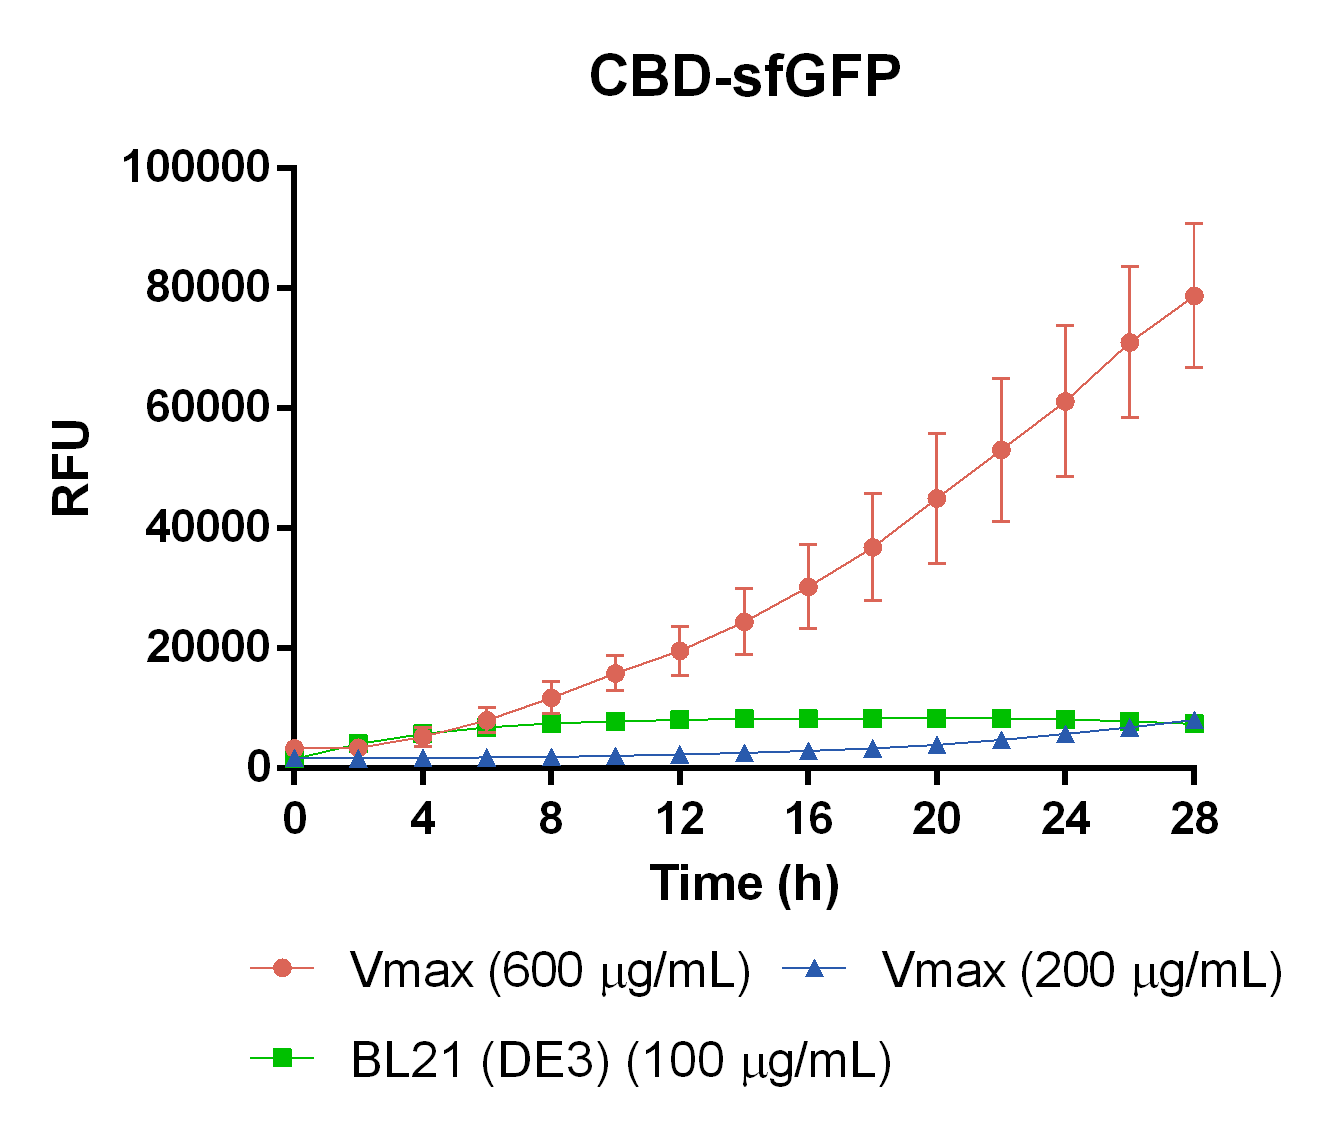
Kinetic expression in Vibrio natriegens
To measure the protein expression of this part in different bacteria and carbenicillin concentrations. E. coli BL21 (DE3) and Vibrio natriegens , using the strain Vmax, was grown in Falcon tubes to 0.5 OD600. Vmax was grown with two different carbenicillin concentrations, 200 and 600 µg/mL, while BL21 (DE3) had 100 µg/mL carbenicillin. The bacteria was induced with 1 mM IPTG and placed in a 96-well plate in 4 replicates with 200 µL per well. A spectrometry experiment was conducted and measured the fluorescence (excitation 470 nm, emission 515 nm) during 28 hours in 37 °C. The results seen in Figure 15 shows that expression in Vmax with 600 µg/mL carbenicillin gave the highest protein yield. Another important factor was the use of an optimal concentration of carbenicillin (600 µg/mL) for Vmax which retained the plasmid more efficiently than Vmax at 200 µg/mL carbenicillin.


