
Part:BBa_K3552015
Ptac-RiboJ
We improved the part BBa_K180000 to improve its productivity. We reversed the Lac operon parts and changed to a reverse promoter, terminator and RBS. A new ribozyme, RiboJ is added to the sequence. This part is in the part collection where we have 12 genes that code for the base generator of pilA.
Sequence and Features
- 10COMPATIBLE WITH RFC[10]
- 12COMPATIBLE WITH RFC[12]
- 21COMPATIBLE WITH RFC[21]
- 23COMPATIBLE WITH RFC[23]
- 25COMPATIBLE WITH RFC[25]
- 1000COMPATIBLE WITH RFC[1000]
KEYSTONE_2022 Characterization
As an IPTG-inducible promoter, we used it to express our santalene-producing enzymes including santalene synthase and ERG20.
Santalene production in E.coli DH5α
After engineering, E. coli could utilize both MEP pathway and MVA pathway for the universal precursors isopentenyl diphosphate (IPP) and dimethylallyl diphosphate (DMAPP), then synthesize santalene with the help of FPP Synthase (FPPS) and santalene synthase (SS). Except heterologously expressed MVA pathway and ERG20 of Saccharomyces cerevisiae and santalene synthase of Clausena lansium (ClSS), several modifications upon ERG20 or ClSS by amino acid mutation, binding to a hydrophillic tag and the construction of fusion protein were tested for the higher yield of santalene. Therefore, with the help of the co-transformation of pMVA plasmid with various pW1 plasmids, including pW1_CE, pW1_CEM, pW1_TCEM and pW1_CEM_FL, different strains like CE, CEM, TCEM, CEM_FL were successfully constructed (Figure 1). The complete pathway we designed for producing santalene in E. coli is illustrated in Figure 1.

Afterwards, the various engineering of E.coli DH5α ∆TnaA mentioned above were used for santalene production. After rapid centrifugation, the supernatant of dodecane was spiked with with 0.475 g/L a-humulene as an internal standard, and then injected into GC/MS for verification of α-santalene production. It turned out that all samples from four strains appeared a significant peak at the retention time of 26-27 min, and various peak area of different samples exhibited santalene production with differing levels, indicating the general success of E. coli engineering. It can be concluded that the E. coli strain CEM (with pW1_CEM plasmid) produces the maximal level of α-santalene compared to other strains (73.93 mg/L). Furthermore, our study elucidates that the mutation of 96th amino acid into tryptophan could increase the yield of α-santalene by about 20%, substantiating the prominent performance of ERG20F96W in enhancing the supply of FPP and α-santalene production in E. coli (Figure 2).

LINKS_China 2021 Characterization
Part of our project is to synthesize natural indigoid dyes from tryptophan in E. coli. This process requires three enzymes: Fre-SttH, TnaA, and FMO. pTac-RiboJ (referred to as only ptac) is used throughout our constructs.
Fre-SttH SDS-PAGE
We first expressed Fre-SttH under T7 promoter in E. coli BL21(DE3) (Fig. 1A). SDS-PAGE of the sample showed decent Fre-SttH expression but suboptimal water solubility, since the supernatant sample has less intense target band compared to the whole cell sample (Fig. 1B).
For producing tyrian purple, Fre-SttH and TnaA has to be in two different strains, so we used a ΔTnaA E. coli strain, courtesy of Sha Zhou. However, our ΔTnaA E. coli was supplied as E. coli DH5α, which was incompatible with the T7 promoter.
Because of the need for a ΔTnaA E. coli strain, we decided to switch from the T7 system to the E. coli DH5α compatible ptac system. We constructed two ptac plasmids, ptac-Fre-SttH and ptac-histag-Fre-SttH, and transformed them into E. coli DH5α ΔTnaA (Fig. 1C).
We then induced expression of both proteins and performed SDS-PAGE. Results show that histag-Fre-SttH expression and solubility were poor, but Fre-SttH had extremely high expression and solubility (Fig. 1D). Thus, ptac-Fre-SttH in E. coli DH5α ΔTnaA was used for all further experiments.

TnaA & FMO
TnaA and FMO are two vital but separate enzymes for converting trp/6-Br-trp to our indigo and tyrian purple dye. To increase the overall reaction speed, we fused these two proteins together into TnaA-linker-FMO.
We designed and engineered three strains of E. coli DH5α ΔTnaA: ptac-TnaA-rbs-FMO (RBS; in this strain TnaA and FMO are expressed as separate proteins), ptac-TnaA-rigid linker-FMO (RL), and ptac-TnaA-Flexible linker-FMO (FL) (Fig. 2A & 2C). As TnaA is expressed as a tetramer and FMO a dimer, we put the TnaA tetramer at the center of the fused protein, with FMO forming two dimers to each side of the TnaA tetramer (Fig. 2B).
After culturing and inducing the expression, the three strains, the SDS-PAGE showed separate expression of TnaA (60kDa) and FMO (54kDa) for RBS, and expression of one fused protein at 114 kDa for RL and FL (Fig. 2D). This indicated expected expression of our fused proteins.

We then cultured and induced RBS, RL, and FL with IPTG. After 20 hours, 1mM of either trp, 6-Cl-trp, or 6-Br-trp was added as substrate, and the relative dye concentration produced by each strain was calculated by using a standard calibration curve (Fig. 3B). The comparison between RBS, RL, and FL shows that there is similar production of tyrian red and tyrian purple, and a significant difference between indigo production of RL and FL. Titers of indigo is approximately 0.30mM (60% yield) for FL and RBS, and 0.20mM (40% yield) for RL. Titers of tyrian red is approximately 0.30mM (60% yield) for RL, FL, and RBS. Titers of tyrian purple is approx. 0.25mM (50% yield) for FL and 0.20mM (40% yield) for RL and RBS.

After confirming the efficacy of Fre-SttH and TnaA-FMO, we wanted to compare TnaA-rbs-FMO with our TnaA-FL-FMO. Therefore, drawing inspiration from GreatBaySZ 2019’s TnaA-rbs-FMO expression system using a constitutive promoter system(TALEsp2), we designed and constructed TALEsp2-TnaA-FL-FMO.
Instead of using 1mM standard samples of trp or 6-X-trp, we attempted to produce dyes from trp and NaX salts. We induced Fre-SttH expression, took the sample supernatant and added it to the ptac-TnaA-FMO and TALEsp2-TnaA-FMO cultures, and compared the titers of the all using supernatant from Fre-SttH cultures as substrate (Fig. 4). There is no significant difference between any of the samples. Both TALEsp2 cultures produced titers of approx. 0.09mM for tyrian purple and 0.23mM for 6, 6’di-chloro-indigo. RL, FL, and RBS both achieved titers of 0.12 and 0.28mM for tyrian purple and tyrian red respectively.

Characterization
This year we improved the previous ptac promoter, part BBa_K180000, found in 2009 by reversing its lacI promoter, RBS, and terminator which will improve its yield of production. We also added three types of ribozymes, RiboJ, SccJ, and SarJ as an insulator to prevent the previous effect from the ptac promoter.
We first carried out an experiment in the culture medium with glucose as the source of carbon for the cultivation of bacteria in the M9 medium. In this experiment, we tested four ptac promoter, the old one, the new one, the one with RiboJ, and with SccJ. We are convinced that all ptac promoter can be activated when induced by IPTG, and as the concentration of IPTG increases, the expression of GFP genes promotes. Furthermore, the addition of two different types of ribozyme shows a prominent improvement of sensitivity towards the concentration of IPTG. At zero concentration of IPTG, all four promoter starts at a similar level, as the concentration of IPTG increases, the gradient of the graph increased dramatically.
Afterward, according to our own medium, which utilizes glycerol as the only source of carbon, we attempted to simulate this situation for all five types of ptac promoter to investigate whether they can fit our experiments or not. Therefore, we substituted the medium to glycerol-M9 medium. The collected results imply that all five promoters can be activated obviously and the same as in glucose, promoters with ribozyme also obtain high sensitivity to the concentration of IPTG and dramatically increased.
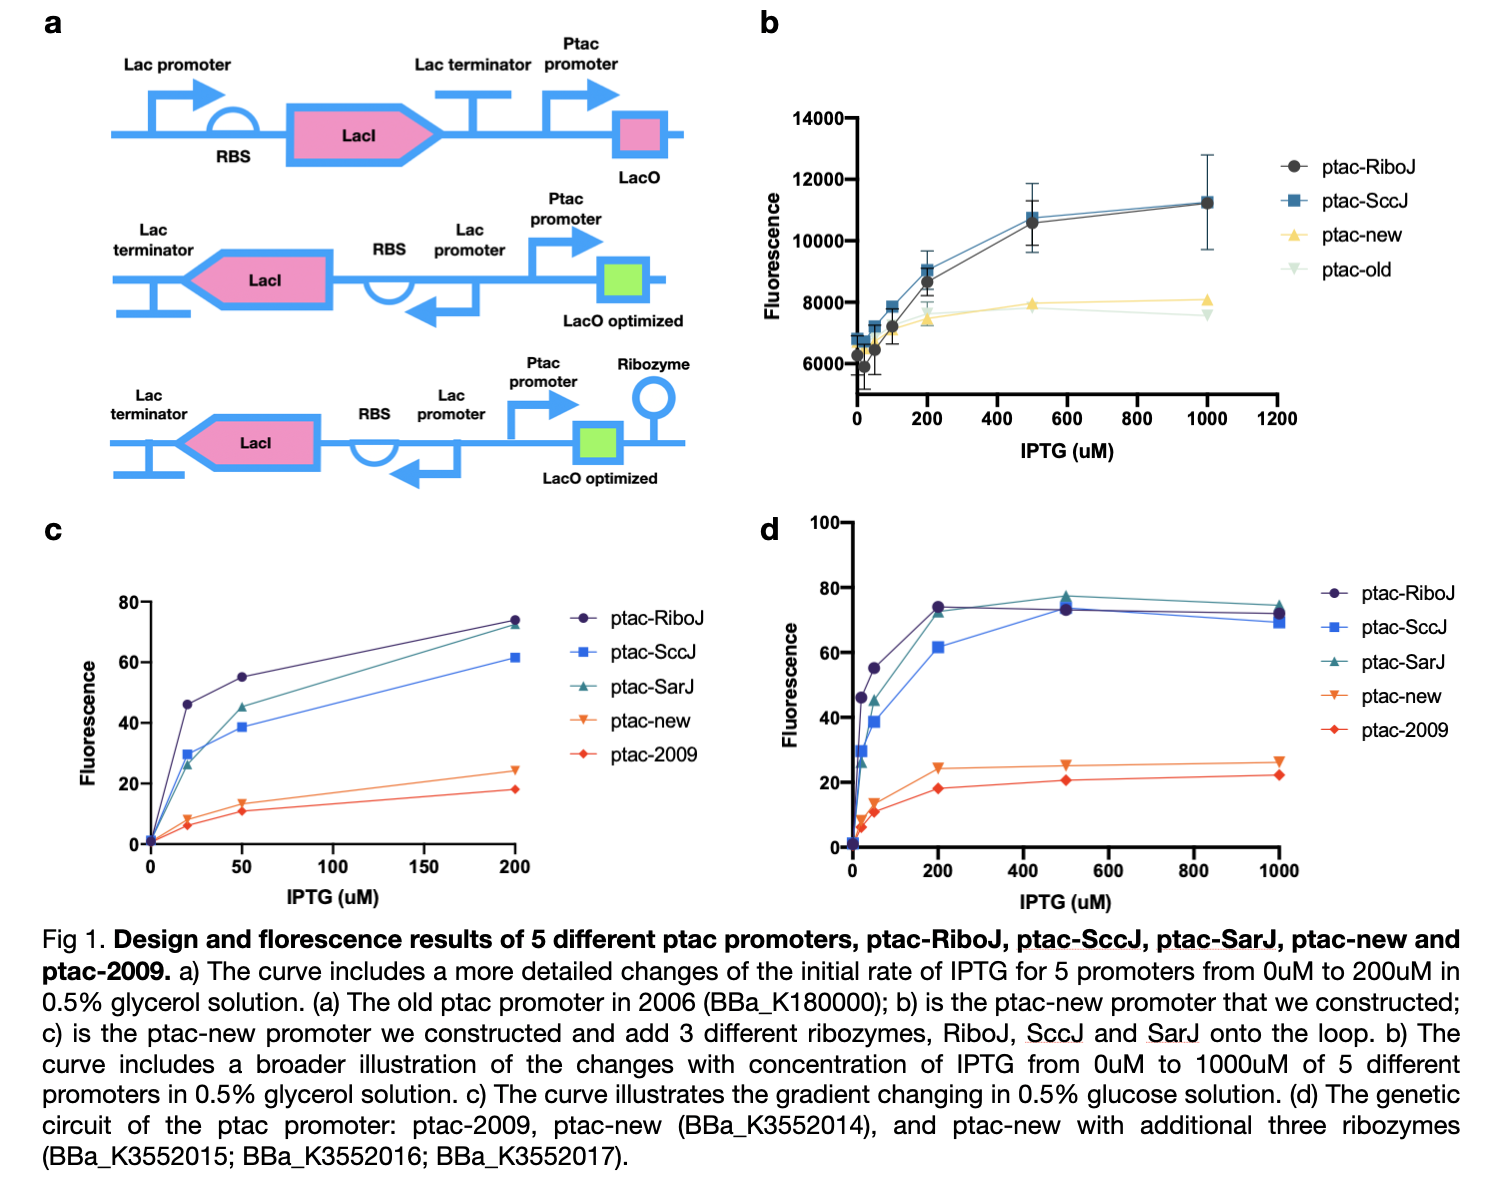

These results confirmed the effect of our sensors under various types of carbon sources and maintain nearly no difference in practicability. We modified four new ptac promoter parts which are convinced to have higher sensitivity and adapt better to IPTG than the BBa_K180000 discovered in 2009.
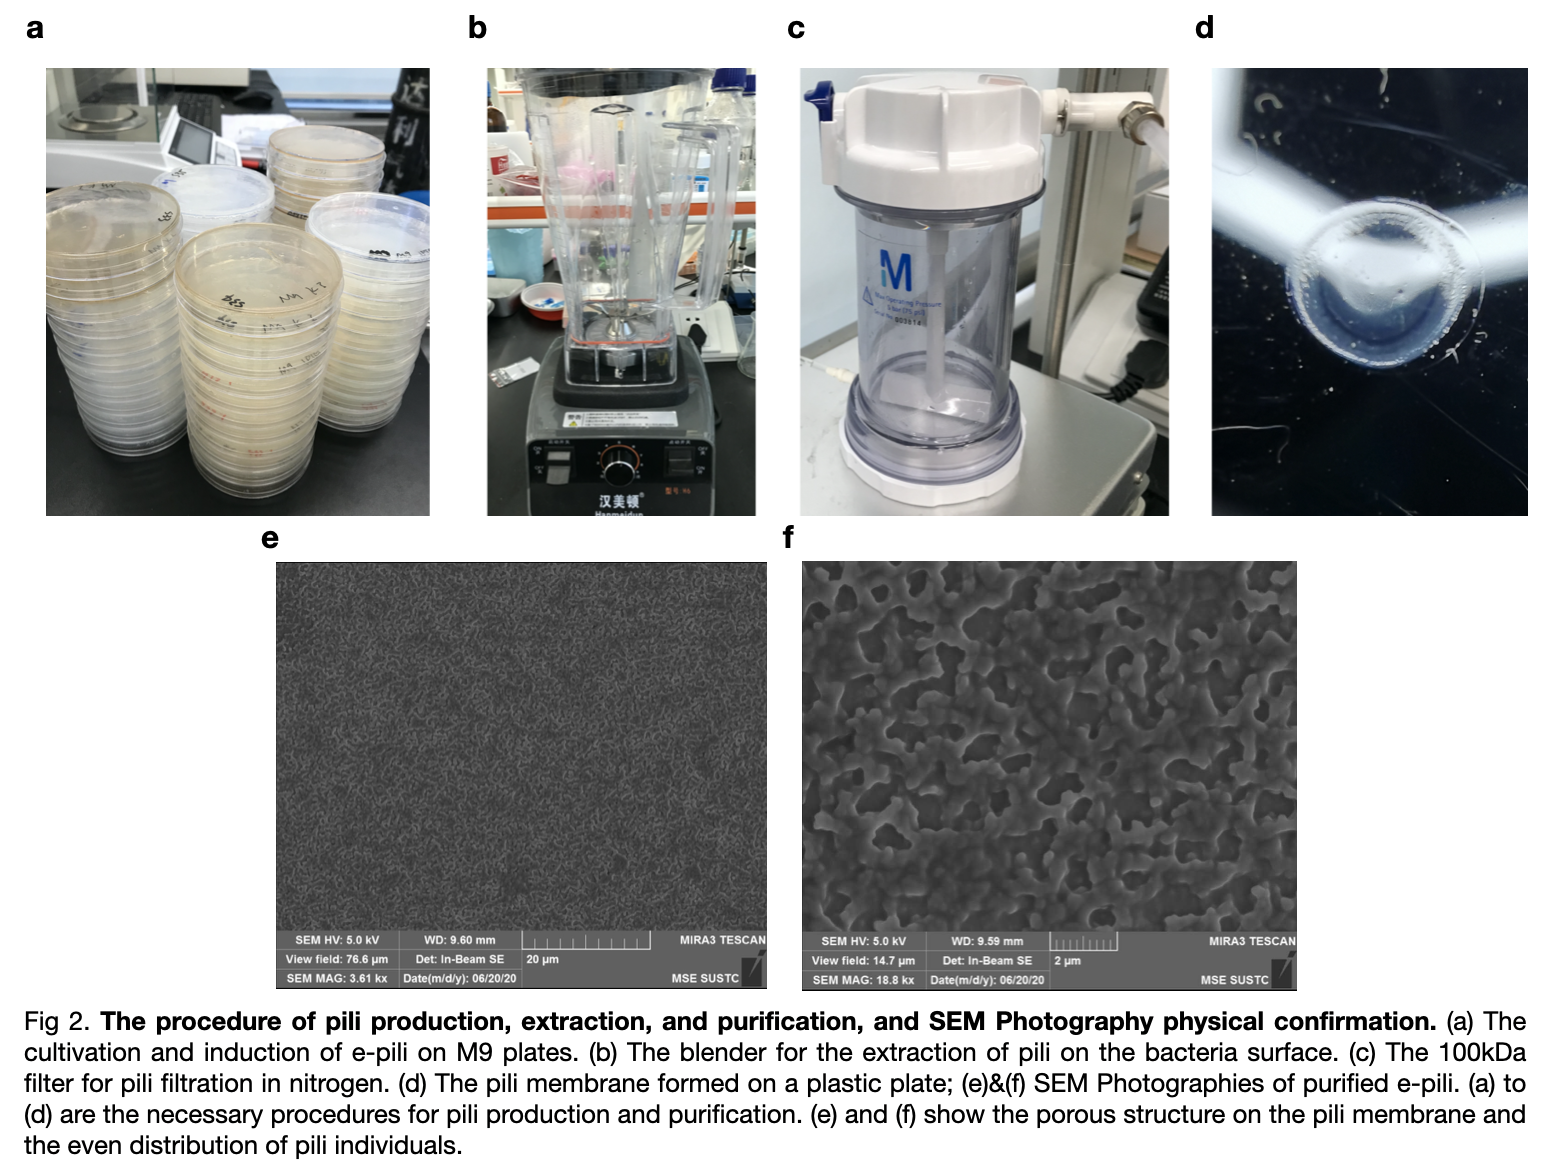
pili generation
Then we inserted the ptac-RiboJ into our own plasmid instead of the BBa_K180000. The promoter is placed before pilA and we carried out the extraction experiment of pili to verified the function of the ptac-RiboJ promoter.
We transformed the plasmid with ptac-RiboJ promoter into E.coli BL21. Then, cultivated the pili and expressed in vivo. We extracted them finally to 150mM ethanol-amine and filtrate to obtain the required supernatant. We took an SEM photography of the pili which confirm the growth of pilA as there are many hole-like structures in the photography.

| None |