
Part:BBa_J364000
Test Device 1 for the iGEM InterLab Study
This is a GFP expressing constitutive device for the 2017 iGEM InterLab study. It is called Test Device 1 for the study for easy reference.
This device is stored in pSB1C3 for the InterLab and is fully BioBrick compatible.
Interlab 2022 Experiment 3 Device
- Test Device 1 for Experiment 3 of the 2022 iGEM Interlab
The following device is used in the iGEM 2022 InterLaboratory Study for Experiment 3.
Sequence and Features
- 10COMPATIBLE WITH RFC[10]
- 12INCOMPATIBLE WITH RFC[12]Illegal NheI site found at 7
Illegal NheI site found at 30 - 21COMPATIBLE WITH RFC[21]
- 23COMPATIBLE WITH RFC[23]
- 25COMPATIBLE WITH RFC[25]
- 1000INCOMPATIBLE WITH RFC[1000]Illegal BsaI.rc site found at 705
Team NAWI_Graz 2019: GFP dynamics of transformed Escherichia coli strains in LB broth
Background
In Team NAWI_Graz 2019, we found that in normal growth/incubation condition (37oC, LB media + chloramphenicol)
BBa_J364000-transformed Escherichia coli BL21 cells had the highest GFP expression in comparison to BL21 Star and Top 10 strains. Values were consistently higher for BL21 strain over the entire 44-hours measuring period.

We used three different strains of transformed E. coli (Top10,BL21 and BL21 Star) for this study. Transformed strains were incubated in 15 mL LB broth 37 oC overnight. Next day they were used to inoculate a 50 mL LB to OD600=0.1. The cultures were then incubated at 37 oC, 140 rpm and samples were taken every 4 hours for 2 days to determine the green fluorescence protein (GFP) fluorescence intensity at 510 nm.
Result and Findings
- There are significant differences of GFP expression in different strains of E. coli (Top10, BL21, BL21 Star)
- Cultures turned light green under white light after around 14-18 hours of incubation time.


Improvement
- Group: iGEM Team UESTC-China 2019
- Author: Qiuyun Huang, Zixin Wang
This year, we improved this reporter device (BBa_J364000) into a surface display system (BBa_K3034007) (Fig. 1) by fusing GFP with INPNC (BBa_K523008). The improved system can anchor the downstream protein of INPNC to the surface of bacteria, while the GFP is used as the reporter gene. So, other teams who have the need of surface display can insert their target gene into this system.

Ice nucleation protein (INP) is a secretory outer membrane protein from Pseudomomas syringae, P.flurorescens and several other Gram-negative bacteria. INP can anchor one or more "passenger proteins" to the outer membrane of bacteria. The fixation of exogenous proteins on the bacteria surface through INPNC can not only greatly improve the efficiency of enzymatic reaction, but also avoid the degradation of exogenous proteins by intracellular enzymes of host cells[1].
Besides, we added a segment of linker between INPNC and GFP to ensure that two adjacent domains do not sterically interfere with one another. In our experiments, without linker, GFP could not be properly expressed.
Quantitative detection of fluorescence
First, we cultured the bacteria overnight and adjusted them to the same OD600. We ultrasonic broke, centrifuged and respectively resuspend precipitation to measure the fluorescence intensity of GFP in E.coli DH5α carrying BBa_J364000 and E.coli DH5α carrying BBa_K3034007 (Fig. 2).

The results showed that both precipitation and supernatant contained relatively strong GFP. Moreover, the distribution of GFP in E.coli DH5α carrying BBa_K3034007 was not significantly different from that in E.coli DH5α carrying BBa_J364000. There are some differences with our expectation, after analysis, it may be caused by incomplete ultrasonic broken of bacteria.
Since the E.coli DH5α carrying BBa_K3034007 expressed GFP, this indirectly indicated that INPNC was successfully expressed. However, the content of GFP in the E.coli DH5α precipitate (cell membrane) carrying BBa_K3034007 was not significantly higher than the E.coli DH5α carrying BBa_J364000. We hypothesized that INPNC was expressed but the efficiency was not so high.
Microscopic observation
Next, we used fluorescence microscopy to see if the INPNC worked. E.coli DH5α carrying BBa_J364000 (GFP) was rod-shaped and the fluorescence was equably distributed in E.coli (Fig. 3a). The fluorescence of E.coli DH5α carrying BBa_K3034007 (INPNC+GFP) was observed to be dotted and dispersed on the surface of E.coli (Fig. 3b,3c). The results proved that GFP has apparently been anchored to the surface of the E.coli and INPNC was working.
In addition, we also noticed that E.coli DH5α carrying BBa_K3034007 (INPNC+GFP) had fluorescence aggregation on one side of the E.coli surface (Fig. 3c). The result is consistant with fact that we found in the literature[2] that the INPNC forms aggregates in the cell membrane.Thus, we are more clear that we have achieved our improvement.

Conclusion
- We improved this part. GFP is an intracellular reporter gene, and we achieved the expression of GFP on the surface of E.coli.
- Based on the current results, there is space for further improvement in the efficiency of system expression, and the key point is that the activity of INPNC needs to be improved.
- Other teams who have the need of surface display can insert their target gene into this system. For example, the system can be applied to whole-cell biocatalysts, heavy metal contamination adsorption, antigen and antibody display, etc[1].
</html>
Team PuiChing Macau 2021: E.coli growth in food waste analysis
We would like to analyze the growth of E.coli via Green Fluorescent Protein (GFP). To examine the growth of E.coli in food waste, the Optical Density of E.coli is commonly used. Yet, in the presence of food waste (starch from rice as an example here), it is difficult to measure the O.D. value of E.coli growth at a wavelength of 600 nm (O.D.600), where determining the growth phase is almost impossible. Thus, we would like to use Green Fluorescent Protein (GFP) (488 nm and 510 nm) to establish a model of E.coli’s growth in food waste (starch).
Result
We estimate the number of bacteria in the culture by assessing the emission wavelength for fluorescence signals at O.D.510 and O.D.600. The tested samples are composed of 100ml of LB medium and 1.5ml of overnight bacteria culture. The time points measured are 0hr, 4hr, 12hr, and 24hr.
As demonstrated by Fig.3 (3a, 3b, 3c, 3d), samples with GFP have shown higher absorbance compared with controls of BL21. And samples in the presence of food waste (starch) have also shown higher absorbance than those without food waste (starch).
<img style="width:100%; height:auto" src="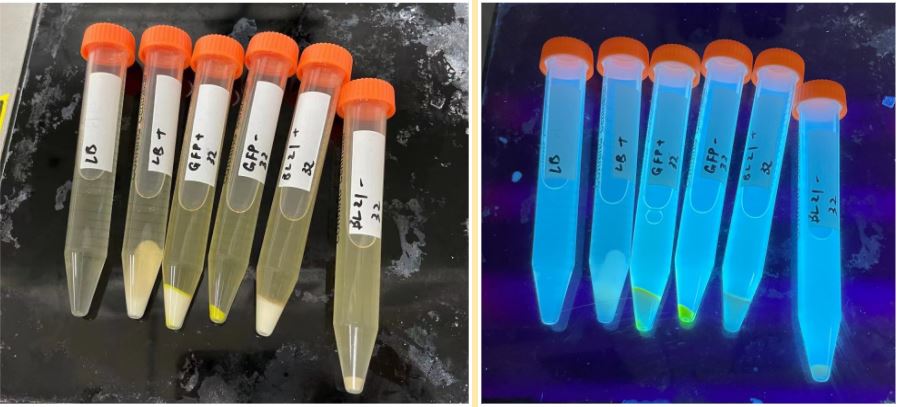 ">
">
Fig 1a, 1b. Experiment culture (bacteria and GFP) centrifuged: 1a normal; 1b under UV light(from left to right: 1. LB 2. LB+starch 3. GFP+starch 4. GFP 5. BL21+starch 6. BL21
<img style="width:100%; height:auto;" src=" ">
">
Fig 2a 2b. Experiment culture (bacteria and GFP) under UV light: 2a with starch; 2b without starch (from left to right: 1. BL21+starch 2. GFP+starch 3. GFP 4. BL21)
<img style="width:100%; height:auto" src="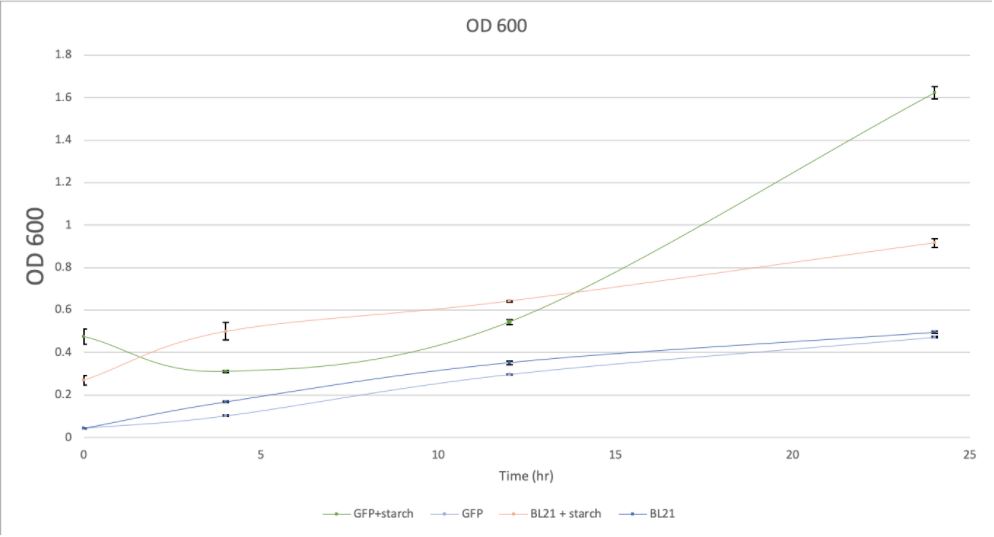 ">
">
Fig 3a O.D.600 of BL21 culture with starch and without starch
<img style="width:100%; height:auto" src="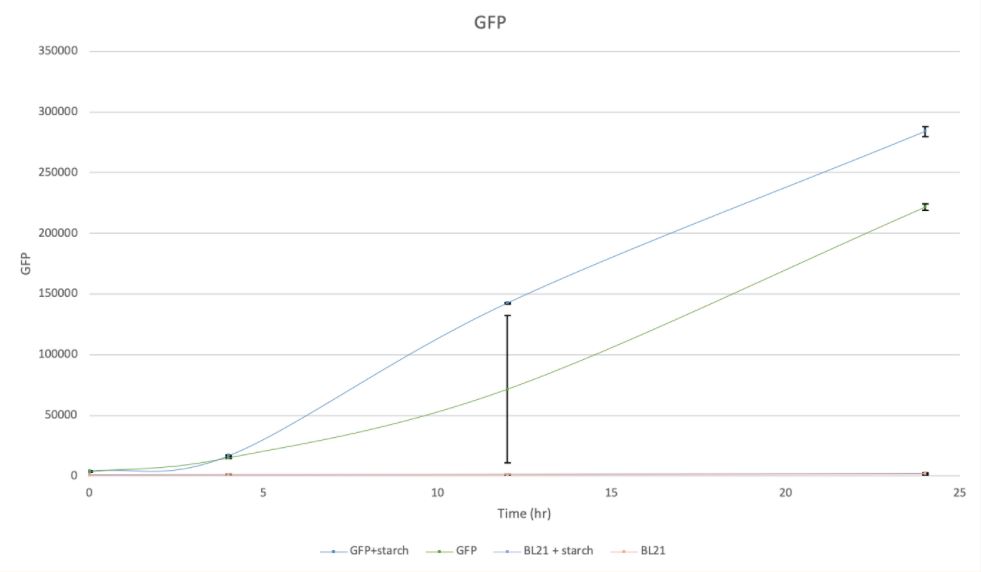 ">
">
Fig 3b GFP signal intensity of BL21 culture with starch and without starch
<img style="width:100%; height:auto" src="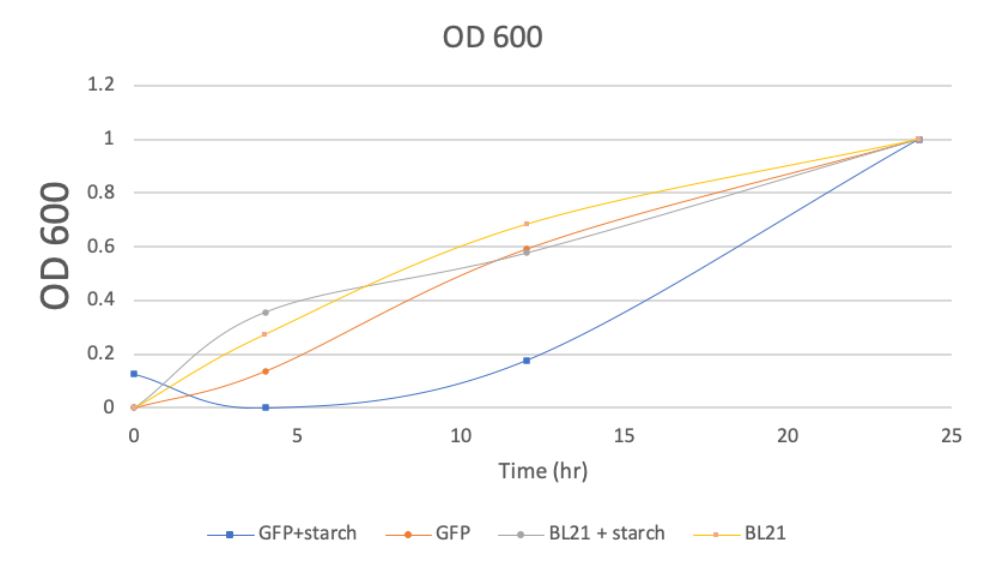 ">
">
Fig 3c O.D.600 signal intensity of BL21 culture with starch and without starch (normalized)
<img style="width:100%; height:auto" src=" ">
">
Fig 3d GFP signal intensity of BL21 culture with starch and without starch (normalized)
PuiChing_Macau 2022
E.coli (GFP_pET11a) growth curve


To test whether E. coli can grow and express GFP in the hydroponic nutrient solutions, we compared the growth of E. coli and GFP expression in the hydroponic solution, LB medium, and water. We calculated the standard error (SEM), with n=3:

where σ is the standard deviation, and n is the number of trials.
We found that the E. coli transformed with GFP is most suitable to grow in LB, followed by hydroponic solution and finally pure water. As expected, the Absorbance OD600 of cell culture in LB medium is the highest. The absorbance in the hydroponic solution is lower than LB, however, it is higher than pure water, suggesting the E.coli can grow with the hydroponic solution.
The absorbance in the hydroponic solution reached a peak at the 25th hour, which shows that the E.coli grew and multiplied on the first day. Then, in the 25th to the 45th hour, the value decreases to around 0.1. After that, from the 45th to the 100th hour, the value remains stable. At the 100th to 180th hour, the value increases steadily. These suggest E. coli can grow and survive in hydroponic solution over days.
The group's absorbance in pure water peaked at the 25th hour and decreased between the 25th to the 70th hour. This demonstrates that on the first day, the E.coli can still survive in pure water, but in the following hours the E.coli died out.
The trends of GFP fluorescence emission rate correspond to the trends of absorbance rate, showing a positive correlation between GFP protein expression and the growth of E. Coli. GFP fluorescence was highest in LB, but it is still substantially present in hydroponic solution.
To sum up, the data indicate that E. Coli cells can survive within hydroponic systems. The data indicate that E. coli cells can survive and express protein within hydroponic systems, as demonstrated by the growth and GFP expression. (Figures 1a and 1b)
Compared to hydroponic water and LB medium, the rank of growing environments from most to least suitable E. coli transformed with GFP is LB> hydroponic water> pure water. The Absorbance rate of cell culture in the LB medium is the highest, the recorded rate in the hydroponic water is lower than LB group, however, it is higher than in pure water.
The Absorbance rate in LB medium is the highest and keeps increasing throughout the 180 hours. This indicates that the LB medium is suitable for E.coli to grow.
The Absorbance rate in hydroponic water reached a peak at the 25th hour, which shows that the E.coli survived and multiplied on the first day. Then, in the 25th to the 45th hour, the value decreases to around 0.1. After that, from the 45th to the 100th hour, the value remains stable. At the 100th to 180th hour, the value increases steadily.
The group in pure water has reached its peak at the 25th hour, and the rate decreases between the 25th to the 70th hour. In the following 100 hours, the rate slightly fluctuates. This demonstrates that on the first day, the E.coli can still survive in pure water, but in the following hours, the E.coli died.
To sum up, the data indicate that E. coli cells can survive and express protein within hydroponic systems, as demonstrated by the growth and GFP expression.(Figure 1)


Reference
[1] Li mingya, & Lin chenshui. (2016). Ice crystal nuclear protein and its application in bacterial surface display technology. Amino acids and biological resources, 38(2), 7-11. [2] Qiu, Y., Hudait, A., & Molinero, V. (2019). How Size and Aggregation of Ice-Binding Proteins Control Their Ice Nucleation Efficiency. Journal of the American Chemical Society, 141(18), 7439-7452.
//classic/plasmid/measurement
| None |