
 1 Registry Star
Part:BBa_J23118
constitutive promoter family member
|
|
Variant RFP (au) J23112 1 J23103 17 J23113 21 J23109 106 J23117 162 J23114 256 J23115 387 J23116 396 J23105 623 J23110 844 J23107 908 J23106 1185 J23108 1303 J23118 1429 J23111 1487 J23101 1791 J23104 1831 J23102 2179 J23100 2547 |


Constitutive promoter family
Parts J23100 through J23119 are a family of constitutive promoter parts isolated from a small combinatorial library. J23119 is the "consensus" promoter sequence and the strongest member of the family. All parts except J23119 are present in plasmid J61002. Part J23119 is present in pSB1A2. This places the RFP downstream of the promoter. Reported activities of the promoters are given as the relative fluorescence of these plasmids in strain TG1 grown in LB media to saturation. See part BBa_J61002 for details on their use.
These promoter parts can be used to tune the expression level of constitutively expressed parts. The NheI and AvrII restriction sites present within these promoter parts make them a scaffold for further modification. JCAraw
Saba: parts BBa_J23118 and BBa_J23110 are the same.
Sequence and Features
- 10COMPATIBLE WITH RFC[10]
- 12INCOMPATIBLE WITH RFC[12]Illegal NheI site found at 7
Illegal NheI site found at 30 - 21COMPATIBLE WITH RFC[21]
- 23COMPATIBLE WITH RFC[23]
- 25COMPATIBLE WITH RFC[25]
- 1000COMPATIBLE WITH RFC[1000]
Baltimore Biocrew 2019 Characterization
Goal
We, the Baltimore Biocrew, decided to characterize some of the Anderson promoters. These promoters are highly used by iGEM but the relative expression of these promoters have been routinely determined by measuring the fluorescence of a reporter protein. However, the function of a promoter is to start transcription of a gene so it may be more informative to measure the amount of RNA (instead of protein) produced by a reporter gene. Therefore, we decided to further characterize a selection of the Anderson promoters (J23100, J23101, J23103, J23105, J23118) by measuring RNA using reverse-transcription quantitative Polymerase Chain Reaction (qPCR).
Results
We set up samples for qPCR with three or four technical replicates per promoter and no template control samples to measure DNA contamination. We did data analysis using the Livak Method (a standard, comparative method) to determine the relative strength of the promoters from the qPCR data using rrSD as our reference gene, RFP as our target gene, and J23100 as our calibrator sample.
Example:
ΔCT(J23101) = CT(RFP, J23101) – CT(rrSD, J23101)
ΔΔCT(J23101) = ΔCT(J23101) – ΔCT(J23100)
2^(–ΔΔCT) = relative expression ratio
In our first trial of qPCR (8/03/19), we were able to measure the relative strengths for J23100, J23101, J23103, and J23105 which were 1.00, 0.00, 0.81, and 1.93, respectively. Since these strengths did not match the relative expression levels reported by iGEM2006_Berkeley from protein level measurements, we repeated the qPCR (8/10/19) with the same cDNA. The strengths from this second trial were 1.00, 0.00, 0.37, and 0.20. We repeated it again and the relative strengths that we got on 10/12/19 for J23100, J23101, J23103, and J23103 were 1, 0, 2.91, and .32. Next, we made new cDNA by growing new liquid cultures, extracting RNA again, and repeating reverse transcription. From the new cDNA, we repeated the qPCR procedure two more times. The relative strengths for that we got on 9/28/19 for J23100, J23101, J23103, J23105, and J23118 were 1, 24.63, .36, 1.76, and .25. The relative strengths that we got on 10/12/19 for J23100, J23101, J23103, and J23105 were 1, 45.97, 3.20, and 1.26. In addition we measured promoter J23118 twice and got the strengths 1.13 and 1.32.
Here is the relative promoter strengths that we got from the qPCR. Baltimore BioCrew measurements in orange compared to the 2006 Berkeley iGEM, who determined relative strengths from measurements at the protein level, in blue.

To support our RNA measurements we also measured fluorescence of the liquid cultures we used to extract RNA. The cultures were grown overnight so we expected the bacteria to be at the stationary phase, but we measured OD to normalize any differences in growth.
| Promoter | OD | fluorescence | fluorescence divided by OD | corrected relative expression | reported relative expression |
|---|---|---|---|---|---|
| BBa_J23100 | 0.876 | 250 | 285.38 | 1 | 1 |
| BBa_J23101 | 0.674 | 255 | 378.33 | 1.33 | 0.7 |
| BBa_J23103 | 1.1 | 230 | 209.09 | 0.73 | 0.01 |
| BBa_J23105 | 1.08 | 215.74 | 209.09 | 0.76 | 0.24 |
| BBa_J23118 | 1.04 | 238 | 228.84 | 0.80 | 0.56 |
After redoing our protocol many times and trying to compare our results to 2006 Berkeley iGEM team we concluded that our data doesn’t quite match theirs. The different results in strengths could be caused by many different factors while doing our protocols. However, we have succeeded in characterizing the different strength Andersons promoters (J23100, J23101, J23103, J23105, J23118) by measuring RNA using Quantitative Polymerase Chain Reaction (qPCR). In conclusion, we successfully reached our goal in bringing new data to the characterizations of 5 different Andersons Promoters. In the future, it would be good for other iGEM teams to try to measure RNA as well so there will be a standard qPCR protocol for iGEM.
To see more detailed methods and our protocols, visit our wiki
iGEM Team 2019 Stuttgart Characterization
We added quantitative experimental characterization to the following biobricks:
BBa_J23100
BBa_J23112
BBa_J23118
These parts are a family of constitutive promoters. They were present in plasmid BBa_J61002.
We analyzed the influence of the mentioned promoters on the expression of red fluorescence protein (RFP),
both on protein level (fluorescence spectroscopy) and mRNA level using reverse transcriptase quantitative polymerase
chain reaction (RT-qPCR).
Biobricks were transformed in E. coli MG1655. Cells were harvested in the early exponential phase and
fluorescence was measured. Also, 500 µL of culture was centrifuged and the pellet was used for RNA extraction.
In addition to that, E. coli MG1655 was cultured and harvested for RNA isolation without the plasmid
BBa_J61002 to ensure, that our primers specifically bind to RFP mRNA.
RT-qPCR was performed and analyzed using the ddCt method. To quantify the expression levels of RFP under different
promoters, the cDNA of a house-keeping gene was amplified as well. We chose a GTPase-activation protein (GAP) as a
housekeeping gene.
Results of fluorescence spectroscopy
Investigating the grown cell cultures by fluorescence spectroscopy clearly showed emission at 590nm (excitation at
540 nm) indicating a successful expression of RFP. Cells containing the promoter BBa_J23100 showed an emission at
590 nm of 192 +- 13. Compared to that, cells containing the promoter BBa_J23112 showed an emission of 30 +- 1. The
highest emission was shown by cells containing the promoter BBa_J23118: 345 +- 4.
Results of qPCR
Figure 1 shows, that RFP expression was about 7-fold higher than the expression of GAP in cells containing promoter BBa_J23100. Compared to
that, the expression of RFP in cells containing promoter BBa_J23112 was about 55-fold higher than expression of the
house-keeping gene. The highest expression of RFP compared to GAP was observed in cells containing promoter BBa_J23118.
Here, RFP expression was 74-fold compared to GAP expression.
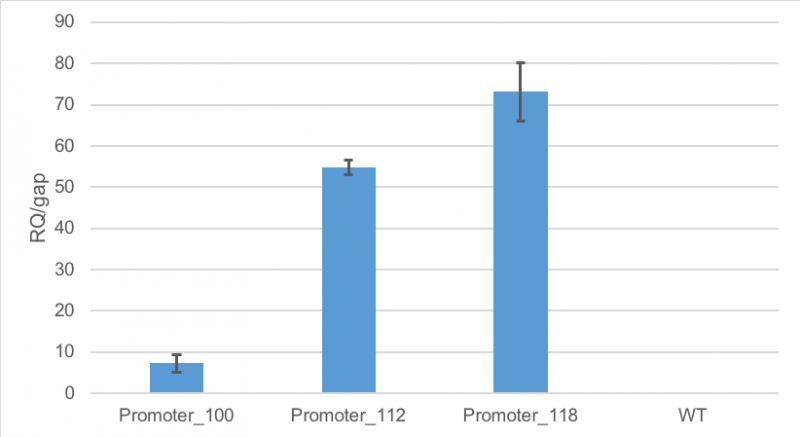 Figure 1: Average relative quantification of RFP expression compared to the expression of the house-keeping gene GAP in E. coli
MG1655.
Cells contained the plasmid BBa_J61002 with different promoters: BBa_J23100, BBa_J23112 and BBa_J23118. As a
control
E. coli MG1655 were cultivated without the plasmid. RT-qPCR measurements were carried out in technical triplicates. Standard deviation is shown
Figure 1: Average relative quantification of RFP expression compared to the expression of the house-keeping gene GAP in E. coli
MG1655.
Cells contained the plasmid BBa_J61002 with different promoters: BBa_J23100, BBa_J23112 and BBa_J23118. As a
control
E. coli MG1655 were cultivated without the plasmid. RT-qPCR measurements were carried out in technical triplicates. Standard deviation is shown
We were surprised by the results of the characterization of the Anderson promoters as they do not meet our expectations. Actually, we expected that the use of different promoter strengths would result in different levels of mRNA in a way that weak promoters would result in weak fluorescence and low corresponding mRNA levels and strong promoters would lead to high corresponding mRNA levels. More precisely, we expected cells with the promoter BBa_J23100 to exhibit the highest mRNA level, as it was supposed to be the strongest promoter of the ones we characterized.
When measuring fluorescence, we obtained the expected results: it was revealed, that cells with the promoter BBa_J23100 (strongest promoter) produced more RFP than cells with the promoter BBa_J23118. Cells with the weakest promoter (BBa_J23112) produced fewest amounts of RFP.
Possible reasons for the discrepancy between promoter strength, RFP amount and mRNA concentration could lie in the promoter library itself: Changes in the promoter sequence to generate the library could lead to impaired secondary structure of the mRNA. This in turn may influence the binding of ribosomes and the translation initiation efficiency significantly.
It may be possible, that the differences in fluorescence are mainly caused by changes on the translational level and not on transcriptional level, as to date promotor strength for these biobricks was only determined by fluorescence measurements.
For more information, detailed material and method description, please visit our wiki
|
•••••
University of Texas at Austin iGEM 2019 |
UT Austin iGEM 2019: Characterization of metabolic burden of the Anderson SeriesDescriptionThe 2019 UT Austin iGEM team transformed the Anderson Series promoters into our 'burden monitor' DH10B strain of E. coli, which contains a constitutive GFP cassette in the genome of the cell. GFP expression fluctuates depending on the number of ribosomes available. Using this strain, we characterized the relative burden (percent reduction in growth rate) of each Anderson Series part. Our results showed a range of growth rate reductions for each of these parts due to ribosomal reallocation from the genome of the host cell, towards the expression of RFP. Anderson Series parts with strong promoters are depicted with darker red colors and Anderson Series parts with weak promoters are depicted with lighter pink colors to show relative RFP expression. We saw a positive correlation between relative promoter strength and metabolic burden; parts with stronger promoters expressed less GFP and had a lower growth rate than parts with weaker promoters. The regression line for the graph below was constructed by measuring the burden of 5 parts that were created by the 2019 UT Austin iGEM team that each contained an Anderson Series promoter (BBa_J23104 or BBa_J23110), an RBS of varying strength, and a BFP reporter. For more information on characterization of these parts through the burden monitor, visit our team’s wiki page: [1]
Importance of Characterizing BurdenAlthough often we cannot avoid using a specific burdensome part, knowing in advance that it is burdensome, and that it has a high chance of mutating into a non-functional genetic device, can help with troubleshooting and coming up with alternatives. In the specific case of fluorescent protein-expressing devices, Fluorescence-activated cell sorting (FACS) can be used to filter out individual cells that meet a certain fluorescence threshold. This way, the cells expressing lower levels of the fluorescent protein are weeded out of the population. |


//direction/forward
//promoter/anderson
//regulation/constitutive
//rnap/prokaryote/ecoli/sigma70
| negative_regulators | |
| positive_regulators |