Part:BBa_J04500
IPTG inducible promoter with RBS
R0010.B0034
Usage and Biology
R0010 and B0034 will be digested and ligated together in the manner described on the "Registry of Standard Biological Parts" website.
Sequence and Features
- 10COMPATIBLE WITH RFC[10]
- 12COMPATIBLE WITH RFC[12]
- 21COMPATIBLE WITH RFC[21]
- 23COMPATIBLE WITH RFC[23]
- 25COMPATIBLE WITH RFC[25]
- 1000COMPATIBLE WITH RFC[1000]
Contribution made by Stockholm 2022
Background
We used this part in order to produce recombinant intrinsic factor (IF), a protein central to the iGEM Stockholm 2022 project. In order to do this, we cloned together this part with our part coding for IF and proceeded to produce and attempt to purify the recombinant IF
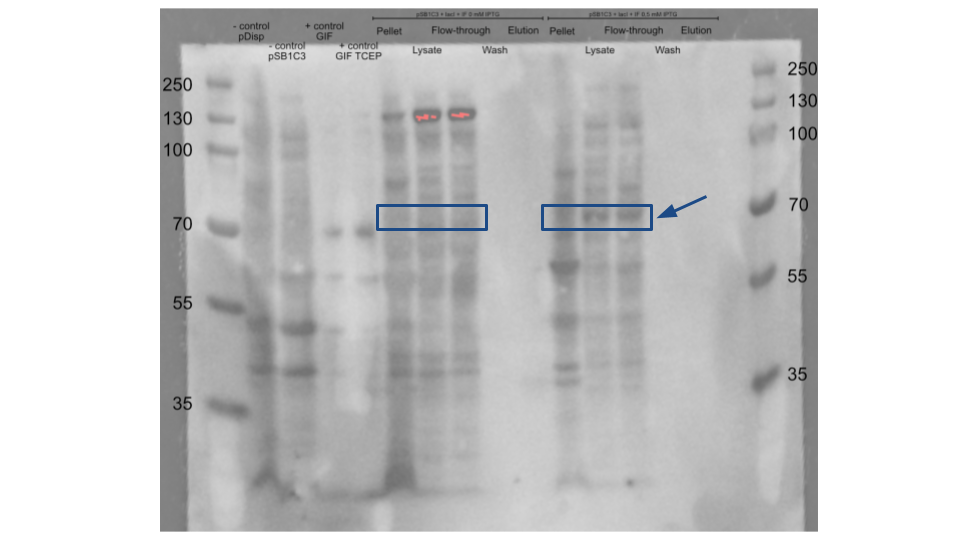
Induction is confirmed at 0.5 mM IPTG vs 0 mM IPTG
As a negative control we used the pDisplay™ mammalian expression vector and the pSB1C3+LacI without the wtIF. A recombinant Gastric Intrinsic Factor protein (From Sinobiological:Cat: 13544-H08H) was used as a positive control for migration size and antibody binding. After the induction of the protein expression with IPTG, we purified our protein using HisPure Cobalt Resin. During the purification we collected the cell pellet, the flow through and the eluted part of the purification column. We loaded all of our samples in the SDS-page and followed it with a Western Blot. We used the Intrinsic Factor Rabbit primary antibody (1:100) and Anti-Rabbit HRP(1:5000) as a secondary antibody. The wtIF expression was seen at the inducer concentration of 0.5 mM and not at 0 mM. The wtIF is detected around 55-70 kDa in the Lysate and Flow-through of the 0.5 mM IPTG samples but not in the Eluted parts of the purification. This suspected size range is based on the positive control.
Documentation made by ICJFLS 2021
The effect of IPTG on the J04500
J04500 is a composite part containing R0010 and B0034. It is a LacI regulated promoter with RBS. This part is an inverting regulator sensitive to LacI and CAP. It contains two protein binding sites. The first site can bind with CAP protein, which is generally present in E. coli and is associated with cell health and availability of glucose. Binding with CAP can promote the expression of its downstream genes. The second site binds with LacI protein, which negatively regulate the downstream genes. LacI is the coding repressor protein in E. coli. This repression of LacI can be removed by IPTG, which means the IPTG disable the binding of LacI to the promoter, so as to induce the expression of downstream genes.
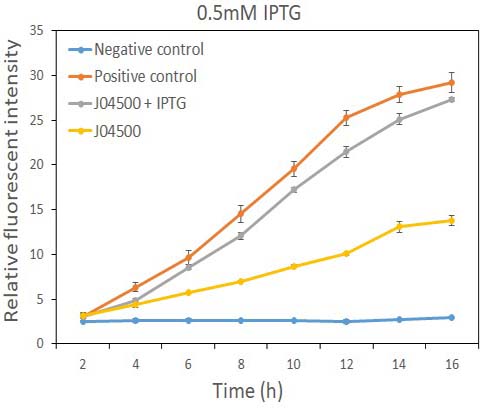
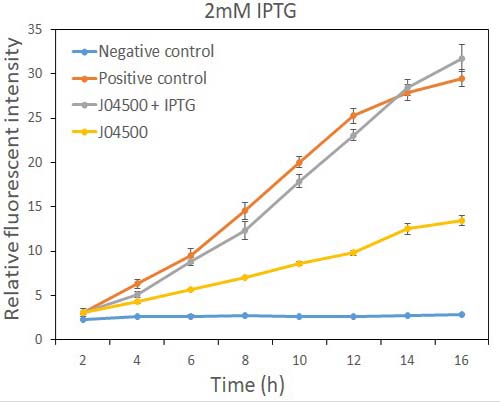
In order to test the inhibition efficiency of LacI and the induction of IPTG to this part, we connected E0040 and B0015 parts with the J04500 together. Then we test the GFP expression with and without IPTG presence. The data are showed in Fig.1 and Fig.2.
Fig.1 the GFP expression with and without IPTG (0.5mM) presence in E. coli.
Fig.2 the GFP expression with and without IPTG (2mM) presence in E. coli.
As the data suggest, this promoter is an IPTG inducible promoter in E. coli. There is distinct difference in signals with or without IPTG induction. As expected, under IPTG induction, there is about 3-fold increase in GFP signals compared to those without IPTG presence. However, we can still find the leaking expression, compared with the negative control in E. coli.
This part is incompatible with species containing active LacI coding regions. However, our experiment showed that it can initiate the transcription of downstream genes in E. coli even if there is no IPTG presence, possibly because that the LacI expressed in the cells is not sufficient for repression this promoter. GFP have some leakage expression without the presence of IPTG.
Contribution made by Aix-Marseille 2021
IPTG doesn't induce gene transcription in the E.Coli DH5a strains
For the goods of our project, we designed a plasmid by cloning BBa_K3788013 in BBa_J04500 ; and transformed it into DH5a E.Coli competent cells.
As we can see green colonies on LB+Agar plates without IPTG induction, we wanted to test if IPTG induction would enhance fluorescence level.
To test the ability of the promoter to be induced by IPTG, we made bacterial liquid cultures containing BBa_J04500+BBa_K3788013 and bacteria containing BBa_J04500. We then incubated our cultures with different concentrations of IPTG for 3 hours.

Table 1. IPTG quantities added to our cultures.
After induction, we measured fluorescence intensity for each condition diluted at different 600OD :

Figure 1. fluorescence intensity obtained for each induction condition. sf : bacteria containing BBa_J04500+BBa_K3788013 ; V : bacteria containing BBa_J04500
From this experiment we can conclude that adding IPTG to the growing medium do not affectate the fluorescence intensity, so we concluded that it doesn’t enhance the protein production.
An hypothesis could be that the cellular LacI quantity is not sufficient to repress the gene transcription ; or that the promoter is not responding to repression and so can’t be induced by IPTG.
Glucose can repress gene transcription
As we didn’t observe any difference due to IPTG induction we decided to test the glucose repression.
To test the ability of the promoter to be repressed by glucose, we made bacterial liquid cultures containing BBa_J04500+BBa_K3788013.
We then incubated our cultures with different concentrations of glucose and measured fluorescence intensity every 60 minutes.

Table 2 :. glucose concentration added to our cultures. explication

Figure 2 :. fluorescence intensity obtained at 0 ; 60 ; 120 and 170 minutes for each condition.
As we can see, the samples with the highest glucose concentration had a lower fluorescence intensity at all times.
Therefore we can conclude that glucose repression of BBa_J04500 is functional.
From the experiments we made, we propose that BBa_J04500 can’t be used as an IPTG inducible promoter in E.Coli DH5a strains, but can be glucose-repressed to control the protein production.
An idea for the next contribution of BBa_J04500 could be to characterize more precisly the glucose repression by determining how long the repression is in different conditions to learn how to use the glucose repression capacity of this part.
Comparison with the Documentation made by ICJFLS 2021
While adding our contribution to this part’s page, we were very interested to see that iGEM ICJFLS 2021 team also chose to work on the characterization of BBa_J04500.
Surprisingly, they found out that the promoter responded to IPTG addition, which seems to be in opposition with our own results. We hypothesize that this could be linked to the use of different E. coli strains in the two teams. We used DH5alpha for our experiments, while the strain used by ICJFLS-2021 team is not specified.
Some E. coli strains (like BL21(DE3)) have a LacIq genotype, which leads to the overexpression of the LacI repressor, and might have a tighter regulatory effect on BBa_J04500 than the DH5alpha strain.
In conclusion, the work done by ICJFLS-2021 team and ourself show that more experiments are needed in order to characterize how the promotor behaves in different E. coli genetic backgrounds.
Contribution made by SHSID 2020
Recombinant FnCpf1 production, purification, and SDS-PAGE analysis
The backbone for BBa_K3521005 was derived from pET-28a vector. The recombinant plasmid was transformed into BL21 (DE3) competent cells and induced with IPTG. After induction, a specific protein band that is consistent with the theoretical molecular weight of FnCpf1 was detected in SDS-PAGE (Figure 2). The recombinant FnCpf1 was successfully purified by Ni-affinity chromatography.

//plasmidbackbone/expression/inducible
| None |


