
Part:BBa_K5045005
AεB ATP sensor
AεB (Aquamarine-epsilon-mBaojin) ATP sensor protein consists of three major components: the Aquamarine donor fluorescent protein (BBa_K5045002), the epsilon ATP-binding domain (BBa_K5045001)that is responsible for the specific recognition and binding of ATP molecules, and the mBaojin acceptor fluorescent protein (BBa_K5045003) that provides the fluorescence signal. FRET (Förster resonance energy transfer) is the mechanism by which sensor AεB reflects ATP levels through color changes. The Aquamarine donor, initially in its excited electronic state, may transfer energy to the mBaoJin acceptor through nonradiative dipole-dipole coupling. The efficiency of this energy transfer is inversely proportional to the sixth power of the distance between donor and acceptor, making FRET extremely sensitive to small changes in distance. When ATP binds with the epsilon subunit, the subunit conformational changes occur, causing mBaoJin and Aquamarine to approach each other, so the FRET efficiency increases significantly, and color changes from dark blue to green. The strength of fluorescence changes as the concentration of ATP in the environment changes, as the number of ATP bound ATP sensors changes. By detecting changes in the fluorescence signal, we can monitor the ATP levels in cells in real-time. Further, we can measure the data quantitatively. In this project, we constructed an AεB (Aquamarine-epsilon-mBaojin) ATP sensor plasmid. We inserted the target fragment encoding the AεB ATP sensor into digesting sites of NheI and BamHI in the pCDH-CMV vector by molecular cloning technique. It needs to be inserted into plasmids to be produced in prokaryotic cells or inserted into plasmids and then integrated into cell genomes through lentiviral vectors. We suggest people use A and pCDH-CMV(Addgene #72265) for two purposes separately.
Overview
ScanCer can perform both high-throughput screening and cell-based validation, detecting cellular ATP levels through optical signals to assess the effects of drugs on cell viability. This system is easy to operate, highly sensitive, and has higher luminescence efficiency. In addition, we can verify cellular function, as the proteins emit fluorescence under laser irradiation, enabling fluorescence microscopy to observe the subcellular distribution and levels of ATP. This allows for further functional analysis within the cells.
Our team has improved the FRaPPe system, a FRET-based system developed by the iGEM 2020 team at IISER Berhampur. Compared to their system, “Scancer” has greater FRET efficiency, because the mBaojin-aquamarine pair has greater Förster radii which enhances the overall efficiency of FRET systems. Moreover, “Scancer” has greater sensitivity and signal strength, allowing better detection of weak protein-protein interactions. “Scancer” has The emission spectra of the donor and acceptor remain distinct, minimizing spectral interference and making it easy to distinguish the FRET signal from the donor and acceptor fluorescence.
Choosing a FRET Fluorescent Protein Pair
High-throughput screening (HTS) provides starting chemical matter in the adventure of developing a new drug. It allows one to test thousands of samples of a very small volume in order to identify potential lead compounds in drug discovery and it is one of the strategies used to discover starting compounds for small-molecule drug-design campaigns. In this review, we identified HTS methods used today for hit identification, organized into two main flavors: biochemical and cell-based assays.
Due to the significant role that HTS plays in drug development, we selected the cell-based assays of HTS as our method for drug screening. We chose FRET to detect the formation/inhibition of protein-protein interactions in cells. FRET is a non-radiative energy transfer that occurs by dipole-dipole coupling from an excited state donor fluorophore to a ground state acceptor (another fluorophore or a quencher) when appropriate spectral overlap and proximity requirements are satisfied. The restrictions are so minimal for FRET that it can be measured within a living cell, and often with only benchtop equipment. FRET assays and sensors are very powerful because they offer real-time, in situ detection without any intervention. As a result, we chose FRET as a method of cell-based assays.
Our team referenced the FRaPPe system developed by team iGEM 2020 from IISER Berhampur, which utilizes a coupled FRET-CID approach to detect protein-protein interactions (PPIs) by using a CID reporter gene to ensure that the interaction occurs, while a FRET reporter gene measures the extent of the interaction, and by observing The efficiency of peptide inhibitors is assessed by changes in the emission spectra of receptor fluorophores, thus opening up the possibility of a high-throughput screening system for drugs that inhibit these interactions in vitro. Their team used ECFP-EYFP as a FRET fluorescent pair for the experiment.
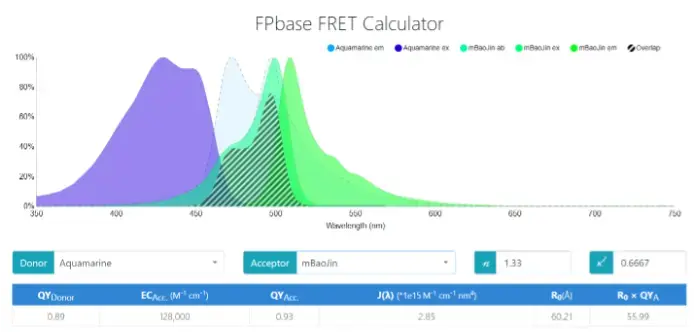
Figure 1. FRET protein pairs were screened through FBbase FRET Calculator

Figure 2. EYFP-EYFP donor-acceptor pair by FPbase FRET calculator
We utilized a number of proteins, and eventually, we selected two newly developed proteins: Aquamarine as the donor and mBaoJin as the acceptor. Aquamarine is a basic (constitutively fluorescent) cyan-fluorescent protein published in 2013, derived from Aequorea Victoria. Its pKa is 3.3, indicating very low acid sensitivity and good stability in different pH environments (Mol. BioSyst., 2013, 9, 258) mBaoJin is a basic (constitutively fluorescent) green fluorescent protein published in 2024, derived from Cytaeis uchidae. It is reported to be a very rapidly maturing monomer with low acid sensitivity.
Compared to using ECFP-EYFP as a FRET fluorescent pair, visualization of ATP concentration using mBaoJin-Aquamarine FRET fluorescence pairs would be a more efficient and effective method for drug screening.
According to the data in the figure, the quantum yield (QY) of Aquamarine is 0.89, which is significantly higher than that of ECFP, which is 0.40. The higher QY indicates that the donor Aquamarine is able to emit photons more efficiently upon excitation, resulting in a stronger fluorescence signal. This property makes the FRET signal more prominent and helps to increase the sensitivity of the experiment, especially when detecting weak interactions.
The Förster radius (R₀) of the EYFP-EYFP donor-acceptor pair is 47.51 Å. However, the Förster radius of the Aquamarine-mBaoJin pair is 60.21 Å. Larger values of R₀ usually mean that the donor and acceptor can be kept at a greater distance from each other while still efficiently transferring energy. This directly affects the FRET efficiency. Specifically, larger R₀ values help to increase the likelihood of energy transfer, which in turn improves the strength and reliability of the signal.
As can be seen from the specifics in the figure, the Aquamarine-mBaoJin system has a clear advantage in quantum yield and absorption coefficient, which leads to higher excitation and emission efficiencies, as well as a better signal-to-noise ratio due to smaller spectral overlap. These features allow the mBaoJin-Aquamarine system to obtain clearer and more accurate signals in FRET experiments.
Moreover, the emission spectrum of Aquamarine significantly overlaps with the excitation spectrum of mBaoJin, as shown in the graph, the spectral overlap integral value is 2.85 × 10⁻¹⁵ cm⁶ nm⁴, which is high, indicating that a substantial portion of the donor’s emission falls within the acceptor’s range. This number is a key determinant of FRET efficiency. Moreover, the Förster distance is 60.21Å, representing the distance at FRET efficiency is 50%. Additionally, compared to the traditional FRET pairs, such as CFP-YFP, the overlap for mBaoJin and Aquamarine is more extensive, suggesting that this pair may produce stronger FRET signals. At the same time, the emission spectra of the donor and acceptor remain distinct, minimizing spectral interference and making it easy to distinguish the FRET signal from the donor and acceptor fluorescence.
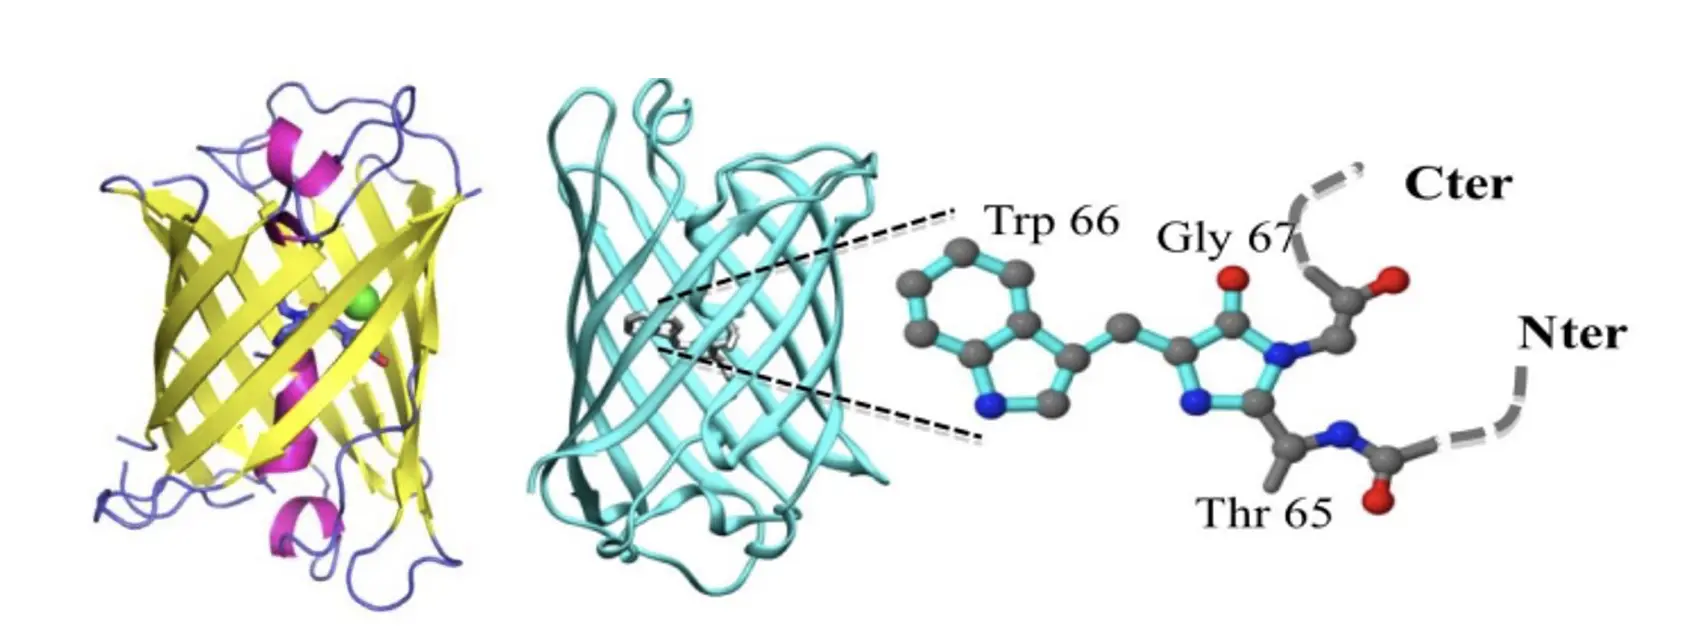
Figure 3. Visualization of the protein structures of mBaoJin (left) and Aquamarine (right)
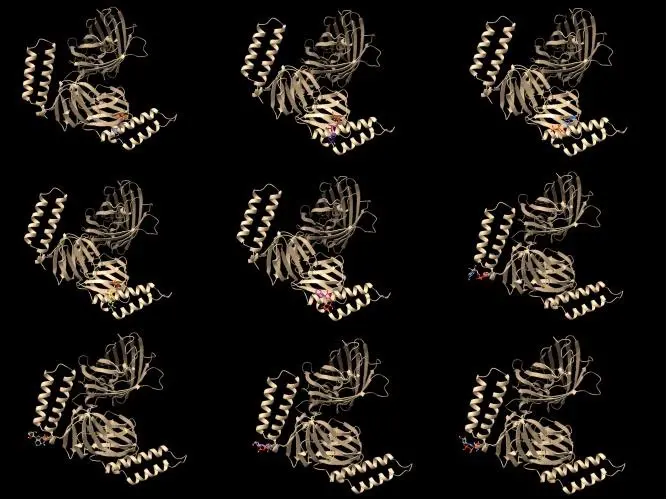
Figure 4. Simulating FRET protein pairs
Acquiring Target Genes
Protein sequences of two fluorescents were taken from FPbase: Aquamarine (FPbase 963OH) and mBaoJin (FPbase 4XHVQ). Sequence for epsilon subunit was chosen from modified Bacillus subtilis FoF1 ATP synthase in Nano-lantern_ATP1 from 462 to 597 (NCBI AFQ60642.1) slightly modified (597L replaced by F). The nucleotide sequence was designed based on the three protein sequences in the order of Aquamarine-epsilon-mBaoJin, ensuring that no restriction enzymes NheI and BamHI digestion sites are present. After de novo synthesis of the nucleotide sequence, two primers were designed to add digestion sites of NheI and BamHI to the ends separately using PCR (Polymerase Chain Reaction) for its later insertion into the plasmid.
Figure 5. ATP sensor sequence

Figure 6. The result of the PCR experiment
Amplifying and Extracting Vector Plasmids
Amplification vector plasmid is a key step in genetic engineering for inserting the target gene into the host cell for expression. In this process, we chose the pCDH plasmid vector, which is a commonly used lentiviral vector suitable for stable gene expression.
We retrieved this vector from the laboratory. The plasmid was transformed into competent E. coli (commonly used transformation methods include heat-excited transformation and electrotransformation). The transformed bacteria are inoculated on a selective agar LB medium containing antibiotics, and the monoclonal colony strain containing the recombinant plasmid is selected. After that, the chosen colony was amplified in an LB medium containing antibiotics in a shaking incubation at 37°C for 16 h. After amplifying the plasmid, our team decided to extract the plasmid vector. The extracted plasmid is further verified by enzyme digestion, PCR, or sequencing to see if it contains the correct insert fragment.
We performed viral packaging of the extracted plasmids to construct lentiviruses, which were used to stably infect cells for expressing the ATP probe. We produced viruses by transfecting plasmids that, together, provide all the necessary components for vector particle production. However, the genome plasmid does not encode all, or even any, viral genes. Thus, the infected cells produce the transgene but no viral genes, making vector production safe with no risk of ongoing viral replication. This level of safety in vector production allows easy manipulation of the viral genes used to make vector particles and the use of the system to express the ATP probe.
Inserting Target Gene Into Vector for Fusion Expression Plasmid Construction
We selected and designed the target gene, ensuring its sequence was suitable for expression. Primers containing enzyme cutting sites were designed for PCR amplification of the target fragment. After confirming the correct product size via agarose gel electrophoresis, the target gene was purified. The vector and target fragments were digested with restriction enzymes and then ligated using T4 DNA ligase. The ligated product was transformed into E. coli cells, which were heat-shocked and cultured on LB agar plates. Finally, plasmids were extracted, sequenced to verify successful insertion, and amplified for further use.
We utilized lentiviral vectors, a type of viral vector derived from HIV (Human Immunodeficiency Virus), which is a retrovirus with an RNA genome. The viral pathogenic genes have been removed and replaced with the exogenous target gene Aquamarine-ε-mBaoJin, making it a pseudotyped virus. After the lentiviral genome enters the cells, it undergoes reverse transcription into DNA, forming a pre-integration complex, which enters the nucleus and integrates into the host cell's genome. The integrated DNA is then transcribed into mRNA, which is translated into the target proteins Aquamarine and mBaoJin in the cell. The gene expression or RNA interference mediated by lentiviruses is stable and continuous, propagating along with the host cell genome during cell division.
The packaging system we used includes one transfer plasmid and one packaging plasmid (Aquamarine-ε-mBaoJin), which were co-transfected into packaging cells. Inside the cells, the transfer plasmid transcribes the HIV RNA genome carrying the target gene, which, together with the capsid proteins, enzymes, and regulatory proteins expressed by the packaging plasmid, assembles into viral particles. These particles are then transported to the inner side of the cell membrane, forming enveloped viruses that are secreted into the extracellular space. After a short incubation, the supernatant was collected, centrifuged to remove cell debris, filtered, and further concentrated using the PEG8000 concentration method, which effectively increases the yield and titer of the lentivirus.
The concentrated lentivirus was added to target cells for infection. After infection, stable clones expressing the exogenous gene were selected using puromycin, as the infected cells carry the puromycin resistance gene, allowing for selection with the antibiotic.
Viral Packaging and Viral Infection
We prepared a polystyrene-containing culture medium. Cells at 50% confluence were infected with 200 μL of virus suspension and incubated at 37°C with 5% CO₂. After 12 hours, the medium was replaced, and cells were maintained in a fresh culture medium. At 36 hours post-infection, we added puromycin (1.5 μg/mL) to select successfully infected cells. After 24 hours of puromycin treatment, infection success was confirmed under a microscope, and the cells were further cultured. We successfully completed viral packaging and viral infection through our experiments.

Figure 7. Detected sequence of Aquamarine in SnapGene
We used SnapGene to detect an Aquamarine sequence, confirming the successful insertion of AεB into the plasmid and validating the accuracy of the prior plasmid amplification.
We successfully completed the plasmid construction and viral transduction, achieving the expression of ScanCer, and are now ready to proceed with the next stage of experiments.
Validating Drug Screening on Infected Cells
After successfully constructing ATP-probe-expressing cells, we validated them for drug screening and aimed to identify active small molecule compounds through the drug screening system we developed, which could potentially be further investigated in the future.
We adopted high-throughput screening (HTS) to screen anti-cancer drugs. Compounds for screening were obtained from the MCE compound library, specifically the MCE Novel Known Bioactive Compound Library (1,220 compounds). The MCE compound library consists of small molecules with validated biological and pharmacological activities, making it suitable for our project.
Additionally, we adopted the Drug Virtual Screening method to further validate the accuracy of our drug screening and the practicality of our established drug screening system. Virtual screening is a computational method used to identify potential drug candidates from large compound libraries. By using virtual screening, researchers can efficiently narrow down a vast number of compounds to those most likely to have therapeutic potential, accelerating the drug discovery process and reducing the need for extensive experimental testing.
Our high-throughput drug screening experiments were conducted in the laboratory, with the assistance of researchers and a Zhongxi Biological SC9210 fully automated pipetting workstation. By using the MCE compound library, all compounds were dissolved in 100% DMSO or water. Prior to the experiment, we prepared the compounds to be pre-diluted to 1 mM stock solutions.
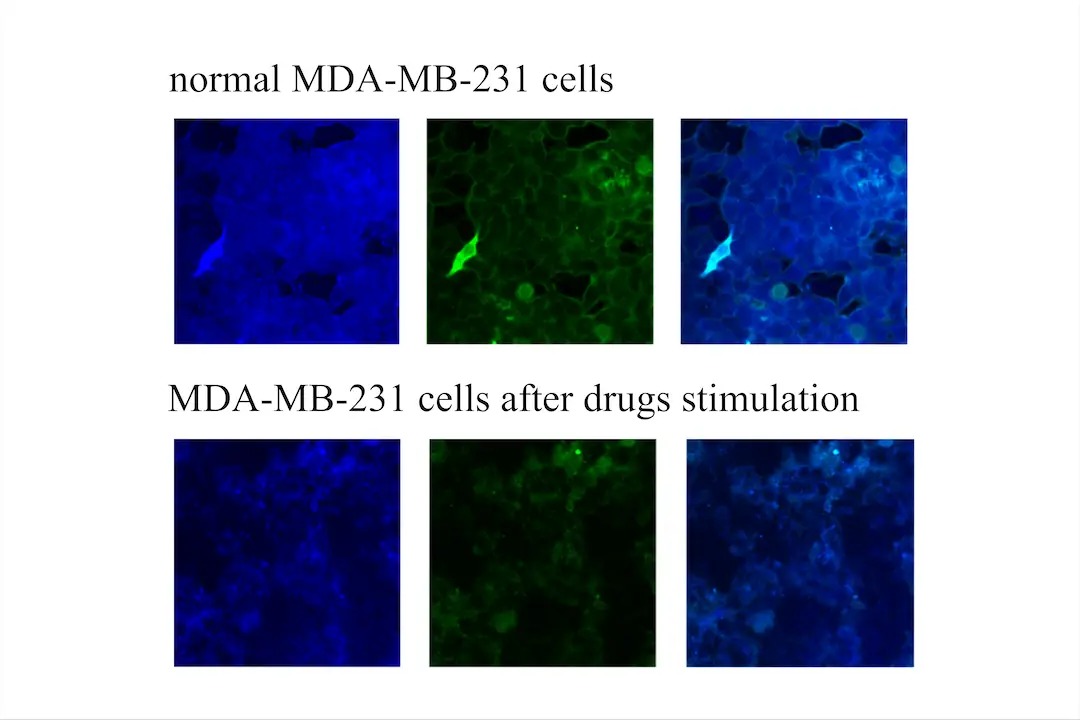
Figure 8. Verifying ScanCer's effect with a Revvity high-content analyzer

Figure 9. The relative fluorescence ratio of the cells with ScanCer
We used the Revvity high-content analyzer to measure the fluorescence intensity of MDA-MB-231 cells under normal conditions and after drug stimulation, utilizing the ScanCer technology we developed. It is evident that the fluorescence intensity of MDA-MB-231 cells after drug stimulation is significantly lower than under normal conditions (Figure 8). Using ImageJ, we selected four fields of view for statistical analysis of fluorescence intensity, revealing substantial changes (Figure 9). This confirms that the ScanCer system we developed is a highly sensitive tool for drug screening.
HTS and In Vitro Tumor Suppression Validation
The cells used for screening included MCF-10A normal mammary epithelial cells and MDA-MB-231 triple-negative breast cancer cells. The cells were seeded in 96-well culture plates, with a density of approximately 5,000 cells per well, in a total volume of 100 µL medium. After 24 hours of cell adhesion, 1 µL of each compound from the library was automatically added to the culture medium in the 96-well plates using the four-dimensional modular automation handling platform, resulting in a final drug concentration of 10 µM.
We set the negative control as the 10 µM pure DMSO group, and the positive control as the 10 µM cisplatin group. After 48 hours of drug treatment, the medium in the wells was discarded, ATP detection reagent was added, and luminance was measured using a microplate reader, or the effectiveness of ATP probes was assessed using a Revvity high-content analyzer.
During our high-throughput drug screening experiment, we conducted a standardized comprehensive screening (screening all 1,220 compounds). From this experiment, we identified 15 small-molecule compounds. These small molecules did not reduce the viability of normal mammary epithelial cells (MCF-10A) to below 80% (Above the red dotted line perpendicular to the Y-axis in the Figure 7), while reducing the viability of breast cancer cells (MDA-MB-231) to below 30% (To the left of the red dotted line perpendicular to the X-axis in Figure 6).
2-(1-Aziridinyl)ethanol 4-Methyl-1 H-indazole 2-(2-Nitrophenyl)ethanol 2-Cyano-N-ethylacetamide Oct-1-yn-3-ol N, N-Dimethylpiperidine-4-carboxamide hydrochloride Methyl-3-(4-hydroxyphenyl)propionate 7,8-Difluoroquinoline 1,3-Dicyclohexylthiourea 2,2,2-Trimethylacetophenone N-(2-Methyl-4-oxopentan-2-yl)acrylamide 2-(1H-Pyrrol-1-yl)aniline 1,10-Phenanthroline monohydrochloride monohydrate 6,7-Dihydro-3H-cyclopenta[4,5]thieno[2,3-d]pyrimidine 1-Phenylindoline-2,3-dione
After conducting another round of standardized drug screening, we performed multiple validations from the MCE Novel Known Bioactive Compound Library by subjecting them to high-throughput drug screening. This time, we identified two small-molecule compounds: 6,7-Dihydro-3H-cyclopenta[4,5]thieno[2,3-d]pyrimidin-4(5H)-one and 1,10-Phenanthroline monohydrochloride monohydrate.
Since 6,7-Dihydro-3H-cyclopenta[4,5]thieno[2,3-d]pyrimidin-4(5H)-one (12F4) has demonstrated stable anti-tumor effects, our team conducted cellular functional validation using this drug. The result showed that 12F4 had relatively low toxicity in normal breast epithelial cells, while it exhibited stronger toxicity in breast cancer epithelial cell lines.
References
Algar, W. R., Hildebrandt, N., Vogel, S. S., & Medintz, I. L. (2019). FRET as a biomolecular research tool—understanding its potential while avoiding pitfalls. Nature methods, 16(9), 815-829.
Borst, J. W., Willemse, M., Slijkhuis, R., van der Krogt, G., Laptenok, S. P., Jalink, K., Wieringa, B., & Fransen, J. A. M. (2010). ATP changes the fluorescence lifetime of cyan fluorescent protein via an interaction with His148. PLOS ONE, 5(11), Article e13862. https://doi.org/10.1371/journal.pone.0013862
Chakraborty, S., Bhaskaran, G., Vinayak, S., Senapati, H. K., Bhowmik, C., Pradhan, S., ... & Biswas, S. Team: IISER Berhampur/Poster Poster: IISER_Berhampur.
FPbase FRET Calculator. Retrieved from https://www.fpbase.org/fret/.
Felber, L. M., Cloutier, S. M., Kündig, C., Kishi, T., Brossard, V., Jichlinski, P., … Deperthes, D. (2004). Evaluation of the CFP-substrate-YFP system for protease studies: advantages and limitations. BioTechniques, 36(5), 878–885. https://doi.org/10.2144/04365PT04.
Hellenkamp, B., Schmid, S., Doroshenko, O. et al. Precision and accuracy of single-molecule FRET measurements—a multi-laboratory benchmark study. Nat Methods 15, 669–676 (2018). https://doi.org/10.1038/s41592-018-0085-0
Huang, C. C., & Liu, M. (1994). An improved method for the determination of protein concentrations using 1,2,4-benzenetricarboxylic acid. Analytical Biochemistry,221(2), 228–230https://doi.org/10.100/abio.1994.113
Komatsubara, A., Matsuda, M. & Aoki, K. Quantitative analysis of recombination between YFP and CFP genes of FRET biosensors introduced by lentiviral or retroviral gene transfer. Sci Rep 5, 13283 (2015). https://doi.org/10.1038/srep13283
Lay, V., Tolani, B., Ho, S. P., & Arkin, M. R. (2020). High-throughput screening: today’s biochemical and cell-based approaches. Drug Discovery Today, 25(10), 1807-1821.
Tsujimoto, Y. (1997). Apoptosis and necrosis: intracellular ATP level as a determinant for cell death modes. Cell Death & Differentiation, 4(6), 429-434.
Sequence and Features
- 10COMPATIBLE WITH RFC[10]
- 12COMPATIBLE WITH RFC[12]
- 21COMPATIBLE WITH RFC[21]
- 23COMPATIBLE WITH RFC[23]
- 25COMPATIBLE WITH RFC[25]
- 1000COMPATIBLE WITH RFC[1000]
| None |