Part:BBa_K3521005
pT7-FnCpf1-His tag
This part is the core element of FnCpf1 protein expression. The method of use is to add IPTG to induce the expression of FnCpf1 protein in E. coli BL21 (DE3). FnCpf1 protein was purified in vitro with a nickel column, and then used to target and cleave specific DNA sequences mediated by gRNA to make it fluorescent.
Sequence and Features
- 10COMPATIBLE WITH RFC[10]
- 12INCOMPATIBLE WITH RFC[12]Illegal NheI site found at 1784
Illegal NheI site found at 3504 - 21INCOMPATIBLE WITH RFC[21]Illegal XhoI site found at 3565
- 23COMPATIBLE WITH RFC[23]
- 25COMPATIBLE WITH RFC[25]
- 1000COMPATIBLE WITH RFC[1000]
Contribution
BBa_K3521005 is a composite part that consists of T7 promoter, single RNA-guided endonuclease FnCpf1, and polyhistidine tag. It was designed to produce recombinant FnCpf1. The N-terminal His tag was used to Ni-affinity purification of FnCpf1.
Engineering Success
The BBa_K3521005, the composite part of single RNA-guided endonuclease FnCpf1, and polyhistidine tag was designed to detect Listeria monocytogenes. The experiments and results of functional tests were listed as follows:
Recombinant FnCpf1 production, purification, and SDS-PAGE analysis. The backbone for BBa_K3521005 was derived from pET-28a vector. The recombinant plasmid was transformed into BL21 (DE3) competent cells and induced with IPTG. After induction, a specific protein band that is consistent with the theoretical molecular weight of FnCpf1 was detected in SDS-PAGE (Figure 1). The recombinant FnCpf1 was successfully purified by Ni-affinity chromatography.

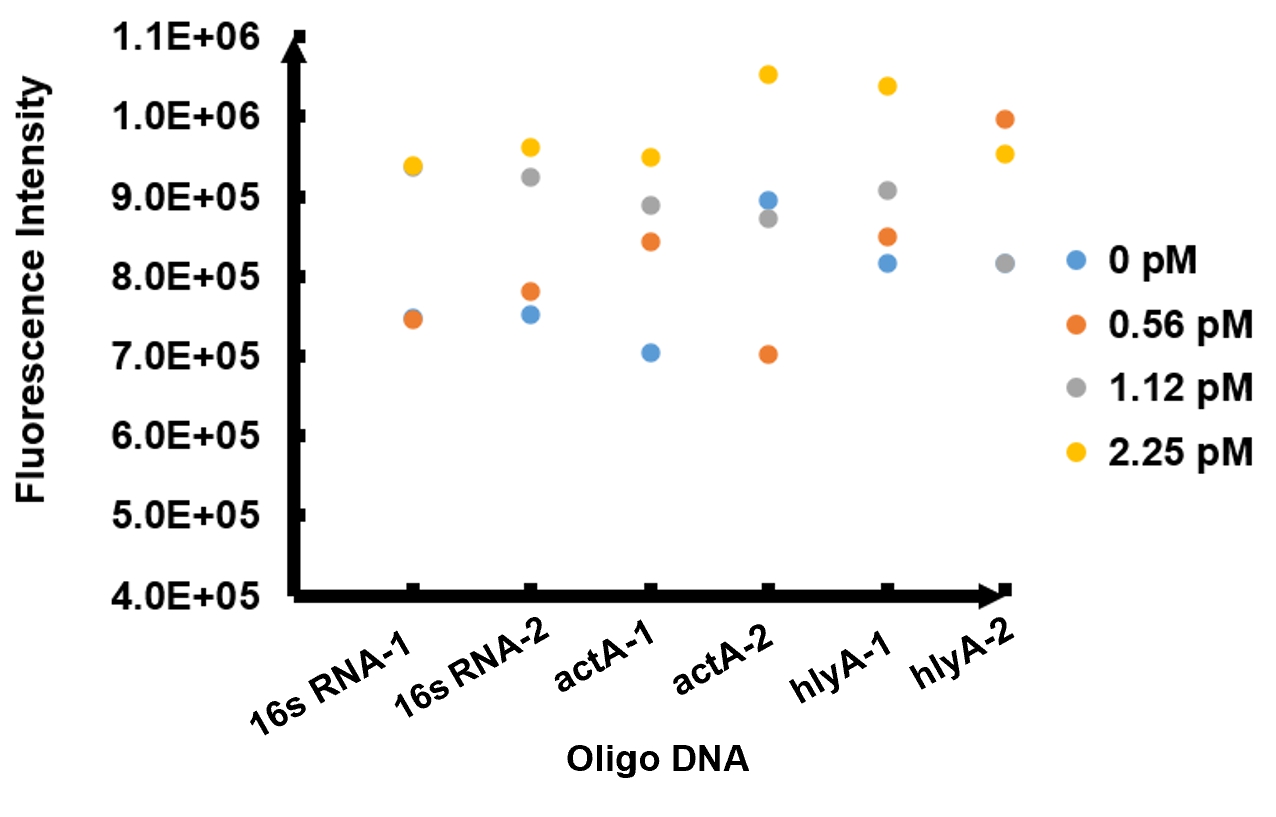
Enzymatic activity of FnCpf1 and its application for Listeria monocytogenes detection A reaction system consisting of recombinant FnCpf1, crRNA, and ssDNA was applied to detect Listeria monocytogenes. The reaction system was incubated at 37℃ for 10 minutes then the value of fluorescence intensity was measured by microplate reader. The model number of our microplate reader is MD Spectra Max i3x with emission wavelength at 522nm and absorbing wavelength at 494nm. The results of fluorescence intensity for all the six oligo sequences simulated Listeria monocytogenes are shown in Figure 2. The oligo DNA 16s RNA-2, actA-1, and hylA-1 are the only ones that show distinct fluorescence intensity at different concentrations. At the same time, they show a ubiquitous rising trend of fluorescence intensity with an increasing concentration, which is consistent with logic. Therefore, we choose to give a more detailed and specific analysis of these three groups. The results of our further analysis are presented in Figures 2 - 4.
The fluorescence intensity all displays an increasing trend when the concentration of oligo DNA increases in Figures 2 - 4. The system can detect the oligo sequence at a concentration as low as 0.56 pM.
As shown in Figure 3, when 16s RNA-2 is used as the oligo sequence, the fluorescence intensity is positively related to oligo concentrations. When the concentration of oligo DNA increases from 0.56 pM to 2.25 pM, the fluorescence intensity increases drastically from 7.82x10^5 to 9.61 x10^5.
Figure 4 demonstrates the increasing trend of fluorescence intensity according to an increase in the concentration of actA-1. The trend follows a generally linear line with intensity being 8.90 x 10^5 at a concentration of 1.12 pM and 9.48 x 10^5 at 2.25 pM.
In figure 5, the data points of the graph resemble a linear progression. The fluorescence intensity is 8.46 x 10^5 when the concentration of oligo DNA is 0.56 pM, the lowest concentration we tested. The fluorescence intensity is the highest corresponding to the lowest concentration of oligo DNA among all three samples. After this, the fluorescence intensity is 9.08 x 10^5 and1.04 x 10^6 when the concentration of hlyA-1 is 1.12 pM and 2.25 pM. At both low and high concentrations, its fluorescence intensity can be used to compare the concentrations of Listeria monocytogenes oligo DNA using the FnCpf1 system. The fluorescence intensity difference between different oligo DNAs demonstrates the highest efficiency for hylA-1 detection among all three samples.
The experiment results above prove the functionality of our reaction system of Listeria monocytogenes detection.
| None |


