Designed by: Jan Lars Kalkowski Group: iGEM20_TU_Darmstadt (2020-10-05)
Laccase CotA
Profile
Name
CotA-Laccase (Spore coat protein A)
Base pairs
1542
Molecular weight
58.51 kDa
Origin
Bacillus subtilis, synthetic
Properties
CotA laccase from B. subtilis is a copper dependant oxireductase with a broad substrate variety of polyphenolic substrates such as diclofenac and ABTS and possess a T1 copper for primary electron transfer to the substrate and a T2/3 Cu-cluster.
Sequence and Features
Assembly Compatibility:
10
COMPATIBLE WITH RFC[10]
12
COMPATIBLE WITH RFC[12]
21
COMPATIBLE WITH RFC[21]
23
COMPATIBLE WITH RFC[23]
25
COMPATIBLE WITH RFC[25]
1000
COMPATIBLE WITH RFC[1000]
CotA Docking
Ligand docking was performed on the laccase CotA (PDB 1GSK). Preparations of the ligand and protein were done as explained on our project wiki. For realization of the docking process we needed a working Rosetta xml script for our purpose. The script we worked out is shown in our Rosetta Guide. With this script, adjusted over many trials, we docked many thousand structures. As output we chose the Rosetta total score and the Rosetta interface score. We plotted these scores against the root-mean-square deviation of atomic positions (RMSD) from the ligand to allow a visible evaluation of the docked structures respectively poses[1]. The formula for calculation of the RMSD is shown below (formula 1).
Formula 1: RMSD formula. Calculation of the RMSD value with the respective Rosetta score function[1].
An interface score against RMSD plot from Diclofenac with CotA is shown in Figure 1. Based on these plots it was easier to identify low energy structures with good interactions with the enzyme. Ideally the data points of these plots should form a funnel like plot. The structures on the closing end are especially good structures. These structures are highlighted with by a red square in figure 1.
Figure 1: Interface score RMSD plot of diclofenac docking with CotA. RMSD values of diclofenac in nm plotted against the Rosetta interface score. Every datapoint represents a single docked structure. The structures highlighted with a red box are especially good structures.
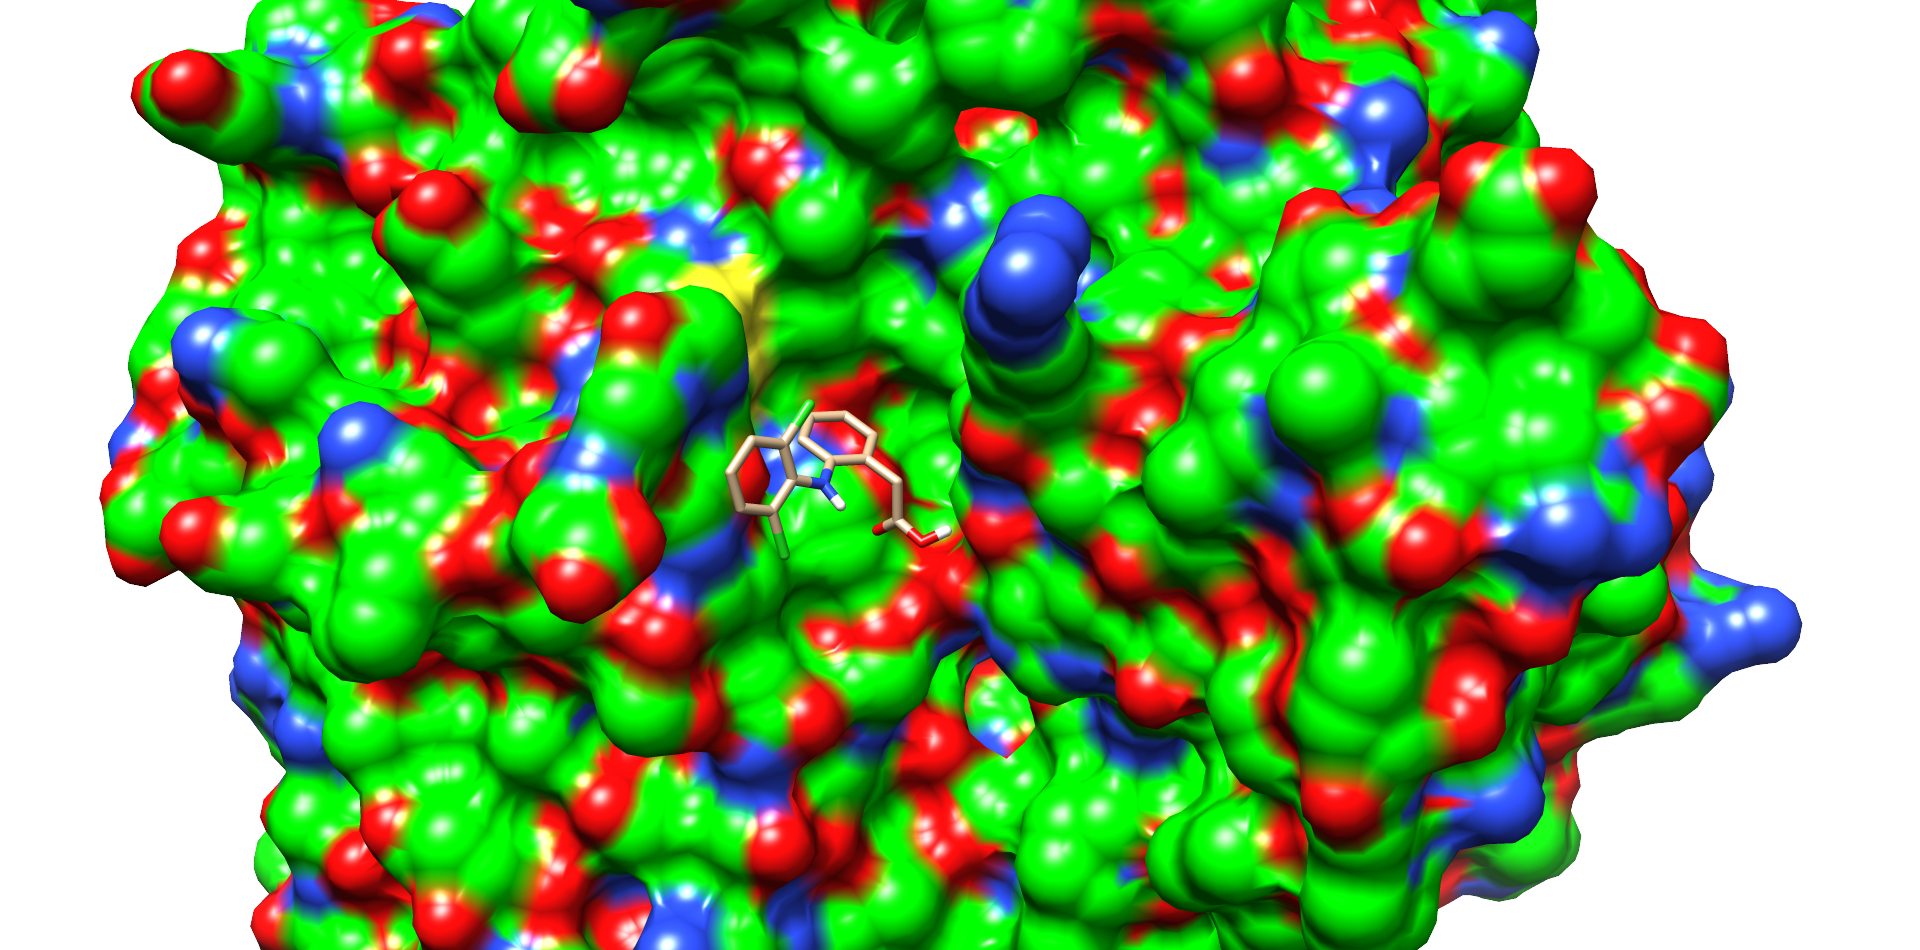
One of these diclofenac structures in CotA is shown in Figure 2. Interestingly, diclofenac was positioned here in a binding channel like structure and not directly near the active copper atom within the active site. This binding channel structure is flanked by two flexible loops of CotA. These loops could undergo a conformational change due to the binding of the substrate, which could hold the substrate in place or even bring it closer to the active site. The most dominant interaction in this model were with the residue’s threonine262 and threonine418. The threonine residues may interact with the secondary nitrogen and the carboxy group of diclofenac.
Figure 2: Diclofenac docking with CotA. One of the best low energy interface score structures of CotA with diclofenac. Residues of the active site and in diclofenac binding involved residues are shown with sticks and colored heteroatoms. Diclofenac binds into a cavity and interacts with T262 and T418.
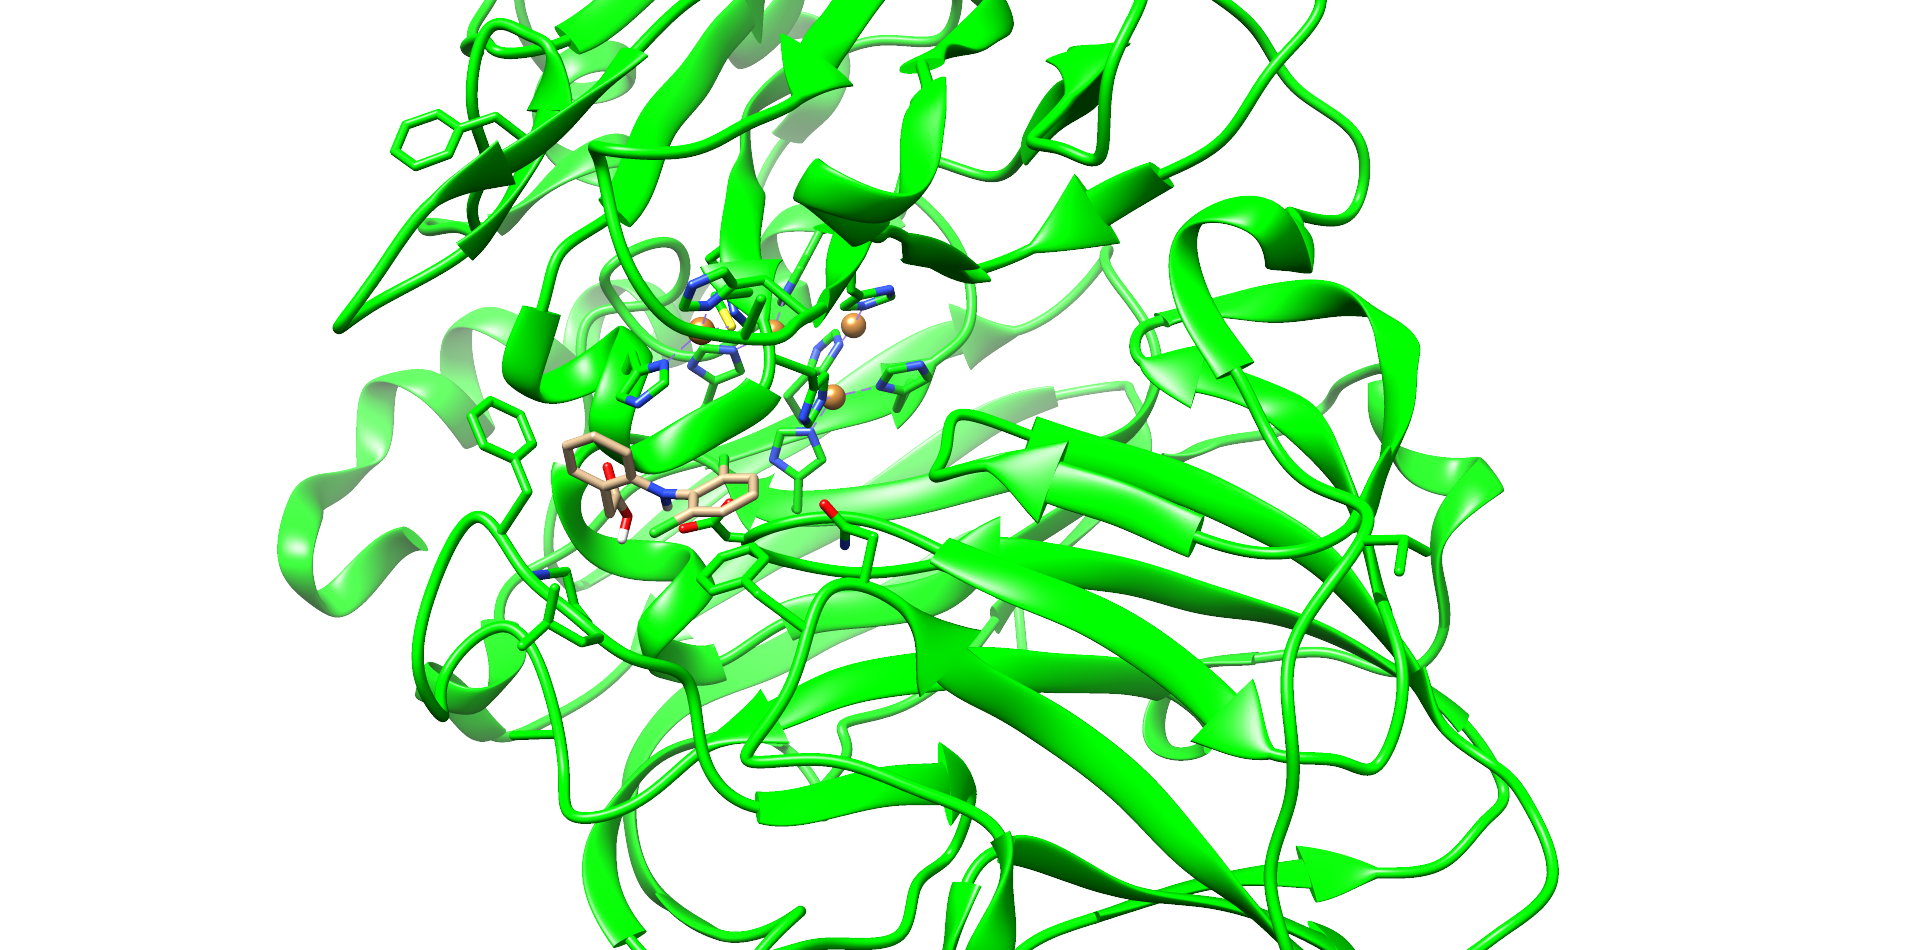
For comparison, the same docking procedure was performed with diclofenac and the laccase of T. versicolor. A structure with top scoring was also selected (Fig. 3). In this model diclofenac binds closer to the active site of the laccase of T. Versicolor. The substance also bound within a cavity of the enzyme and may interact by π-π-stacking with phenylalanine 163. Other interaction with the proline 163 and the carboxy group and aspartate 206 with the secondary nitrogen of diclofenac. The docking with the laccase from T. Versicolor showed more possible interactions and a better positioning of diclofenac near the active site. This assumption was supported by the interface and total score values of both docking experiments (table 2).
Figure 3: Diclofenac docking with the laccase from T. Versicolor. One of the best low energy interface score structures of T. Versicolor laccase and diclofenac. Residues of the active site and in diclofenac binding involved residues are shown as sticks and with colored heteroatoms. Diclofenac binds into a cavity and interacts with P163, F265, D206.
The following table 2 also shows an overview of the different scoring values of the top scored structures from different substrates like 4-Nonylphenol, Ibuprofen and Carbamazepin with CotA. The scoring values of all these substrates were relatively similar. Only the scoring values for the laccase from T. Versicolor were slightly better. But taking into account the positioning of the substance T. Versicolor is the superior laccase.
Table 1: Overview of the best interface and total score values from the docking experiments with CotA und T. Versicolor.
Figure 4. The verification digestions of the pET36b-cotA, pET36b-cueO and pET36b-yak expression constructs. The expression constructs were digested with NdeI and XhoI restriction enzymes. The 1 kb DNA ladder (NEB) was used as a molecular weight standard, the DNA was colored with SyBR Safe DNA Gel Stain (ThermoFisher), and the gel was visualized under UV light. The agarose gel used was 1.2 %.
We transformed E. coli BL21(DE3) cells with pET36b-cotA expression constructs. Three colonies from the strain were analyzed by restriction digestion with NdeI and XhoI. They were true transformants, as seen in the Figure 4. The protein production of the cells was induced by IPTG, the cells were lysed by sonication and His-tagged laccases were extracted with nickel affinity chromatography. The sizes of purified proteins were verified with SDS-PAGE, which showed clear bands around 65 kDa, expectedly corresponding to the calculated size of CotA (Fig. 5). That suggests that CotA was successfully produced by generated E. coli BL21(DE3) strains.
Figure 5. SDS-PAGE of raw extracts and purified enzyme fractions. Bio-Rad Ready Gel® Precast Polyacrylamide Gel was used and the ladder was the PageRuler Unstained Protein Ladder (Thermo Fisher).
Characterization and Results
To measure the laccase activity, we performed a kinetic laccase assay using syringaldazine as substrate. The reaction is based on substrate oxidation which can be spectrophotometrically monitored as signal increase at 530 nm. It was clearly seen that CotA catalyzed substrate oxidation as seen in increasing progress curves (Fig. 6). While the signal of the control remained near the baseline, other progress curve slopes seemed to correlate with the CotA concentrations. The 20 mM reaction profiles using 5 µl of the CotA fraction were identical between graphs, showing that the result was reproducible (Fig. 6A-B).
Figure 6. Representative kinetic activity assays with the purified CotA laccase fractions and syringaldazine measured at 530 nm. A) Reactions with 20 mM syringaldazine and 0 µl (green line), 1 µl (red line), 5 µl (blue line) and 10 µl (purple line) CotA purification fraction. B) Reactions with 5 µl CotA and varying concentrations of the syringaldazine: 0 mM (green line), 5 mM (red line), 20 mM (blue line).
This confirmed that the laccase CotA was catalytically active and capable of oxidizing syringaldazine.