Part:BBa_K2991013:Experience
This experience page is provided so that any user may enter their experience using this part.
Please enter
how you used this part and how it worked out.
Applications of BBa_K2991013
See more results on our wiki page.
I - Testing of the functionality of our designed parts
After transforming K12 MG1655 E.coli with our 6 different constructs, we measured by spectrofluorometry the fluorescence of the transformed bacteria cultivated in M9 medium in the presence of saturating concentration (0.2%) of the associated sugar. The fluorescence studied in the cases below has been normalized with the Optical Density (OD).
Our spectrofluorometric measurements were carried out on the transformed bacteria cultivated in a M9 medium in 2 different conditions : with 0.2% of the specific sugar, and without sugar.
● pLAC-GFP: E.coli:
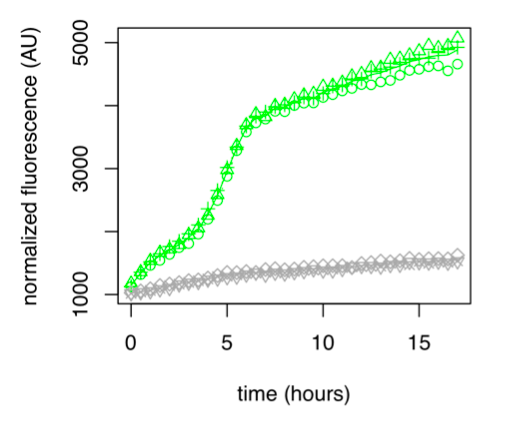
Figure 1: GFP Fluorescence normalized with OD for E.coli K12 MG1655 transformed with pLAC in the presence (green) or absence (grey) of Lactose at 0,2%. Experiments were conducted during 17 hours.
The activity of pLAC is relative to the expression of GFP fluorescence. In the condition without sugar we observe little increase in GFP fluorescence and therefore little activity of the pLAC promoter. This control shows that there is very little promoter activity in the absence of sugar. This validates our control. In the condition where 0.2% lactose was added, we observe significant GFP levels compared to the condition without sugar starting at hour 1. The level of GFP increases linearly over time. The reporter gene is expressed following the activation of the pLAC promoter in the presence of lactose. We observe an increase in GFP during the first 6 hours of the bacterial culture, but from the sixth hour this increase slows down. This verifies the proper functioning of our designed pLAC promoter.
Summary
pLAC is significantly activated in the presence of lactose compared to conditions without sugar, verifying the proper functioning of this part.
II - The link between sugar concentration and promoter activity
For these tests we measured the fluorescence in K12 MG1655 E.coli transformed with each of our 6 constructs. The bacteria were cultivated in M9 medium with various different concentrations of the associated sugar (for simple insert constructs), or associated sugars (for double insert constructs). The fluorescence studied in the graphs below has been normalised with the Optical Density (OD).
● pLAC-GFP E.coli :
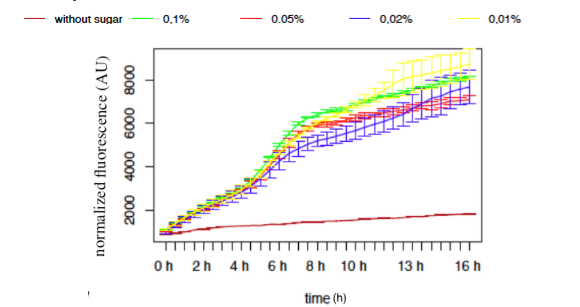
Figure 9: GFP Fluorescence normalised with OD for E.coli K12 MG1655 transformed with pLAC in selected concentrations of Lactose
The activity of pLAC is relative to the expression of GFP fluorescence. We observe a slight increase of GFP fluorescence in the condition without sugar, but the fluorescence level remains relatively insignificant when compared to the fluorescence in conditions where lactose is present. However we do not observe a significant difference of GFP expression between the different conditions containing lactose. The concentration of lactose does not seem to have a significant effect on the activity of our designed pLAC in the simple insert construct. However for this conclusion to be decisive we would need to carry out more experiments with different sugar concentrations
Summary
In our simple insert construct, pLAC, a high level of activation was rapidly reached with a low concentration of it cognate sugars.
III - The specificity of each promoter to their associated sugar
To complete our experiments we tested the promoter activity of the simple insert construct pLAC-GFP, in K12 MG1655 E.coli, in the presence of saturation concentration of different sugars.The primary purpose of these measurements is to confirm already published cross-activation results.
● pLAC-GFP E.coli :
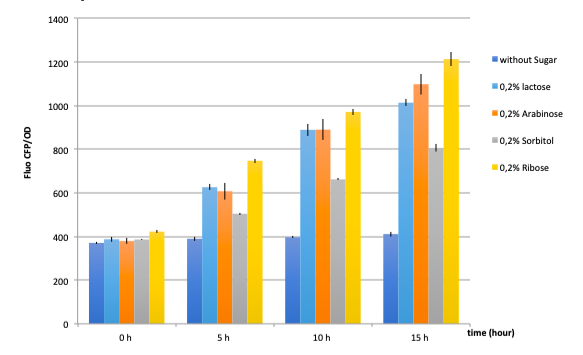
Figure 17: GFP fluorescence normalized with the OD in E.coli K12 MG1655 bacteria transformed with pLAC-GFP construct in the presence of saturating amounts of different sugars
The activity of pLAC is relative to the expression of GFP fluorescence.
In absence of any sugar, we observe no increase of GFP fluorescence during the 15 hours of culture . This validates our negative control.
On the other hand, all tested sugars were able to induce an increase of GFP fluorescence hence activate the pLAC promoter. This corroborates already published results. At this stage we cannot conclude on the differences between the
sugars regarding the fluorescence levels reached after 5, 10 or 15 hours since we did not quantify the amount of proteins and only normalized the data with bacterial growth OD values.
Summary
pLAC seems to be activated by all 4 sugars. These confirm cross-activation data published previously by Guy Aidelberg et al (1).
IV - Binary combinations of sugars with simple and double inserts
Here we tested the activities of single insert with binary combinations of sugars. The tested single insert pLAC-GFP. The primary purpose of this experiment is to analyse the activity promoter in the presence of 2 sugars at a time: it’s own specific sugar and another. We will see if the sugar-hierarchy is still present in our constructions in these conditions, and how a sugar,higher or lower in the hierarchy impacts the expression of the promoter.
● pLAC-GFP E.coli :
As a reminder, here E.coli K12 MG1655 was transformed with pLAC-GFP. We monitored pLAC activity by measuring GFP fluorescence in absence or presence of combinations of sugars. Results are provided below (Fig. 22) .
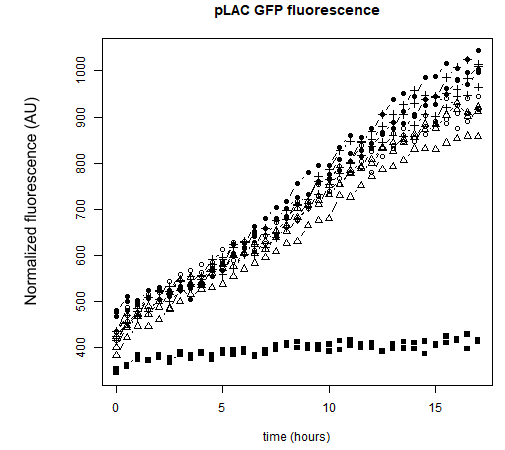
Figure 22: Figure 22. GFP Fluorescence normalized with OD for E.coli K12 MG1655 transformed with pLAC-GFP in absence of any sugar (■), in presence of 0.2% lactose combined with M9 rich medium (●), 0.2% arabinose (○), 0.2% sorbitol (△) and 0.2% ribose (+). Experiments were conducted during 17 hours
Our results show that pLAC promoter is activated by all tested binary combinations of sugars which all contained 0.2% lactose. The increase in activity over time is mainly imputable to lactose. Addition of other sugars known to be lower in the hierarchy with respect to lactose did not induced an additional effect on pLAC activity. This confirms that pLAC is on the top of the hierarchy
We can conclude that in the simple construct, a sugar higher up in the hierarchy will inhibit promoters associated to sugars lower in the hierarchy. .
V - Duration of the promoter expression
As our tool is mainly based on controlling gene expression in time, it is important for us to study the activity of these promoters in time. This will allow us to better understand the behavior of our promoters, enabling us to take into account any time differences we might discover in the design of our tool.
● pLAC-GFP E.coli :
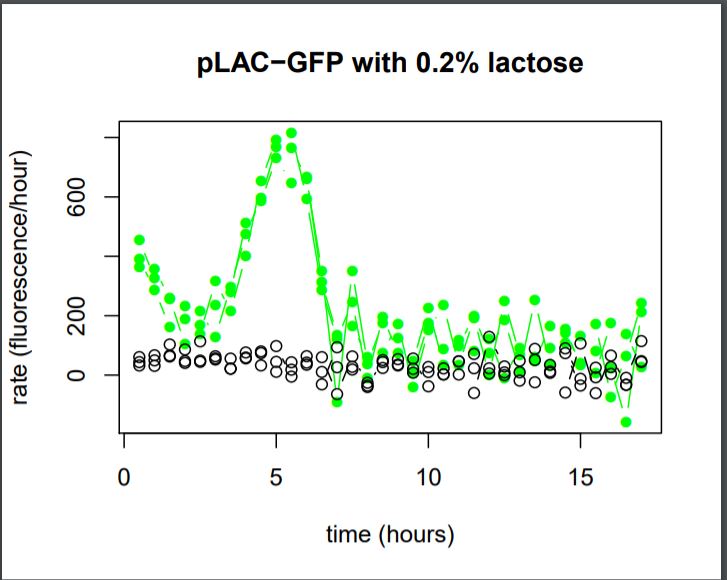
Figure 27: Rate of GFP Fluorescence/hours for E.coli K12 MG1655 transformed with pLAC-GFP simple insert in the absence or in the presence of 0,2% of Lactose
The activity of pLAC is relative to the expression of GFP fluorescence.
We do not observe the production of GFP fluorescence in the condition without sugar. It confirms our control. With 0,2% of lactose, we can observe a linear increase of GFP production per hour that begins around hour 2,5. At the 5th hour We observe a peak of production, and then the production of GFP sharply decreases until the 7th hour.
We can conclude that the activity of the promoter pLAC, observed here as the rate of GFP production, starts 2,5 hours after the presence of sugar in the medium and it’s activity lasts around 4,5 hours.
Summary
We can conclude that the activation and the activity of promoter vary in time, from one to the other. In saturated sugar conditions, pLAC is activated around hour 2,5 after the addition of sugar and it’s activity lasts for around 4,5 hours.
This information would need to be taken into account to increase the precision of sequential gene expression in time of our tool.
(1)“Hierarchy of non-glucose sugars in Escherichia Coli.” Aidelberg Guy et al, BMC Systems Biology., 2014 , PMID: 25539838
