Designed by: Christoph Geske Group: iGEM18_Bielefeld-CeBiTec (2018-09-03)
Human Ferritin Heavy Chain Copper Enhanced Binding and E-Helix removed
Sequence and Features
Assembly Compatibility:
10
COMPATIBLE WITH RFC[10]
12
COMPATIBLE WITH RFC[12]
21
COMPATIBLE WITH RFC[21]
23
COMPATIBLE WITH RFC[23]
25
COMPATIBLE WITH RFC[25]
1000
INCOMPATIBLE WITH RFC[1000]
Illegal BsaI.rc site found at 449
Functional Parameters
Human Ferritin Heavy Chain Copper Enhanced Binding and E-Helix removed.
Human Ferritin Heavy Chain with Enhanced stability.
By histidine insertion in the subunit binding region copper can be inserted which leads to enhanced stability.
Nanoparticles Results
Short Summary
For our project we used two different types of ferritin, the bacterioferritin BfBr and the human ferritin HuHF. We showed increased iron nanoparticle formation through BfBr overexpression and engineered BfBr to show increased stability in the presence of copper ions. Furthermore, we constructed HuHF mutants with the ability to form gold and silver nanoparticle.
Enhanced Stability and Reassembly of Mutant Ferritin
We chose E. coli as the host organism for producing the mutant of human ferritin heavy chain. Wild type ferritin consists of two different subunits, the heavy and the light chain but for simplicity reasons we only use the heavy chain which can form the ferritin cage on its own without the light chain being required.
We used DNA synthesis from IDT based on the part BBa_K1189019 which was introduced by Calgary 2013 but codon optimized the sequence for expression in E. coli resulting in the following part.
Using the synthetized sequence of the human ferritin as a template we introduced the desired mutations via primers.
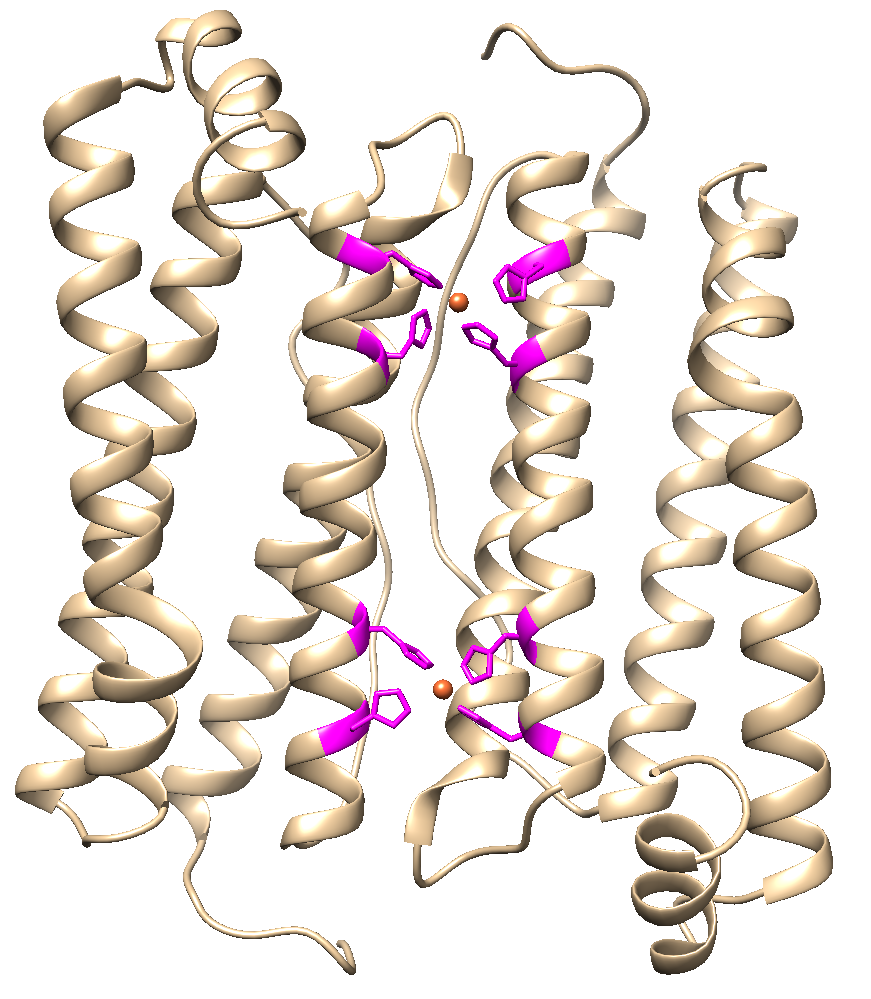
We introduced 4 amino acid changes to histidine which resulted in two new binding regions for copper in the surface area between two adjacent subunits (Figure 1) which resulted in the following part (BBa_K2638601).
Figure 1: Four amino acid changes should lead to enhanced stability after copper ion inclusion.
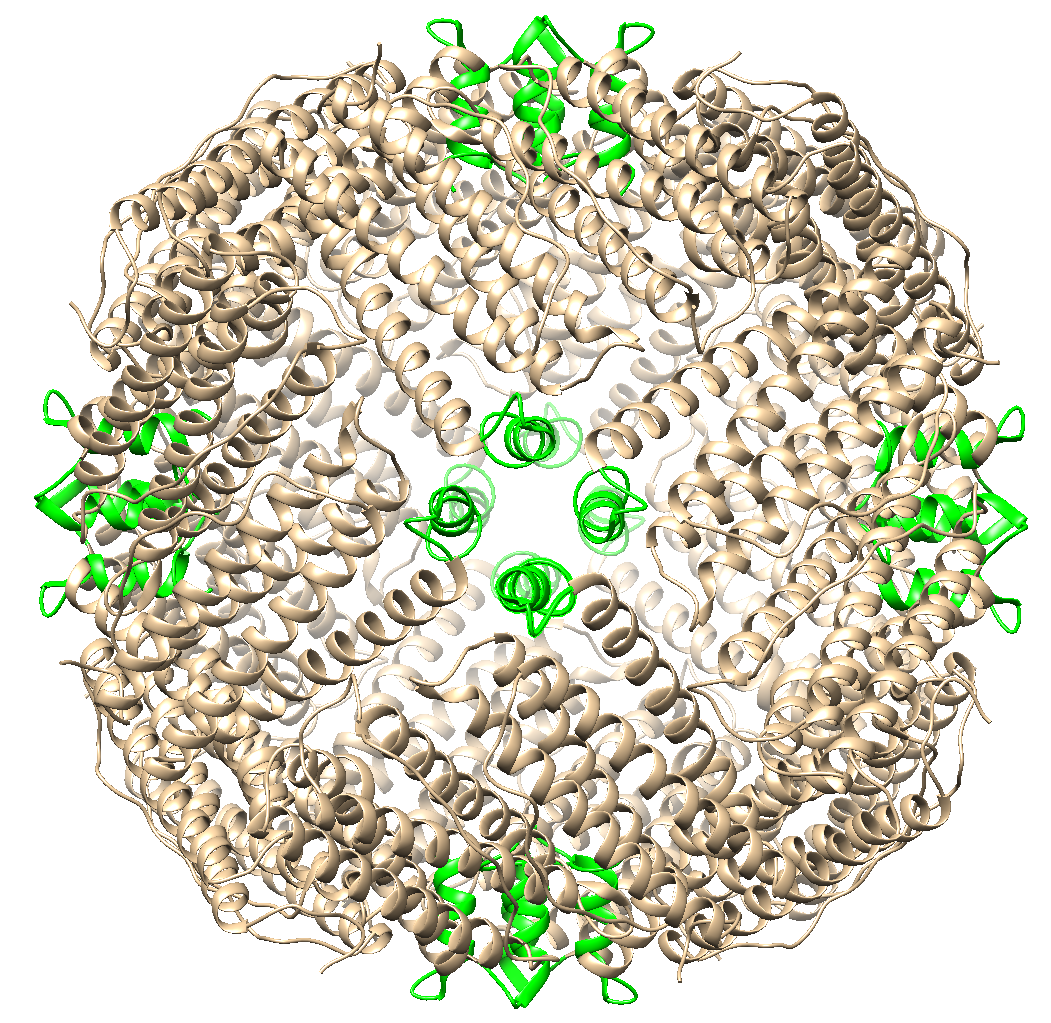
The second mutation we introduced was shortening the C-terminus of the ferritin subunit by removing the E-helix and the DE turn (see Figure 2) which resulted in the following part (BBa_K2638602) which should disassemble at a pH being below 4 instead of being below 2 for wild type human ferritin.
Figure 2: Wild type ferritin with the E-helix and DE turn colored in green.
We also combined both mutations into one part BBa_K2638603.
All mutations were introduced by primers binding to the synthetized ferritin sequence and the resulting PCR products were combined via Gippson Assembly.
We further used primers to introduce overhangs to mTagBFP and for the introduction of a linker which keeps the mTagBFP from being to close to the ferritin subunit possibly resulting in steric hindrance. Steric hindrance could influence the assembly process of our mutant ferritin. mTagBFP and linker where attached to the N-terminus of the ferritin since the N-terminus is positioned on the outside of the ferritin cage resulting in the parts BBa_K2638610 to BBa_K2638613.
For protein purification we choose a commercial intein tag which cleaves itself of after protein purification was performed only leaving back the desired protein (see Intein IMPACT protocol).
The resulting PCR product was inserted into pTYB11 via Gipson Assembly for later protein purification of the mutant ferritin without having a tag attached to our ferritin mutant.
The plasmid was than transformed into E. coli Dh5α for high copy plasmid production. Plasmid iso was performed and the plasmids were retransformed into the protein expression strain E. coli ER2566.
Correct Folding And Assembly Of Mutant Ferritin
Using the impact protein purification protocol, we were able to purify our blue fluorescent ferritin seein in figure 1 eppi in the top right of the picture.
Figure 3: Top right eppi ferritin batche glowing blue under UV light indicating successful expression of mTagBFP ferritin. Behind it using mRFP the ferritin mutant containing 4 copper changes and also missing the E-helix and DE turn.
We also performed a fluorescence scan using the Tecan reader to validate what also could be seen under UV light with the naked eye. Excitation and emission values specified for mTagBFP (BBa_K592100) where in agreement with our measurements.
SDS page (Fig. x) with the purified mTagBFP tagged ferritin was performed to validate the positive results we achieved with the fluorescence scan. The gel shows a band at around 45 kDa which agrees with the size prediction of the modified ferritin subunit (1236 bp ; 45,7 kDa).
Figure 4: SDS gel showing the right bands indicating successful expression of our fusion ferritin.
Interestingly the SDS gel might also be used as an indicator for successful ferritin formation.
Because the ferritin is a large round cage only a subset of subunits which have an intein tag attached to them should interact with the column allowing the rest of the intein tags to stay unbound and be released after cleavage.
The intein purification tag has a size of 55 kDa and should therefore be present as a band above the fusion protein when the column is fully loaded giving us a direct indicator for successful ferritin formation.
Since such an intein band was not present we concluded that the chitin column was not overloaded and all the free intein tags bound to the column after cleavage buffer was applied.
To make sure that our ferritin assembled correctly we decided to repeat the protein expression and purification in E. coli ER2566 expressing our ferritin-mTagBFP (BBa_K2638612) in media enriched with 100 mM of Iron(III) citrate (Iron(III) citrate was boiled in LB to dissolve crystals) which should lead to the formation of detectable iron nanoparticles only if ferritin has successfully assembled inside the cells and kept its functionality in regards to forming correctly and binding accumulation iron despite our introduced mutation (removing the E-helix and DE turn).
The iron loaded ferritin was agein purified following the intein purification and presence confirmed by fluorescence measurements as described above. Afterwards BBa_K592100 was examined using a small desktop transmission electron microscope (TEM).
Figure 5: Size of our ferritin modeled using Chimera.
The TEM images (Fig. x and y) seemed to confirme the formation of iron nanoparticles suggesting that the ferritin cage forms inside the cell.
It should be noted however that the resolution of the 80kV TEM used for making these images is not ideal and we cannot say with full certainty that the structures with a size of ~29 nm visible in the TEM images are the mutant ferritin. To the best of our knowledge nothing else could be responsible for creating such uniform structures visible under the TEM.
As a side note we should point out that proteins are in general not visible well in the electron microscope but we noted a clearly visible white circle around a darker spot in previous experiments which should be caused by the protein shell around the iron core.
The iron core however should be clearly visible as a dark spot in the TEM Image. If the resolution of the TEM is good enough it is even possible to see the uniform metal structure of the iron core like we showed in a previous experiment.
Figure 6: 80kV TEM image with scal bars measuring ferritin nanoparticles.
To make a definitive conclusion if an iron NP core can form in our mutant ferritin BBa_K2638612 we went to a higher resolution TEM performing close up images of the iron core. The Iron core is visible but contrast is weaker than the images in the 80 kV TEM due to the 200kV TEM used for making those images having a higher energy beam. A second factor which influences the visibility in the TEM picture is the composition of the iron core since Fe(III) oxide is less visible than elemental metal. How elemental metal looks under the TEM is shown on our page on gold and silver forming ferritin.
Also attributing to the low contrast of the image is the carbon layer which forms on top of the particle as soon as the electron beam focuses on it and the time the picture was taken. To confirm that the particles consist of we performed an EDX measurement.
Figure 7: 200kV TEM image with scal bars measuring ferritin nanoparticles.
Analysis of Enclosed Fluorophores by Fluorescence Correlation Spectroscopy (FCS) using Zeiss LSM780
To test if our modified ferritin can be used as a cage to enclose various proteins or molecules of interest, we attempted to enclose mRFP (27 kDa) and the much smaller fluorescein (0.33 kDa) respectively.
mRFP (BBa_E1010) was over expressed in psB3t5, the cells where ribolysed and purified using a 0.5mL protein filter (Amicon Ultra). Synthetized fluorescein was used which our team member Jakob Zubek also synthetized himself in one of his chemistry practical courses.
To compare the enclousure capability we used the wild type ferritin () and compared it with our modified ferritin missing the e-helix and DE turn (BBa_K592100).
As the objective of this experiment was to look for differences in the pH values necessary for disassembly of the unmodified ferritin (BBa_K1189019) and our modified ferritin (BBa_K592100) we exposed the ferritins to different pH conditions. In the literature the pH threshold for disassembly is 2.10 for the ferritin wild type and 4 for our ferritin variant (BBa_XXX). Reassembly should occur at a pH of around 7.5.
We therefore exposed the wild type and the mutant ferritin to a pH of below 1 and to roughly 3 using HCL. Afterwards we added purified mRFP (X mg/L) or fluorescein (Y g/L) to the mix so that passive enclosure could happen. After returning the pH to 8 we characterized the probe via FCS.
Initially we wanted to look directly for overlapping fluorescence signals of the BFP tagged ferritin and the mRFP enclosed inside. But the effects of Brownian motion and the small size (~29 nm) of our fusion ferritin makes this kind of visualization impractical, which is why we turned to fluorescence correlation spectroscopy (FCS) as an alternative.
FCS uses a laser to excite single fluorescent molecules passing in front of it through a very small volume. A detector then measures the intensity and time of the fluorescent signal which can be used to estimate the mass and number of molecules in front of the laser.
Since free fluorophores are much smaller than ferritin encapsulated fluorophores they move through the small detection volume at a much higher speed. Thus the two populations (small, free fluorophores and larger, slow ferritin-associated fluorophores) should be discernable by FCS.
By measuring the individual times of the passing particles and by taking the average we received a table of times which describe how long the fluorophores spend in front of the laser.
Unfortunately, the measured times did not confirm our assumptions. Which we attribute to the contamination with other large protein who might also interact wit our fluorophores changing their average speed despite not being enclosed.
For example the average speed of the single fluorescein molecule in front of the laser was on average 0,005 µs like we expected but
We expected to see very short average times for the fluorescein on its own which could be confirmed by measuring an average time of 0,005 µs.
Measuring the speed of fluoricin after opening and closing the ferritin cage via lowering and raising the pH we saw a significant slow down but we could not definitively say that our engineered ferritin is responsible or if the fluorescein interacts with other impurities in the solution since our negative control which should not enclose any fluorescein also slowed down the fluorescein.
Our TEM images (Figure 4) showed that many impurities are mixed into our eluate and we therefore hypothesize that those impurities influence the speed of our fluorophores significantly resulting in the highly different speeds observed by our measurements.
Molecular graphics and analyses performed with UCSF Chimera, developed by the Resource for Biocomputing, Visualization, and Informatics at the University of California, San Francisco, with support from NIH P41-GM103311.
Pettersen, E.F., Goddard, T.D., Huang, C.C., Couch, G.S., Greenblatt, D.M., Meng, E.C., and Ferrin, T.E. (2004).UCSF Chimera--a visualization system for exploratory research and analysis. J Comput Chem 25: 1605–1612.
Wang, Z., Dai, Y., Wang, Z., Jacobson, O., Zhang, F., Yung, B. C., ... & Chen, X. (2018).. Metal ion assisted interface re-engineering of a ferritin nanocage for enhanced biofunctions and cancer therapy. Nanoscale, 10(3), 1135-1144.
Chen, H., S. Zhang, C. Xu, and G. Zhao. (2016). "Engineering protein interfaces yields ferritin disassembly and reassembly under benign experimental conditions." Chemical Communications 52, no. 46 : 7402-7405.