
Part:BBa_K1989019
Contents
Triplespycatcher with His-tag , FlAsH-tag and signal peptide LTIIb
Usage and Biology
Biological material
In the last few years, hydrogens made from natural or synthetic polymers have been investigated due to their extensive application in clinical medicine and synthetic biology. Comparing to traditional biological material, protein-based multifunctional biological material is low-cost, facile and eco-friendly. However, strategies for assembling 3D molecular networks synthesized only by protein molecular remain underdeveloped. The reason why investigating this technology is still tough is lack of protein-based cross linking agents.
Spycatcher
Inspiring from the self-catalysis of isopeptide bond between Lys and Asp in Streptococcus pyogenes fibronectin-binding protein FbaB, researchers split the catalytic domain and obtain two peptide called Spytag(the short one) and Spycatcher(the long one) which are able to form isopeptide bond with the other without any assistant. By fusing Spytag and Spycatcher with functional domains respectively, researchers solve the problem tactfully. In order to using Spytag and Spycatcher system as scaffold, we fused three Spycatcher spaced by (VPGVG)15 with 6xHistag in N-terminal.
Signal peptide
Whether in E. coli or Bacillus subtilis, the secreted proteins usually contain signal peptides that are essential for export from the cytoplasm. Signal peptides are at the N terminus of target proteins and can be cleaved after secretion. Both E. coli and Bacillus subtilis rely on Sec or Tat machinery to traverse the inner membrane. Detailed description is shown in Figure.1, where three distinct ways are depicted.


As several attributes of our target proteins, such as 3A-SUP, 3B, 3A-mSA, etc. remained unknown, especially their folding state in cells, we were unable to rationally design or choose a signal peptide for each. Nevertheless, we could build a Signal Peptide Repertory to screen for the best SP candidate. Our ultimate goal was to select the most appropriate ones from a huge amount of signal peptides, but owing to the limited time, we had just chosen a limited number of signal peptides to test for its potential to secrete our target proteins. Based on previous studies on their performance of secretion, LTIIb was selected in this part.

His-tag
His-tag is an amino acid motif in proteins that contains at least six histidine residues and is widely used for recombinant protein purification because of its affinity for bivalent nickel or cobalt ions.
FlAsH-tag
FlAsH-tag is an alias for a tetracysteine-motif-tag (-FLNCCPGCCMEP-) which binds with high affinity and specificity to a biarsenical dye FlAsH-EDT2 and forms a fluorescent compounds.

Based on our results, the fused protein His-LTIIb-3B-FlAsHtag possess both isopeptide bond forming function and secretion . Thus, using His-LTIIb-3B-FlAsHtag as a part of hydrogel formation, we can obtain our multifunctional biomaterial.
Cultivation and Western blot analysis
Cultivation
The part was assembled with T7 promoter and RBS in pET28a plasmid vector. E. coli strain BL21(DE3) harboring the appropriate plasmid was grown at 37 °C in 2xYT medium overnight with suitable concentration of antibiotic. The culture was diluted 100 fold into fresh medium with antibiotic and grown at 37°C to an optical density of 0.6~0.8 at 600 nm, the protein expression was induced with 1 mM isopropyl β-D-1-thiogalactopyranoside (IPTG) and cells were grown overnight at 25°C.
Western blot analysis
Cells were centrifuged at 12000rpm for 10min at 4°C. The cytoplasmic components were separated from the medium and then a western blot analysis was conducted.

Activity Analysis
Gel Formation
Basic Exploration
Exploring the polymerization of our crosslinking network is significant to subsequent application. We must know what our Spy Network is like, and how long they need to complete their reactions, which would offer us a kind of intuition of their crosslinking ability.
To answer the questions shown above, we have analyzed the crosslinking ability of our fundamental monomers, 3A, 3A-SUP, 3A-mSA and 3B. They were firstly diluted to certain concentration, and were made to react under the restriction that the number of A was equal to B. The monomers containing A were conducted to react with 3B at 25℃ and pH=7.3 with the duration of 2 hours.

Fig. 4. Exploration of the polymerization ability of the 3A-SUP/3A-mSA with 3B. Left: the Coomassie Blue staining gel of basic experiment, which illustrates the basic cross-linking ability of 3A-SUP/3A-mSA and 3B. Lane 1, Thermo® Protein Marker; lane 2, 3A-SUP; lane 3, 3A-mSA; lane 4, 3A-SUP+3A-mSA; lane5, 3B; lane 6, 3A-SUP+3B; lane 7, 3A-mSA+3B. (Molecular Weight: 3A-SUP, 21.4kDa; 3A-mSA, 25.4kDa; 3B, 55.4(62) kDa. Right: A, the OD value of the lane 5 of oligomers produced by the mix of 3A-SUP and 3B. Peaks illustrate the monomers and the possible products, ①, 3A-SUP (21.4kDa); ②, 3B (62kDa); ③, 1x 3A-SUP+1x 3B (83.4kDa); ④, 3x 3A-SUP+1x 3B (126.2kDa); ⑤, 2x 3A-SUP+2x 3B (166.8kDa); ⑥, 4x 3A-SUP+4x 3B (333.6kDa). B, the OD value of the lane 6 of oligomers produced by the mix of 3A-mSA and 3B. Peaks illustrate the monomers and the possible products, ①, 3A-mSA (25.4kDa); ②, 3B (62kDa); ③, 1x 3A-mSA+1x 3B (87.4kDa); ④, 1x 3A-mSA+2x 3B (149.4kDa); ⑤, 2x 3A-mSA+2x 3B (174.4kDa); ⑥, 3x 3A-mSA+4x 3B (324.2kDa). (The software lane 1D was used to draw the graph.) (“3A-SUP” stands for “Triple SpyTag-SUP”, “3A-mSA” for “Triple SpyTag-mSA”, and “3B” is the abbreviation of “Triple SpyCatcher”)
We found that some new bands appeared above the band of 3B when it was mixed with monomers containing A, which demonstrated that our idea of forming functional hydrogel was executable. The products were mainly oligomers (Fig. 2 A-F, Table 1), for it is easy to form loops, which hindered the linkage between different monomers at such low concentration. Interestingly, with the restriction that A is equal to B in number, and the content of 3B was constant initially, the crosslinking ability at low concentration of these monomers were different with each other by comparing the surplus content of 3B. What’s more, it was surprising that the position of 3B band (~62kDa) was not accord with its theoretical weight (55.4kDa). Further experiments will be done to understand the differences.
Gradient Experiment
After exploring the basic character, i.e., the ability to crosslink, of our reactants, we would like to further explore the advantageous conditions for our polymerization, such as pH gradient, temperature gradient, and concentration gradient of monomers.
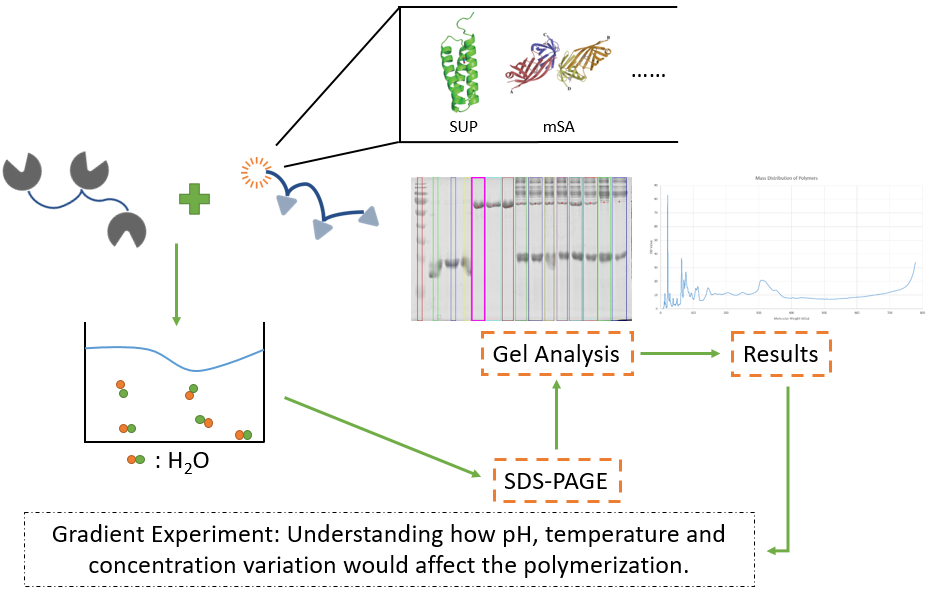

Fig. 5. Design the gradient experiment of pH, temperature and concentration
First experiment is concerned with pH gradient. Given that our Spy Network in practical application would face water environment with pH nearly neutral, and our proteins have their own optimum pH of functioning, we decide to make pH gradient of 6.3/7.3/8.3. Typical monomers 3A-SUP and 3B would firstly dissolve in TBS at certain pH values, then they were put to react at mentioned pH gradient. The reaction would be conducted at 25℃, with duration of 2 hours. Samples would be extracted every 30min to make clear the variation tendency of monomers. After the reaction, SDS-PAGE would be conducted and the gels would be scanned and analyzed by the software Lane 1D. Thus the relationship between time and the content of 3B and 3A would be found out. Three parallel groups were set to realize quantitative analysis.

Fig. 6. pH Gradient Experiment A: the reactive extent for 3B at different pH. Experiments were repeated three times and error bars were added. B: The mass distribution of oligomers at different time at pH7.3 (70kDa-450kDa).
From the results of analyzing SDS-PAGE gels showing above, we clearly observed the changing law of 3B and the mass distribution of polymer homologs. Appropriately lower pH would lead to faster consumption of monomers, while our time scale should be smaller in order to show the condensation polymerization nature.
Second is concerned with temperature. According to the common environmental temperature, three typical values, 16℃, 25℃, 37℃ were introduced in our temperature experiment. Similar to pH Gradient Experiment, typical monomers 3A-SUP and 3B would firstly dissolve in TBS at pH=7.3, then they were put to react at mentioned temperature gradient. The reaction would be conducted at pH=7.3, with the duration of 2 hours. The subsequent steps were same to that of pH Gradient Experiment.

Fig. 7. Temperature Gradient Experiment A: the reactive extent for 3B at different temperature. Experiments were repeated three times and error bars were added. B: The mass distribution of oligomers at different time at 16℃ (70kDa-400kDa).
The analysis of SDS-PAGE gel clearly showed the variation tendency of the surplus content of 3B as a function of time, and of the mass distribution of homologs. According to the result, we could conclude that higher temperature would lead to the faster consumption of monomer, and at designated time scale we didn’t see any change in the change of weight distribution of polymer homologs. We supposed that it should be easier to form loops (intramolecular reactions) at such low concentration, and the time scale is too large to show the variation. Though the rate of polymerization should be described by the consumption rate of functional groups, we decide to use the consumption rate of monomers to simply describe the tendency.
Third is concerned with concentration. At low concentration would cross-linkage not polymerize, but oligomerize (The difference between these two reactions can be described by crosslinking density, the former is large, while the latter is rather small.), according to the basic knowledge of Polymer Science. From this point of view, if we hope to promote the mass, strength and contact area of polymers, we have to mix our monomers at high concentration. Thus, understand the relationship between the concentration and the variation of mass distribution of polymers is quite essential.

Fig. 8. The mass distribution of oligomers of concentration gradient experiment at different concentration Left: the Coomassie Blue staining gel of concentration gradient experiment, which clearly showed the change of mass distribution according to the change of concentration. Lane 1, Thermo® Protein Marker; lane 2, 3A-SUP; lane 3, 3A-mSA; lane 4, 3A-SUP+3A-mSA; lane5, 3B; (1mg/mL) lane 6, 3A-SUP+3B; lane 7, 3A-mSA+3B; lane 8, 3A-SUP+3A-mSA+3B; (5mg/mL) lane 9, 3A-SUP+3B; lane 10, 3A-mSA+3B; lane 11, 3A-SUP+3A-mSA+3B; (10mg/mL) lane 12, 3A-SUP+3B; lane 13, 3A-SUP+3A-mSA(5mg/mL)+3B. (Molecular Weight: 3A-SUP, 21.4kDa; 3A-mSA, 25.4kDa; 3B, 55.4(62)kDa. “3A-SUP” stands for “Triple SpyTag-SUP”, “3A-mSA” for “Triple SpyTag-mSA”, and “3B” is the abbreviation of “Triple SpyCatcher”). 5mg/mL and 10mg/mL samples were diluted to 1mg/mL after the reaction (with the duration of 2 hours). The mass of samples in lanes was equal to each other. Right: the OD value of the lanes 2, 5, 6, 9, 12 of the oligomers produced by the mix of 3A-SUP and 3B. Peaks illustrate the monomers and the possible products, ①, 3A-SUP (21.4kDa); ②, 3B (62kDa); ③, 1x 3A-SUP+1x 3B (83.4kDa); ④, 3x 3A-SUP+1x 3B (126.2kDa); ⑤, 2x 3A-SUP+2x 3B (166.8kDa); ⑥, 4x 3A-SUP+4x 3B (333.6kDa); ⑦, average mass of polymers larger than 750kDa (~6x 3A-sup+10x 3B or 9x 3A-SUP+9x 3B). (The software lane 1D was used to draw the graph.)
The analysis of SDS-PAGE gel showed that more hyper-branched products with heavier molecular weight appeared with the increase of concentration, which, could also lead to the prediction that the average weight would be larger if higher concentration of monomers were mixed together.
Uranyl-binding affinity and selectivity
We tested the adsorption capacity of 3A-SUP, 4A-SUP, 6A-SUP and 3A-SUP+3B, 4A-SUP+3B, 6A-SUP+3B in TBS buffer (pH=7.02) against 10μM uranyl. We wanted to do some comparisons and found the best candidate. Cross-linked 3A-SUP+3B can sequester 95.77% of the total uranyl in TBS buffer (pH=7.0, 10μM), showing the best adsorption capacity. Other proteins also can sequester at least 60% of the total uranyl. The standard deviation were calculated from triplicate experiments.

Figure. 9. Adsorption capacity of 3A-SUP,4A-SUP,6A-SUP and 3A-SUP+3B,4A-SUP+3B,6A-SUP+3B
We then test different protein-uranyl ratio in TBS buffer against 10μM uranyl. The use of one and ten equivalents of protein against one equivalent of uranyl (10μM) in TBS buffer can sequester 89.79% and 92.70% of the total uranyl respectively. When protein-uranyl ratio increased, the adsorption rate also increased, but not significantly. The standard deviation were calculated from triplicate experiments.

Figure. 10. Adsorption capacity of 3A-SUP+3B with different protein-uranyl ratio in TBS buffer
To test whether our protein can work in real water condition, we use lake and synthetic sea water as solutions. 3A-SUP+3B can sequester 89.79% and 26.88% and 89.93% of the total uranyl respectively in TBS buffer, lake water and synthetic sea water. The standard deviation were calculated from triplicate experiments. We find that when proteins were employed in lake water, the adsorption decreased, the reason might be that other creatures in lake water interferes the proteins’ function.

Figure. 11. Adsorption capacity of 3A-SUP+3B in different water conditions
Furthermore, we decreased the uranyl concentration to 13nM and increased the equivalent of the proteins to test the sensitivity of 3A-SUP+3B in synthetic TBS buffer and sea water. To test the adsorption sensitivity, thee use of 6000 equivalent of protein against one equivalent of uranyl (13nM) in synthetic sea water and TBS buffer can remove 33.11% and 47.48% respectively. The concentration was determined by ICP-MS.

Figure 12. Adsorption capacity of 3A-SUP+3B against 13 nM uranyl in different water conditions: 6000 equivalent of 3A-SUP+3B against one equivalent of uranyl (13nM) in TBS buffer and synthetic sea water.
References
1. Low KO, Mahadi NM, Illias RM. Optimisation of signal peptide for recombinant protein secretion in bacterial hosts. Appl Microbiol Biotechnol.(2013)97(9):3811–3826.
2. Tjalsma H, Bolhuis A, Jongbloed JD, Bron S, van Dijl JM. Signal peptide-dependent protein transport in Bacillus subtilis: a genome-based survey
3. Hengen, P.N., Purification of His-Tag fusion proteins from Escherichia coli. Trends in Biochemical Sciences, (1995)20(7): p. 285-286.
4. Haitjema, C.H., et al., Universal Genetic Assay for Engineering Extracellular Protein Expression. ACS Synthetic Biology(2014) 3(2): p. 74-82.
5. Sun, F. et al. Proc. Natl Acad. Sci. USA 111, 11269-11274 (2014).
Sequence and Features
- 10COMPATIBLE WITH RFC[10]
- 12COMPATIBLE WITH RFC[12]
- 21INCOMPATIBLE WITH RFC[21]Illegal XhoI site found at 1731
- 23COMPATIBLE WITH RFC[23]
- 25COMPATIBLE WITH RFC[25]
- 1000COMPATIBLE WITH RFC[1000]
Functional Parameters
| None |