Part:BBa_K1732007
pSB1C3-J23100-B0034-BFP-His-B0015
J23100-B0034-BFP-His-B0015
His tagged mTagBFP codon optimized for E.coli (BBa_K1732021) and strong RBS (BBa_B0034). The J23100 strong constitutive promoter (BBa_J23100) allows for high level expression of the fluorescent protein used to measure fluorescence.
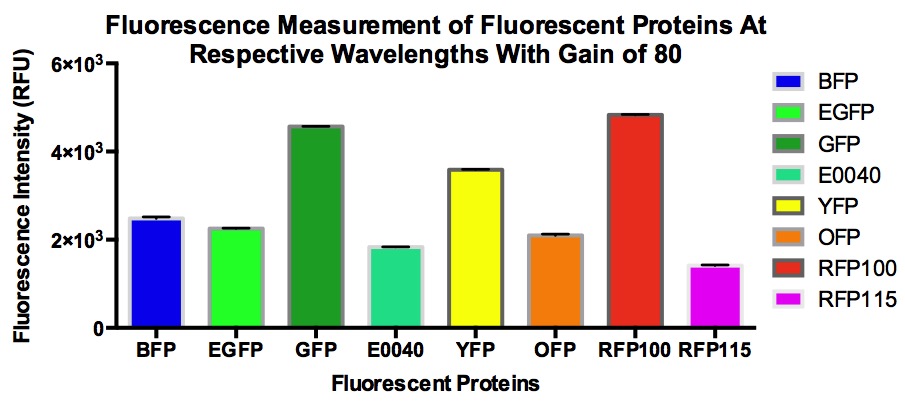
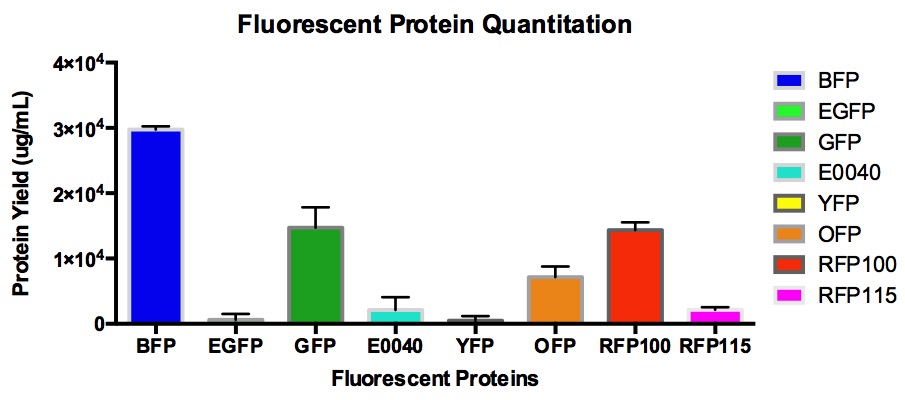
A set of fluorescent proteins which includes BFP, GFP, eGFP, E0040, OFP, YFP, and RFP with a J23100 constitutive promoter and RFP with a J23115 constitutive promoter were characterized. With the exception of E0040 GFP, all the other sequences differ from the original because they were codon optimized for E.coli via IDT codon optimization tool. The relative fluorescence as well as the signal-to-noise ratio of all the proteins in the MACH competent cell line were calculated. BFP was measured at (ex/em = 399nm/456).
Excitation and emission scans were performed on triplicate readings using the Tecan M1000. Fluorescence readings are normalized and shown below. Maximum fluorescence was found at ex/em = 401nm/454nm.

Cell growth of overnight cultures diluted by a factor of 50 was measured every 30 minutes for 6 hours. OD660 readings are shown below.

Fluorescence of the diluted cultures was read every 30 minutes for 6 hours at (ex/em = 399nm/456nm).

Sequence alignment of original sequence to codon optimized sequence.
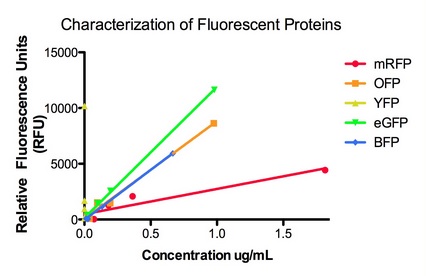
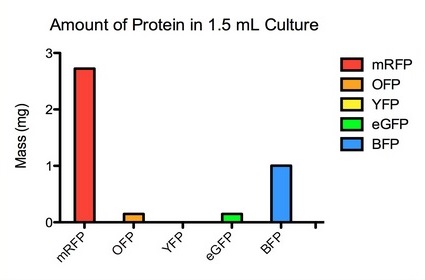
The graphs below show the data for the original set of fluorescent proteins prior to being codon optimized via the IDT codon optimization tool. The set consists of His tagged RFP, OFP, YFP, eGFP, and BFP, each with a strong RBS and WT lac promoter that allows for Lac induction of fluorescence.
Using a BCA dye (which changes color with different concentrations of protein) and a BSA protein standard (a protein from beef of known concentration), we can use a visible light spectrophotometer to create a sensitive standard curve. This curve is used to calculate the concentration of each protein solution, which we then can dilute in series and measure with a fluorimeter to compare relative fluorescence to protein concentration. We were able to show that the relationship remains fairly linear across fluorescent proteins, which makes quantifying fluorescently tagged proteins far simpler and more reliable.
Sequence and Features
- 10COMPATIBLE WITH RFC[10]
- 12INCOMPATIBLE WITH RFC[12]Illegal NheI site found at 7
Illegal NheI site found at 30 - 21INCOMPATIBLE WITH RFC[21]Illegal BamHI site found at 285
- 23COMPATIBLE WITH RFC[23]
- 25INCOMPATIBLE WITH RFC[25]Illegal NgoMIV site found at 607
- 1000INCOMPATIBLE WITH RFC[1000]Illegal BsaI site found at 518
Illegal BsaI.rc site found at 683
| None |


