
Part:BBa_K112805
[T4 holin]
Holins from T4 bacteriophage assemble together to form pores on inner membrane of bacteria allowing lysozyme to reach periplasm and degrade peptidoglycan layer.
Group: (Michigan 2017) Author: (Aaron Renberg) Summary: We improved this part by optimizing the codons for translation in E. coli using IDT’s codon optimization tool, and by eliminating the illegal XbaI site that Imperial College London’s 2011 team found, making it much easier for future iGEM teams to use. The changes we made were T358C, T556C, T563C, and T571C. Additionally, we constructed three different versions (of varying promoter strength) of a temperature controlled kill switch using holin, endolysin and antiholin. Link: https://parts.igem.org/Part:BBa_K2301000
Sequence and Features
- 10COMPATIBLE WITH RFC[10]
- 12COMPATIBLE WITH RFC[12]
- 21COMPATIBLE WITH RFC[21]
- 23COMPATIBLE WITH RFC[23]
- 25COMPATIBLE WITH RFC[25]
- 1000COMPATIBLE WITH RFC[1000]
Characterized by CAFA_China 2022
- We constucted a gene circuit include lacZ gene (BBa_I732019) and T4 lysis Device.

- The experimental result shows that the OD600 of recombinant cells with pBAD-lacZ-T4 lysis gene circuit reduced significantly by 2-3 times than non-recombinant cells after induced by different concentrations of arabinose.

Contribution of SCAU-China 2023
What have we done?
To achieve control over toxicant concentration, we introduced components labeled with BBa_K4632016 [1]to create the T4-T4 lysis device. BBa_K4632016 was originally from BBa_K112805. BBa_K112805's codon was optimized for Escherichia coli( E.coli ) expression.
We characterized the component to demonstrate its effectiveness, as detailed in the construction and characterization section.
In our initial validation experiments, we utilized a dual-plasmid system consisting of pBAD24M and pBAD33 to test our device. (Plasmid maps can be found in Figure 1)
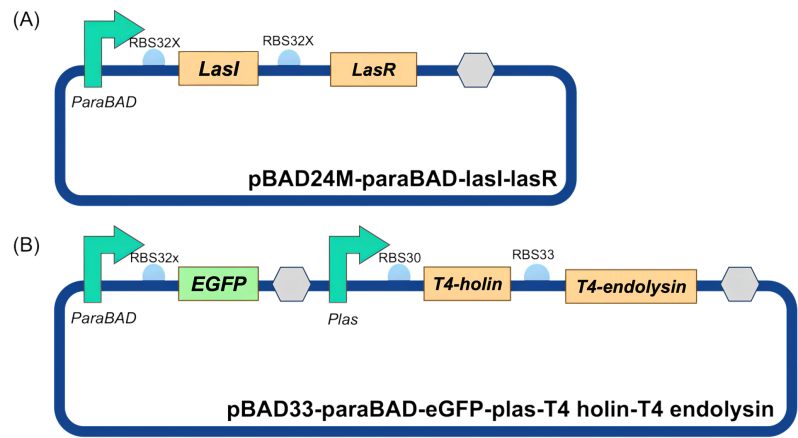
Figure 1. Diagram of Quorum sensing-based T4 lysis device verification systems circuit design
We characterized the component to demonstrate its effectiveness, as detailed in the construction and characterization section.
The Quorum sensing-based T4 lysis device verification systems were transformed into Top10 cells and conducted induction experiments using Ara. At regular intervals, the OD600 values and eGFP fluorescence intensity were measured using a microplate reader. A curve with OD600 were plotted as the vertical axis and induction time were plotted as the horizontal axis. If the OD600 value were observed an significantly decreases after the initially increaseing, the expression of the lysis gene could be confrimed. We assessed whether the pathway could limit the maximum expression level based on the trend in eGFP signal changes. If the eGFP expression rate significantly decreases or ceases to increase after the appearance of lysis, the verification is successful. The limitation of the maximum expression level was assessed by the trend of eGFP signal change.
Construction and Characterization
1. Construction
The complete sequences, synthesized (ordered from Guangzhou IGE Biotechnology Co.,Ltd.) and assembled onto respective plasmids, have been validated through sequencing. Both of the plasmids were simultaneously introduced into E.coli Top10 using the KCM ice method. Successful transformation was confirmed by clone PCR. Universal primers for the pBAD series plasmids were employed to confime the transformation of pBAD24M-paraBAD-lasⅠ-lasR. Amplification of bands corresponding to the size in pBAD24M for transformation plasmids resulted in bands of 1845 bp. This confirms the successful introduction of the pBAD24M plasmids.(Figure 2)

Figure 2. Colony PCR of co-transformation by universal primers.
Lane 3: Co-transformation of pBAD24M-paraBAD-lasⅠ-lasR and pBAD33-paraBAD-eGFP-plas-T4 holin-T4 endolysin
The specific primers PCR was also performed to obtain target-sized fragments. The plasmid containing paraBAD-eGFP-plas-T4 holin-T4 endolysin produced a 1296 bp fragment (Figure 3). This confirms the successful introduction of pBAD33 plasmids.
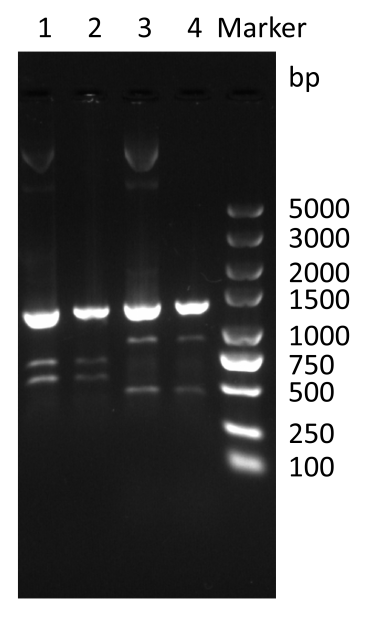
Figure 3. Colony PCR of co-transformation by specific primers.
Use forward primer (AGGCGGTCGTTGCTAATA) and reverse primer (AAACTCGTGCGGAGGTAA) as specific primer for pBAD33-paraBAD-eGFP-plas-T4 holin-T4 endolysin. lane 3: pBAD33-paraBAD-eGFP-plas-T4 holin-T4 endolysin; lane 4: Co-transformation of pBAD24M-paraBAD-lasⅠ-lasR and pBAD33-paraBAD-eGFP-plas-T4 holin-T4 endolysin
2. Validation of Product Expression Level Control Using Quorum sensing-based T4 lysis device verification systems
(1)Pre-experiment for Induced Expression of Lysis Effect The successfully transformed engineered bacteria were streaked on plates and grown at 37°C. Single colonies were picked and inoculated into liquid LB medium, followed by the addition of inducers. The cultures were incubated for 6 hours.

Fig.4 Verification of lysis effect
The blank control was LB with 20% Ara. The control group consisted of the second verification system engineered bacteria without inducer, while the experimental group consisted of the second verification system engineered bacteria with a final concentration of 0.02% Ara. Each group had 3 replicates
Result
After zeroing with the blank control, it was observed that the optical density in the experimental group decreased to 34.3% of that in the control group (Fig 4), indicating a significant lysis effect. This confirms the successful expression of quorum sensing and initiation of downstream lysis gene expression. Lysis gene expression was successful without leakage.
(2)Growth Curve Testing of the Second Verification System
Single clones were selected and inoculated into LB medium. After overnight incubation, the OD600 was adjusted to 0.6, and arabinose was added to a final concentration of 0.02%. The cultures were shaken for 21 hours in a sterile 96-well plate, and a growth curve was plotted. The blank control group was LB broth, the control group was wild Top10, and the experimental group was the engineering bacteria consisting of pBAD24M and pBAD33. There were 6 replicates per group.

Fig.5 Growth curve testing of the quorum sensing-based T4 lysis device
The growth curve revealed that the bacterial density continued to rise in the first 4 hours and began to decrease after 4 hours, stabilizing around the 9th hour. In contrast, the control group's bacterial density continued to rise. At the 4th hour, the quorum sensing signal reached the threshold, initiating lysis gene expression. The engineered bacteria lysed, resulting in a significant decrease in bacterial density, which stabilized around the 9th hour (Fig 5). <p>More detail link: https://parts.igem.org/Part:BBa_K4632024
| None |