Part:BBa_K1033907
fwYellow, yellow chromoprotein (incl RBS, J23110)
This chromoprotein naturally exhibits strong color when expressed. Compared to many other chromoproteins, such as amilCP (BBa_K592009), amilGFP (BBa_K592010), spisPink (BBa_K1033932), asPink (BBa_K1033933) and aeBlue (BBa_K864401), the color development is slower. The color is readily observed in both LB or on agar plates after 24-64 hours of incubation.
Sequence and Features
- 10COMPATIBLE WITH RFC[10]
- 12INCOMPATIBLE WITH RFC[12]Illegal NheI site found at 7
Illegal NheI site found at 30 - 21COMPATIBLE WITH RFC[21]
- 23COMPATIBLE WITH RFC[23]
- 25INCOMPATIBLE WITH RFC[25]Illegal AgeI site found at 170
- 1000INCOMPATIBLE WITH RFC[1000]Illegal BsaI.rc site found at 41
Illegal SapI.rc site found at 547
Newcastle 2019 Characterisation
The Newcastle iGEM team aimed to develop a suite of biosensors using fluorescence proteins as a reporter. Our goal was to investigated if we can measure fluorescence level correctly when reporter proteins are combined. We investigated whether mixing cultures of cells expressing different fluorescent proteins and chromoproteins would affect the fluorescence intensity of the individual fluorescent proteins. The fluorescent proteins we chose were sfGFP (BBa_K515105) and mCherry (BBa_J04450) and the chromoproteins we chose were fwYellow (BBa_K1033907) and cjBlue (BBa_K864404).
We obtained the reporter proteins from iGEM distribution kits. The resuspended DNA was transformed into E. coli DH5 alpha cells. Cells were inoculated in LB media and grown to an optical density 600 (OD600) of 0.6. Half of the culture was diluted to OD600 0.3 and the individual fluorescence levels were measured at: sfGFP - excitation 480nm and emission 507 and mCherry – excitation 580, emission 610. Each fluorescent protein was mixed with a chromoprotein individually using the culture grown to OD600 of 0.6 - sfGFP + fwYellow, sfGFP + cjBlue, mCherry + fwYellow and mCherry + cjBlue - and the fluorescence intensity was measured in a BioTek Synergy H1 Microplate Reader with a gain of 100.
The absorption wavelength maximum of cjBlue is approximately 610 nm [1]. The maximum absorption wavelength of fwYellow is 523 nm [2]. Given that the emission spectra for sfGFP ranges from 469 nm to 628 nm and the emission spectra for mCherry ranges from 551 nm to 800 nm, we would expect the mixing of fluorescent proteins with chromoproteins to decrease the fluorescence intensity of the fluorescent protein.
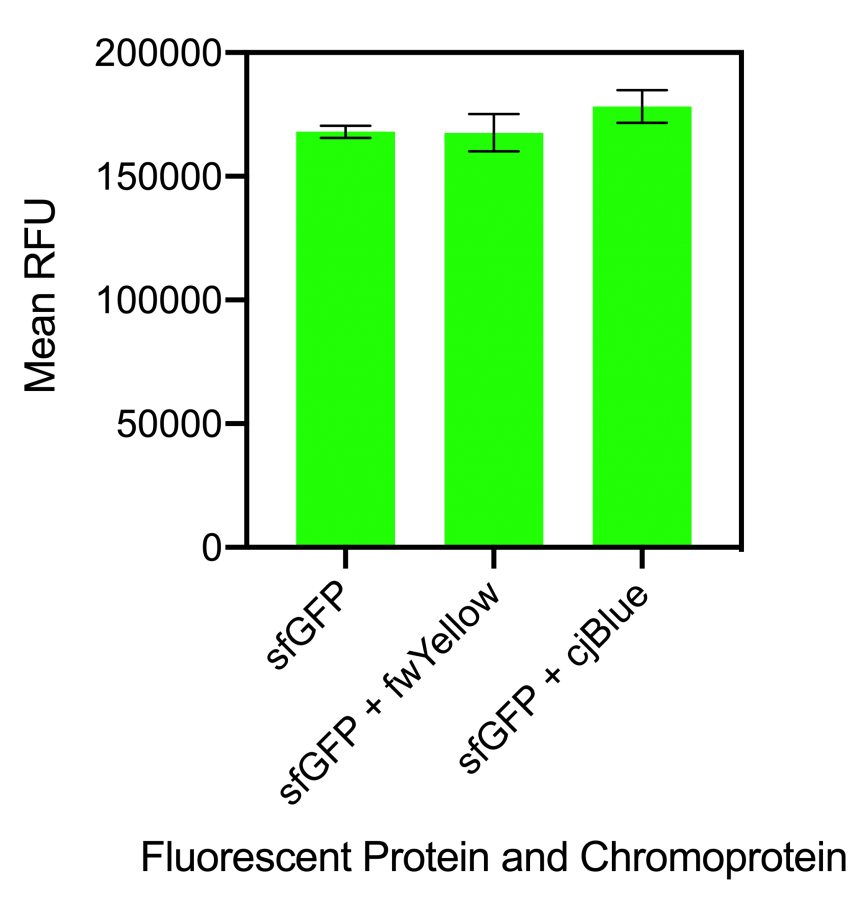
Figure 1. Bar chart showing the mean fluorescence intensity of E. coli DH5 alpha cells expressing sfGFP individually at an OD600 of 0.4 with standard deviations compared to the mean fluorescence intensity when mixed with cells expressing the chromoproteins fwYellow and cjBlue. Excitation 480 nm, emission 507 nm. Fluorescence intensity measured in BioTek Synergy H1 MicroPlate Reader
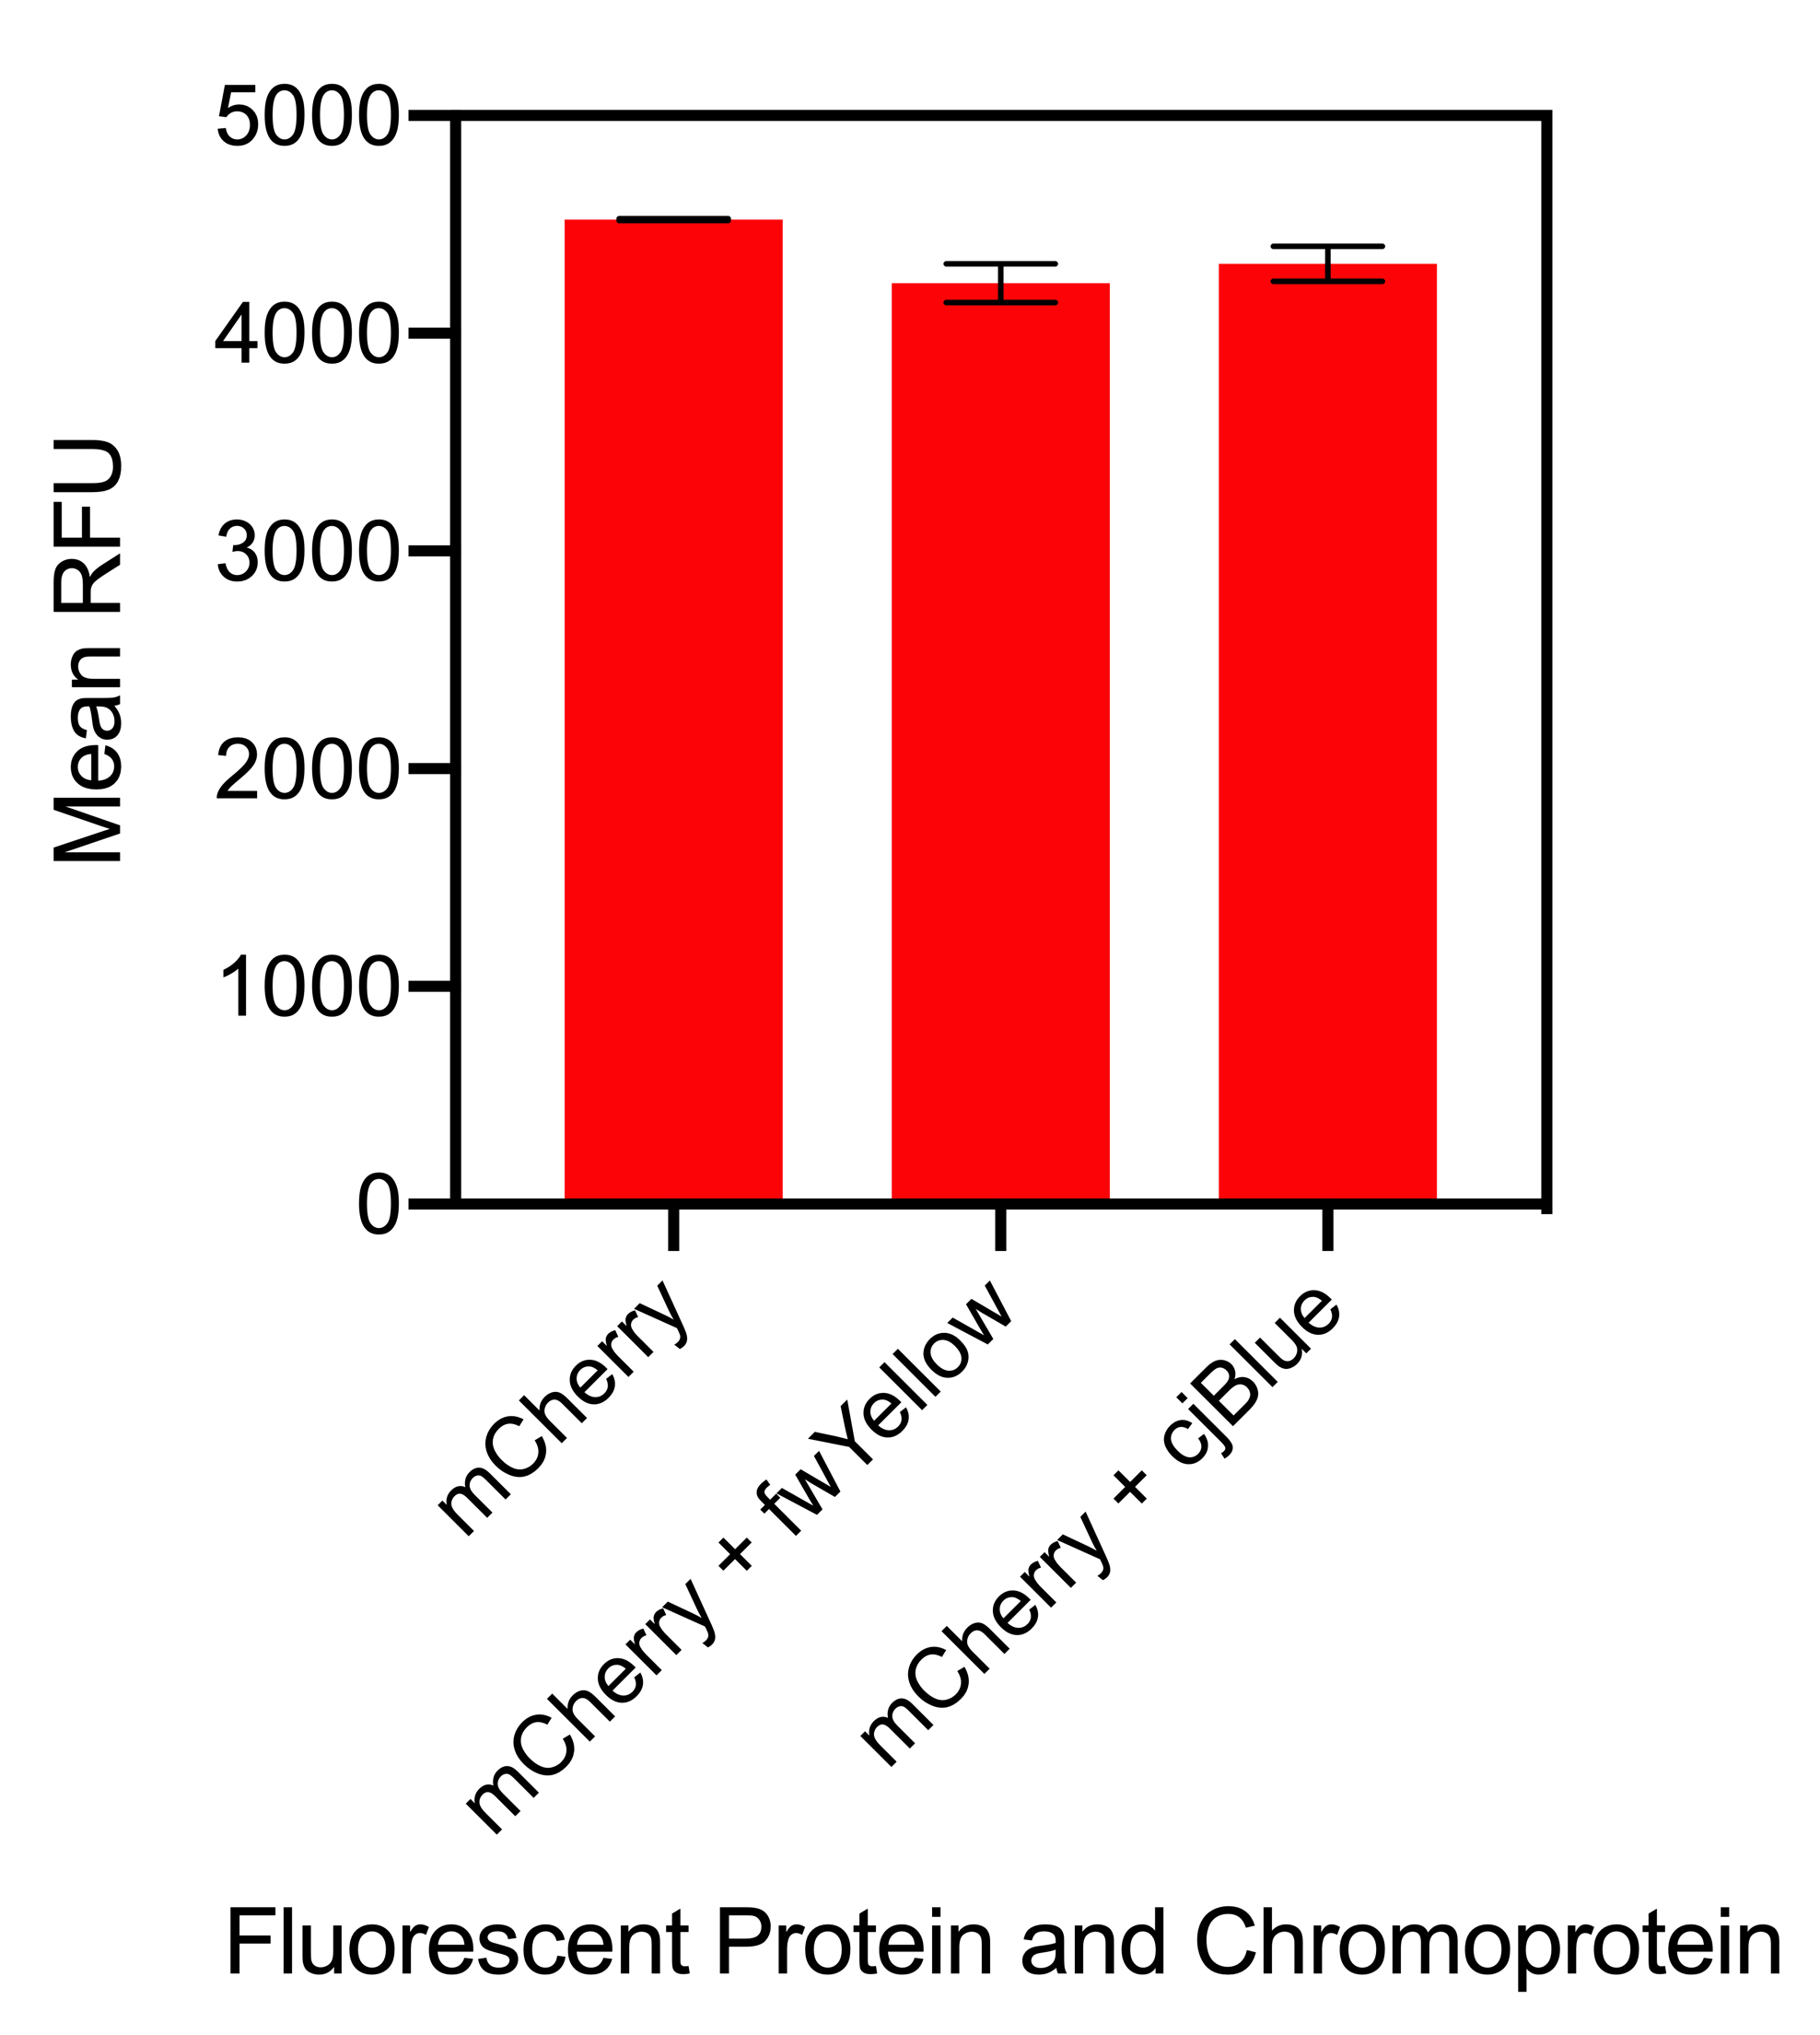
Figure 2. Bar chart showing the mean fluorescence intensity of E. coli DH5 alpha cells expression mCherry individually at an OD600 of 0.4 with standard deviations compared to the mean fluorescence intensity when mixed with cells expressing the chromoproteins fwYellow and cjBlue. Excitation 580 nm, emission 610 nm. Fluorescence intensity measured in BioTek Synergy H1 MicroPlate Reader
The results showed that when sfGFP was mixed with fwYellow, there was no significant difference in fluorescence intensity. Although, when sfGFP was mixed with cjBlue, there was a slight increase in fluorescence intensity but this was not significantly increased (Figure 1). When mCherry was mixed with fwYellow, there was a slight decrease in the fluorescence intensity of mCherry. Similarly, when mCherry was mixed with cjBlue, a slight decrease in the fluorescence intensity of mCherry was observed (Figure 2). Whilst there was a slight decrease in the fluorescence intensity of mCherry when mixed with the chromoproteins fwYellow and cjBlue, the difference was insignificant.
In conclusion, when fluorescent proteins are mixed with chromoproteins, this did not affect the fluorescence intensity of the fluorescent proteins. It can be concluded that despite the mixing of fluorescent proteins, when measuring fluorescence intensity, it can be confidently assumed that the results for each fluorescent protein is accurate.
For more detail see - https://2019.igem.org/Team:Newcastle/Results/bronzecharacterisation
References
1. Chan MC, Karasawa S, Mizuno H, Bosanac I,Ho D, Privé GG, Miyawaki A and Ikura M. Structural characterization of a blue chromoprotein and its yellow mutant from the Sea Anemone Cnidopus Japonicus 2006;281:37813.
2. NWU-China iGEM 2019. [Cited 20 Oct 2019]. Available at: https://2019.igem.org/Team:NWU-China/Characterization
| None |


