Part:BBa_I760005:Experience
This experience page is provided so that any user may enter their experience using this part.
Please enter
how you used this part and how it worked out.
Applications of BBa_I760005
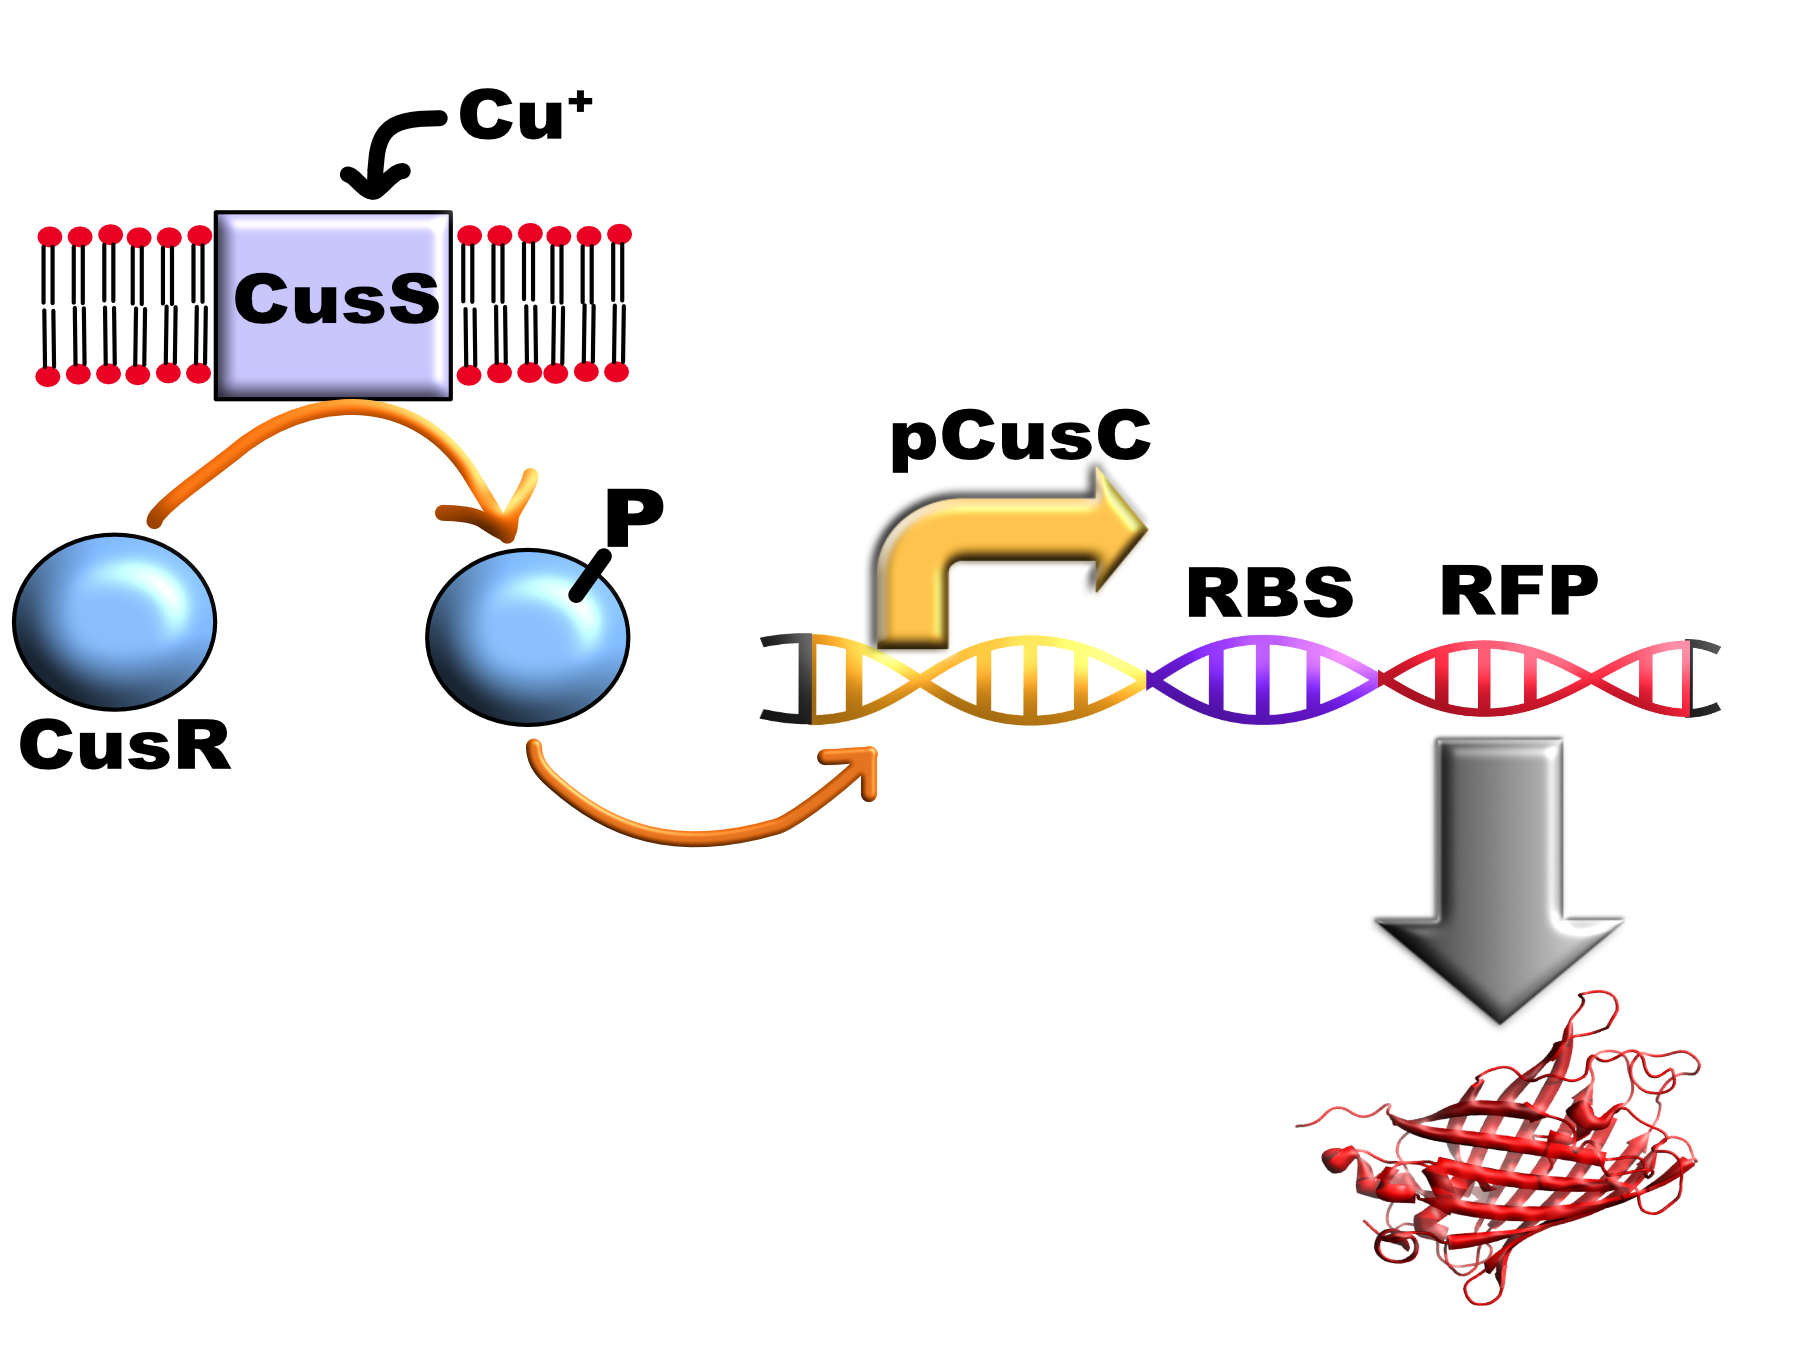
The Saint-Petersbug team used this part construct a copper biosensor system.
Use by Oxford iGEM 2016
Our project was to investigate a probiotic treatment for the copper accumulation disorder, Wilson's disease. This required a system able to detect dietary copper.
As this part had 11 uses but no expression data associated with any of these we expect that this part is non-functional. As the part is only 16 nucleotides long, we believe it is far too small and missing important binding sites for both CusR and RNA polymerase. We extended this part to create our part: https://parts.igem.org/Part:BBa_K1980004 and, using the reporter mKate2, (part:https://parts.igem.org/Part:BBa_K1980007) have obtained expression data at different copper concentrations.
Experience
Expression data for this promoter was obtained in E. coli MG1655 strain with the RFP variant mKate2: (https://parts.igem.org/Part:BBa_K1980007)
Using this part we measured the fluorescence after copper stimulation using three different techniques: a plate reader experiment, flow cytometry and fluorescence microscopy:
Plate Reader
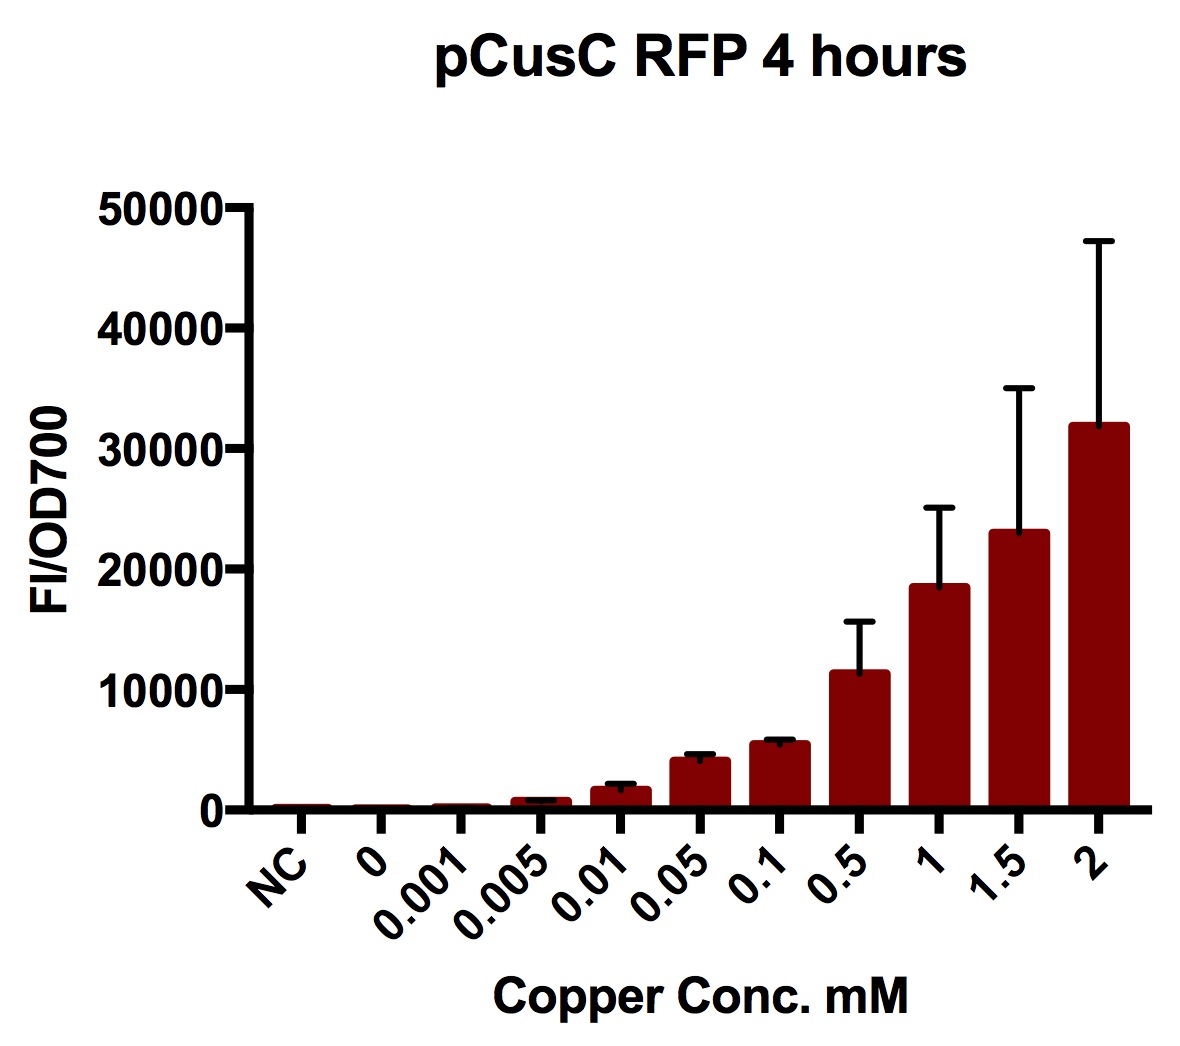
We tested the pCusC promoter with the fluorescent protein mKate2 (a form of RFP excitation/emission maxima at 588 and 633 nm).
To account for the number of cells present at different copper concentrations and different times we measured the optical density (OD) as a proportional measure of the number of cells present. For this part we measured the optical density at 700nm because measuring OD600 would get interference from the fluorescent protein.
Plate reader experiments were prepared by picking individual colonies off stored plates into 5ml of LB with 1 in 1000 chloramphenicol and growing these overnight (at least 8 hours).
A range of copper concentrations were prepared from stock solutions. A large volume plate was then prepared with 10μl of copper solution, 10μl of overnight culture and 980μl of broth with antibiotic. This resulted in a 1 in 100 dilution of the copper solutions prepared.
This large-volume plate was then centrifuged to mix the solutions and then 200μl transferred to a small-volume plate with a clear lid and then placed in the plate reader.
Four biological repeats of this part at ten different copper concentrations were measured as well as four repeats of a MG1655 negative control.
The plate reader measured the fluorescence and OD every ten minutes for at least 12 hours, shaking between measurements.
Flow cytometry
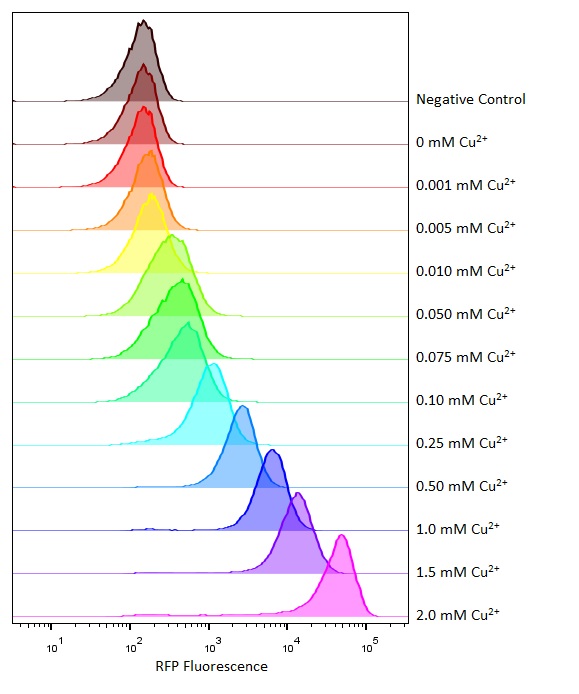
Flow cytometry is a technique whereby cells are passed individually into the path of a beam of light. The frequency range of incident light can be adjusted to allow excitation of specific fluorophores in the sample of cells. Downstream detectors can measure fluorescent emission, and this data can be used to quantify the amount of fluorophore in each cell.
To ensure comparability of experiments, all cells were grown for 3-4hrs (until entrance into the exponential growth phase) at 37°C and 225rpm shaking in the presence of the inducer before measurement. This allowed adequate time for activation of expression by the promotor systems. The negative control used in all cases were MG1655 bacteria containing an empty shipping plasmid. As these did not contain any fluorescent molecules, this population could be used to set the negative “gate” (i.e. the background fluorescence of the bacterial cells). Although the experiments were tedious as every sample had to be measured manually, the results were of remarkably high quality, were clearly interpretable, and fit very well with the other experimental data.
Microscopy
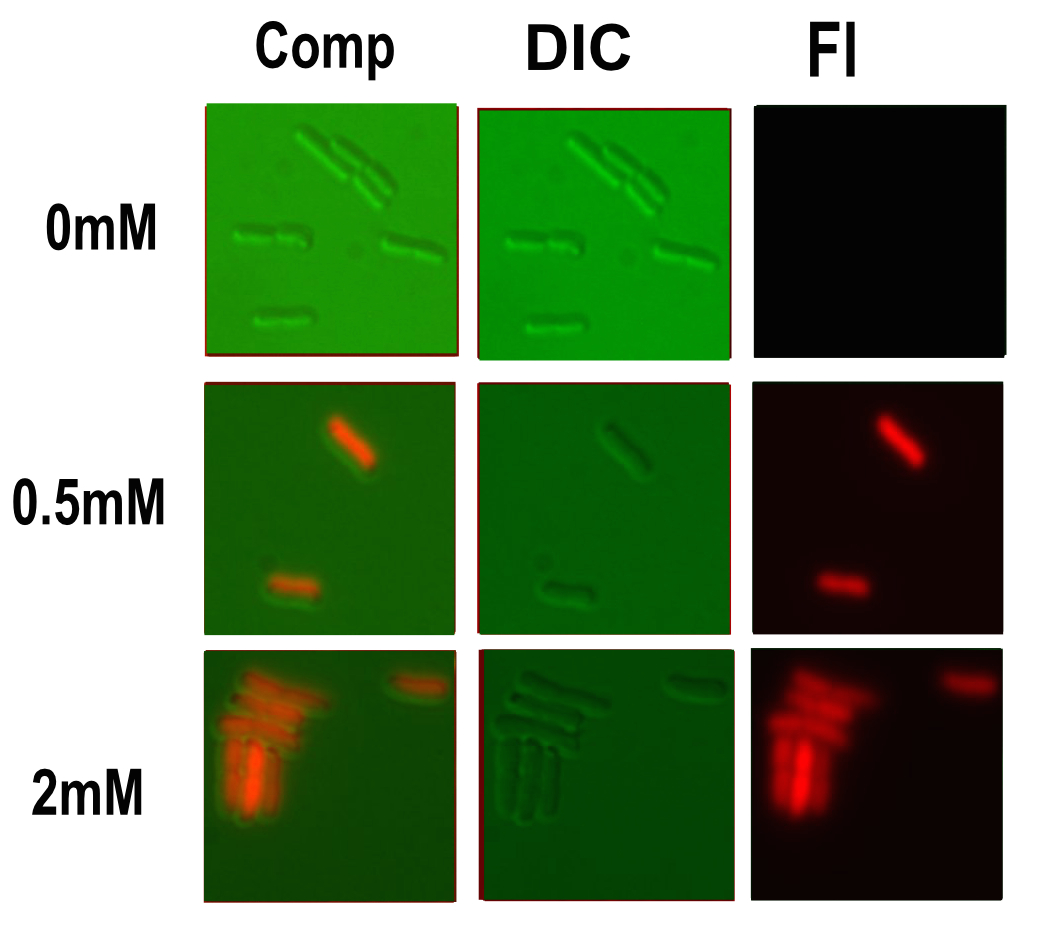
Microscopy was done in order to visually confirm the plate reader and flow cytometer experiments.
The experiment started with 5ml overnight cultures containing the appropriate antibiotic. Then in the morning 100μl of each colony was pipetted into 5ml of fresh LB with antibiotic and a range of copper concentrations and grown till the OD reached 0.4-0.6.
A flask of 1% agarose made with MilliQ was melted. 200μl of this was placed on a slide between two coverslips, flattened to get a nice smooth surface where the bacteria are immobile. 20μl of the culture are then added. The slide was then be viewed under a fluorescence microscope.
After finding the correct focal plane the slide was moved to find as many cells as possible to image. After focusing again an image of the DIC and fluorescence channels was obtained.
User Reviews
UNIQ70bef5a0c47c9ce5-partinfo-00000000-QINU UNIQ70bef5a0c47c9ce5-partinfo-00000001-QINU


