
Difference between revisions of "Part:BBa K608011"
Ivanjaubert (Talk | contribs) |
Ivanjaubert (Talk | contribs) |
||
| Line 167: | Line 167: | ||
<br/> | <br/> | ||
<br/> | <br/> | ||
| − | '''Summary:''' We compared the amount of GFP expressed under the medium constitutive promoter with strong, medium and weak RBS/GFP (PR4-GFP, PR5-GFP, PR6-GFP) in TOP10, BL21 (DE3) and DH5α cells lines. We were interested in | + | '''Summary:''' We compared the amount of GFP expressed under the medium constitutive promoter with strong, medium and weak RBS/GFP (PR4-GFP, PR5-GFP, PR6-GFP) in TOP10, BL21 (DE3) and DH5α cells lines. We were interested in replicating the original characterisation as the Freiburg 2011 team mentioned it needed to be replicated. We did so with 3 biological replicates and 3 technical replicates for each control. Additionally, we characterised these biobricks across different common E. coli strains to investigate the consistency across these strains. |
<br/> | <br/> | ||
<br/> | <br/> | ||
Revision as of 00:34, 22 October 2019
Medium promoter with medium RBS and GFP
Medium promoter from the constitutive promoter family combined with medium RBS (PR5) and GFP. To quantify the gene expression, GFP was tagged to the promoter RBS domain.
The GFP fluorescence was measured with a plate reader:

The fluorescence intensity and protein concentration were measured with the FLUOstar Omega,
which is a multi-mode microplate reader.
Samples were pipetted into the microplate and analyzed via the plate reader. In this experiment we focused on the protein concentration and the fluorescence intensity of RFP.
We measured the protein concentration with the bradford-assay. This is a method to determine the total protein
concentration. To analyze the protein concentration of the samples, Coomassie Brillant Blue was pippeted to each sample. With the binding of the dye to the proteins the color changes from dark red to blue. The more protein in the solution the more Coomassie dye can bind to proteins and the more the color changes into blue. The absorption of bound Coomassie dye is 595nm. The absorbance is proportional with the amount of bound dye. With a series of Bovine Serum Albumin (BSA) measurements the exact protein concentration of the samples can be determined. BSA acts like a “marker” because the concentration of BSA is known and with a linear calibration line the exact protein concentration can be detected.
GFP served as a reporter of expression. We wanted to know how strong the promoter and RBS activity is. With this reporter gene it was possible to analyze the expression via plate reader. GFP is excited at a wavelength of 509nm and has an emission of 520nm. The plate reader illuminates the samples with a high energy xenon flash lamp. Optical filters or monochromator create the exact wavelength. The more GFP in the sample the higher is the GFP fluorescence intensity. The intensity is collected with the second optical system and is detected with a side window photomultiplier tube.

Promoter and RBS:
PR1: strong Promoter (J23104) strong RBS (B0034)
PR2: strong Promoter (J23104) medium RBS (B0032)
PR3: strong Promoter (J23104) weak RBS (B0031)
PR4: medium Promoter (J23110) strong RBS (B0034)
PR5: medium Promoter (J23110) medium RBS (B0032)
PR6: medium Promoter (J23110) weak RBS (B0031)
| sample | PR2 | PR3 | PR4 | PR5 | PR6 |
| GFP fluorescence intensity | 11378.5 | 1445.0 | 4596.2 | 41221.1 | 26922.7 |
| factor | 7.9 | 1.0 | 3.2 | 28.5 | 18.6 |
The results of this test show that PR5 has 28.5 times higher expression of GFP in comparison with with PR3 which has the lowest expression. The fluorescence intensity of GFP varies, and because of lack of time we could not repeat this experiment. We have also tested the promotor and RBS activity with RFP as a reporter and the results deviate from this experiment. So we are looking forward to test this system another time.
SASTRA_Thanjavur 2019 Characterization - Effect of pH on promoter strength
In our experiment, we decided to study the effect of pH on biobrick BBa_K608011. This biobrick consists of a medium constitutive promoter (Bba_J23110) and a medium RBS (Bba_B0032) along with a reporter Green Fluorescent Protein (Bba_E0040).
We began our experiment with the transformation of the biobrick into E. coli DH5alpha cells. We then ventured into identifying the effect of pH on the biobrick’s activity. We know that the expression of the reporter protein relies on the plasmid copy number, binding affinity of ribosomes and RNA polymerase. These mechanisms depend on various environmental conditions including pH. We hypothesized that the expression of GFP would be maximum at an optimal pH of 7.2 and would subsequently decrease as the pH deviated from the optimal one, thus producing a bell-shaped curve when the pH is plotted against the GFP intensity.
This biobrick is present in plasmid pSB1C3, which harbours a chloramphenicol resistant gene for the selection of our transformants. Following the selection of our transformants, we decided to optimize the antibiotic concentration to achieve a balance between cell growth and plasmid selection.

We found out that the chloramphenicol concentration of 20ug/mL was the optimal concentration for our transformants and decided to keep this as our standard for all further experiments.
To characterize the biobrick, we decided to test its activity under different pH conditions. To achieve the optimal absorbance, our transformants were grown for 48 hours due to their slow growth rate, which can be attributed to the metabolic burden the plasmid imposes on the cells. The fluorescence was measured using a spectrofluorometer with excitation and emission wavelengths of 485nm and 520 nm respectively. This step was done to detect transformants that expressed GFP. Our experiment was performed in triplicates with LB media as our control to measure the background fluorescence.

Our results indicate that the fluorescence intensity was maximum at pH 7.2 (the standard pH of LB broth). Surprisingly, the intensity at pH 8 did not vary significantly from the intensity at pH 7.2 while the intensity at pH 6 deviated much more drastically. At pH values of 5 and 9, we found that the cell growth was extremely low and the absorbance at 595nm was similar to that of LB broth. However, we still proceeded to measure the fluorescence intensity at all 5 pH conditions.
From our experiment, we were able to conclude that pH 7.2 and 8 were optimal conditions for the expression of our biobrick. On the other hand, pH 6 was found to be suboptimal for GFP production. We suspect that this variation in GFP intensity could be due to the effect of pH on the plasmid copy number and the binding affinity of proteins involved in the transcription and translation machineries, such as RNA polymerases and ribosomes.
- 10COMPATIBLE WITH RFC[10]
- 12INCOMPATIBLE WITH RFC[12]Illegal NheI site found at 7
Illegal NheI site found at 30 - 21COMPATIBLE WITH RFC[21]
- 23COMPATIBLE WITH RFC[23]
- 25COMPATIBLE WITH RFC[25]
- 1000INCOMPATIBLE WITH RFC[1000]Illegal BsaI.rc site found at 706
Tongji_China 2019 Characterization
Our team tested the GFP fluorescence intensity and positive rate of PR3, PR5 and PR6 in E. coli TOP10 with a flow cytometry fluoresce (CytoFLEX LX, Beckman Coulter).
Protocol:
1. The plasmids obtained from 5L,5M,5O,plate 1, are respectively used to transform the TOP10 strain and coated on the LB plate with chloramphenicol. The kanamycin resistant plasmid pET-28a(+) is transformed into the TOP10 strain, which is coated on the LB plate with kanamycin as a negative control. The strain is cultured overnight at 37°C.
2. Pick 3 colonies each plates and culture them in 5 mL LB medium with chloramphenicol 12 hours.
3. 4800 rmp/min centrifugate 10 minutes,using 1.5 mL PBS to dilute the sediment.
4. Using the negative process control sample, adjust forward-scatter and side-scatter voltages to place the strong cell peak as close to the center of the detector range as possible.
5. Instrument gating should be set to ensure that no cell events are discarded.
6. 95% negative control samples’ GFP B525-FITC-A values are less than 104. Regard those samples the GFP B525-FITC-A values more than 104 are positive.
7. Collect at least 5000 events per sample.
Summary:
The results of this test show that in E. coli TOP10, PR5 has the highest GFP fluorescence intensity and positive rate among PR2, PR5 and PR6.


| Sample | PR2(BBa_K608008) | PR5(BBa_K608011) | PR6(BBa_K608012) |
| GFP Fluorescence Intensity | 24541.23 | 62923.91 | 41902.30 |
| Fluorescence Intensity Factor | 1.0 | 2.6 | 1.7 |
| Positive Rate | 0.7563 | 0.9190 | 0.8579 |
Team KCL_UK 2019
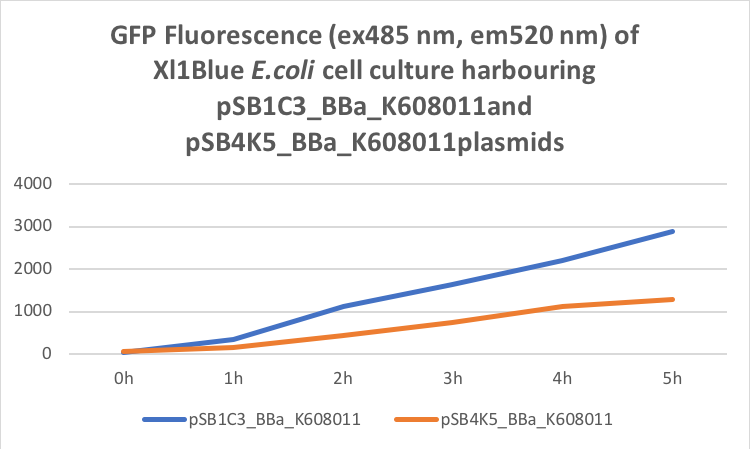
Our team have used this BBa_K608011 part as a fluorescent reporter to test our sRNA part. We aimed to create sRNA molecule that would bind to the GFP mRNA spanning the Ribosome Binding site and first two codons of the GFP gene. To use this BBa_K608011we first has to sub clone it into the pSB4K5 plasmid to ensure compatibility with the sRNA plasmid pSB1C3. We tested this BBa_K608011part in pSB1C3 and pSB4K5 plasmids in Xl1Blue E.coli. Xl1Blue E.coli cells were transformed with these plasmids and positive colonies were selected on LB agar plates containing Kanamycin (15 ug/ml) for pSB4K5 plasmids and Chloramphenicol (34 ug/ml) for pSB1C3 plasmids respectively. Single colony from each plate was inoculated into 10 ml LB media containing appropriate antibiotic and incubated overnight in a shaking incubator at 37 oC with shaking 200 rpm. After approximately 16 h of incubation E.coli cultures were diluted 1/10 with fresh 10 ml LB media containing Kanamycin (15 ug/ml) in 20 ml universal bottle. Each experiment was performed in duplicate. At this starting point 500 ul of the culture was collected into 1.5 ml centrifuge tube, labelled 0h incubation and stored on ice. The rest of the culture was incubated for 5 h in the shaking incubator at 37 oC with shaking 200 rpm with 500 ul samples taken every hour, labelled 1, 2, 3, 4 and 5 h incubation and stored on ice. In the end 200 ul of each duplicate sample was aliquoted into black clear bottom 96 well plate. Duplicate samples of LB media containing Kanamycin and Chloramphenicol respectively were used as negative control. The OD600 and fluorescence (ex485, em520) data was recorded using PHERAstar FS (BMG Labtech) 96well plate reader. Recorded results were normalised for LB media and average results of two duplicate samples are presented in tables 1 and 1 and figures 1 and 2.
Table 1. OD600 of Xl1Blue E.coli cell culture harbouring pSB1C3_BBa_K608011 and pSB4K5_BBa_K608011plasmids respectively.

Table 2. GFP Fluorescence (ex485 nm, em520 nm) of Xl1Blue E.coli cell culture harbouring pSB1C3_BBa_K608011 and pSB4K5_BBa_K608011plasmids respectively.

Figure 1. OD600 of Xl1Blue E.coli cell culture harbouring pSB1C3_BBa_K608011 and pSB4K5_BBa_K608011plasmids respectively.
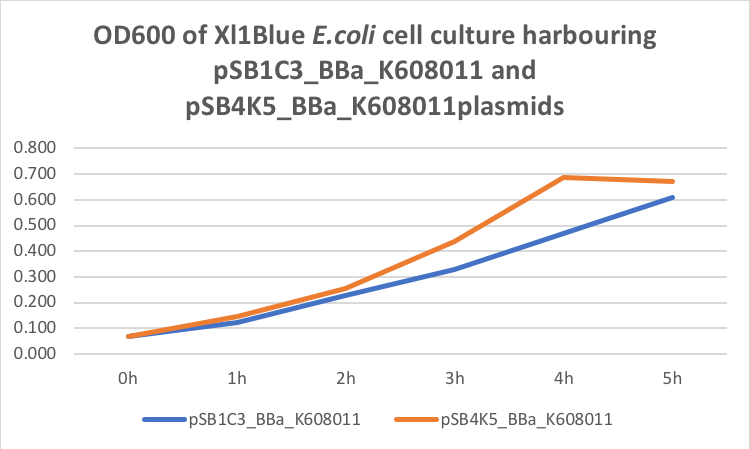
Figure 2. GFP Fluorescence (ex485 nm, em520 nm) of Xl1Blue E.coli cell culture harbouring pSB1C3_BBa_K608011and pSB4K5_BBa_K608011plasmids respectively.
Team University of Edinburgh 2019
Group: University of Edinburgh OG, 2019
Author: Francisco Ivan Rodriguez Jaubert and Cathal O’Reilly
Summary: We compared the amount of GFP expressed under the medium constitutive promoter with strong, medium and weak RBS/GFP (PR4-GFP, PR5-GFP, PR6-GFP) in TOP10, BL21 (DE3) and DH5α cells lines. We were interested in replicating the original characterisation as the Freiburg 2011 team mentioned it needed to be replicated. We did so with 3 biological replicates and 3 technical replicates for each control. Additionally, we characterised these biobricks across different common E. coli strains to investigate the consistency across these strains.
Methods
Biobricks were extracted and amplified from the iGEM kit 2019 following standard protocols. Transformation was performed following heat-shock standard protocols. Three positive colonies were picked containing each biobrick in each different cell line. The samples were repeated in series of three to ensure consistency. This was carried out by adding 200 μl of cell culture to wells of a 96-well microplate. The plate reader was set at 485nm wavelength and 520nm emission for analysis.
Results
The next graph shows the average of the three samples (repeated three times) for each biobrick (PR4-GFP, PR5-GFP, and PR6-GFP) in different strains with their respective GFP fluorescence intensity. The weakest RBS (PR6-GFP) in BL21 presents the highest GFP absorbance, in contrast with the Freiburg data showing that the medium RBS (PR5-GFP) had the highest GFP absorbance.

Our data suggests that in BL21 the highest GFP expression was led by the weakest RBS (PR6-GFP), followed by the strongest RBS (PR4-GFP), and finally the medium RBS (PR5-GFP).
TOP10 shows the highest GFP expression with the strongest RBS (PR4-GFP), followed by the medium RBS (PR5-GFP), and finally the weakest RBS (PR6-GFP).
DH5a shows the highest GFP expression with the strongest RBS (PR4-GFP), followed by the weakest RBS (PR6-GFP), and finally the medium RBS (PR5-GFP).
TOP10 is the only cell line showing consistency in the hierarchy of the strongest to the weakest RBS.