Difference between revisions of "Part:BBa K3174008"
Amacaskill (Talk | contribs) |
Amacaskill (Talk | contribs) (→Testing and Measurement) |
||
| Line 12: | Line 12: | ||
===Testing and Measurement=== | ===Testing and Measurement=== | ||
| − | [[File:SYFP2redesignFigure1.png| | + | |
| − | + | [[File:SYFP2redesignFigure1.png|430px|left|thumb|<b>Figure 1: Fluorescence histograms for TOP10 cells with the original SYFP2 plasmid.</b> The x-axis shows the intensity of | |
| − | + | ||
fluorescence on a logarithmic scale, and the y-axis displays the number of cells. Each line represents | fluorescence on a logarithmic scale, and the y-axis displays the number of cells. Each line represents | ||
a different day of propagation, and the shaded gray curve is a blank. Peaks to the right of the blank | a different day of propagation, and the shaded gray curve is a blank. Peaks to the right of the blank | ||
represent fluorescent cells while peaks on or to the left of the blank represent cells that have ceased | represent fluorescent cells while peaks on or to the left of the blank represent cells that have ceased | ||
| − | to be fluorescent. All replicates were grown under the same conditions. | + | to be fluorescent. All replicates were grown under the same conditions.]] |
| − | + | [[File:SYFP2redesignFigure2.png|430px|right|thumb|<b>Figure 2: Fluorescence histograms for TOP10 cells with the redesigned SYFP2 plasmid.</b> The x-axis shows the intensity | |
of fluorescence on a logarithmic scale, and the y-axis displays the number of cells. Each line | of fluorescence on a logarithmic scale, and the y-axis displays the number of cells. Each line | ||
represents a different day of propagation, and the shaded gray curve is a blank. Peaks to the right | represents a different day of propagation, and the shaded gray curve is a blank. Peaks to the right | ||
of the blank represent fluorescent cells while peaks on or to the left of the blank represent cells | of the blank represent fluorescent cells while peaks on or to the left of the blank represent cells | ||
that have ceased to be fluorescent. All replicates were grown under the same conditions. No data could | that have ceased to be fluorescent. All replicates were grown under the same conditions. No data could | ||
| − | be collected for Day 3 of Replicate 4. | + | be collected for Day 3 of Replicate 4.]] |
| + | |||
| + | |||
| − | |||
<span class='h3bb'>Sequence and Features</span> | <span class='h3bb'>Sequence and Features</span> | ||
Revision as of 16:07, 11 October 2019
SYFP2 coding sequence with IS hotspot removed
This is a redesigned version of the Super Yellow Fluorescent Protein 2 (BBa_K864100) that has had a region that was prone to insertion element mutations altered. This removal of a mutation hotspot resulted in the expression of SYFP2 in culture being maintained for a longer period of time than the original plasmid.
Usage and Biology
This part codes for the bright yellow fluorescent protein SYFP2, which has an excitation peak of 515 nm and an emission peak of 527 nm.
Testing and Measurement

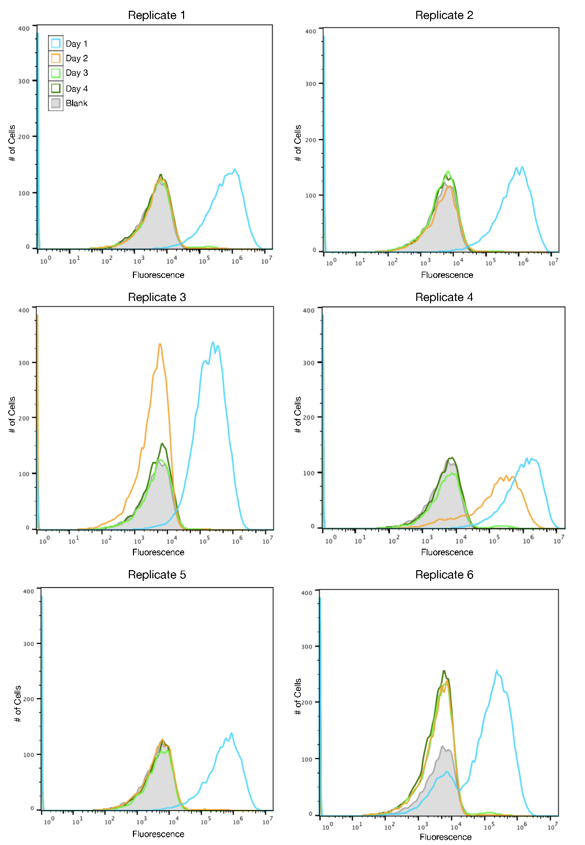
Figure 1: Fluorescence histograms for TOP10 cells with the original SYFP2 plasmid. The x-axis shows the intensity of fluorescence on a logarithmic scale, and the y-axis displays the number of cells. Each line represents a different day of propagation, and the shaded gray curve is a blank. Peaks to the right of the blank represent fluorescent cells while peaks on or to the left of the blank represent cells that have ceased to be fluorescent. All replicates were grown under the same conditions.

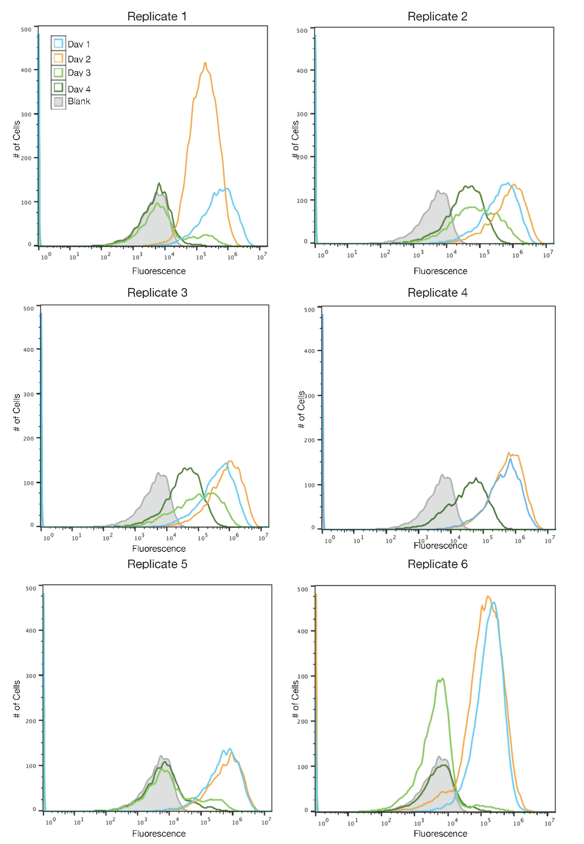
Figure 2: Fluorescence histograms for TOP10 cells with the redesigned SYFP2 plasmid. The x-axis shows the intensity of fluorescence on a logarithmic scale, and the y-axis displays the number of cells. Each line represents a different day of propagation, and the shaded gray curve is a blank. Peaks to the right of the blank represent fluorescent cells while peaks on or to the left of the blank represent cells that have ceased to be fluorescent. All replicates were grown under the same conditions. No data could be collected for Day 3 of Replicate 4.
Sequence and Features
Assembly Compatibility:
- 10COMPATIBLE WITH RFC[10]
- 12COMPATIBLE WITH RFC[12]
- 21COMPATIBLE WITH RFC[21]
- 23COMPATIBLE WITH RFC[23]
- 25COMPATIBLE WITH RFC[25]
- 1000COMPATIBLE WITH RFC[1000]
