|
|
| Line 1: |
Line 1: |
| | __NOTOC__ | | __NOTOC__ |
| − | <partinfo>BBa_K1688010 short</partinfo> | + | <partinfo>BBa_K1688004 short</partinfo> |
| | | | |
| − | The dTomato protein is a fluorescent dimer protein that emits orange-red light when it is excited by green-yellow light. The excitation wavelengths and the emission wavelengths don't overlap as much as in other fluorescent proteins, which makes it preferable to use – especially in self‑made fluorometry tests.
| + | Assembly of Anderson promoter BBa_J23101 and RBS + dTomato (BBa_K1688004). dTomato has not been bricked previously. |
| | | | |
| − | <partinfo>BBa_K1688010 SequenceAndFeatures</partinfo> | + | <partinfo>BBa_K1688004 SequenceAndFeatures</partinfo> |
| | + | [[File:uppsala_dtomato.jpg]] |
| | | | |
| | + | Figure 1. dTomato expressed in ''E. coli'' DH5-alpha with an |
| | + | inducible promoter. |
| | | | |
| | | | |
| − | == Characterization == | + | == Usage and Biology== |
| | | | |
| − | dTomato was characterized by duplicate measurements in a self-made fluorometer consisting of an Arduino microcontroller, two green LEDs as light source, a longpass optical filter at 590 nm (FGL590) as emission filter, and a light sensor (TSL250R) that outputs an analog signal with the voltage being directly proportional to the incoming light intensity. These components were attached to a 3D-printed 1.5 ml cuvette holder chamber (designed by Dr. Erik Gullberg). The LEDs have a peak at around 525 nm with maximum wavelength slightly above 590nm, and we chose them in order to avoid the purchase of excitation filters as filters are more expensive than LEDs. The dTomato excitation peak is at 554 nm and 50% of it is at 510 nm. Also, its emission peak is at 581 nm and its 50% emission at 629 nm (Figure 1). Thus, by choosing this type of LEDs, the dTomato protein can be excited (the LED at its peak (525nm) excites the protein at its 60.85%) and we also avoid to interfere much with the emitted light and the longpass filter at 590nm (Figure 2). The wavelengths of the LED-light can therefore be neglected. | + | The dTomato protein is a fluorescent protein dimer, created by direct evolution of the wild-type DsRed, from Discosoma sp. (Shaner et al, - Improved monomeric red, orange and yellow fluorescent proteins derived from ''Discosoma sp.'' red fluorescent protein, 2004). The dTomato protein is a fluorescent dimer protein that emits orange-red light when it is excited by green-yellow light. It is preferable to use – especially in self-made fluorometry tests – because the excitation wavelengths and the emission wavelengths don't overlap as much as in other fluorescent proteins. The dTomato excitation peak is at 554 nm and 50% of it is at 510 nm. Also, its emission peak is at 581 nm and its 50% emission at 629 nm (Figure 2). |
| | | | |
| | + | [[File:Uppsala2015_dTomato_Chromatogram.png]] |
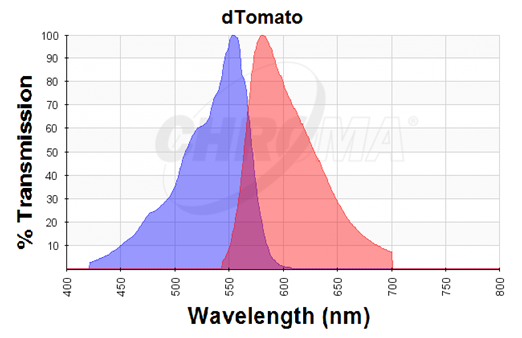
| | + | Figure 2. Excitation (blue curve) and emission (red curve) spectra for the dTomato fluorescent protein (the graph is designed with the following tool: https://www.chroma.com/spectra-viewer) |
| | | | |
| − | [[File:Uppsala2015_dTomato_Chromatogram.png]]
| + | == References == |
| − | '''''Figure 1.''' Excitation (blue curve) and emission (red curve) spectra for the dTomato fluorescent protein (the graph is designed with the following tool: https://www.chroma.com/spectra-viewer)''
| + | Nathan C Shaner, Robert E Campbell, Paul A Steinbach, Ben N G Giepmans, Amy E Palmer & Roger Y Tsien. “Improved monomeric red, orange and yellow fluorescent proteins derived from Discosoma sp. red fluorescent protein”, 2004 |
| − | | + | |
| − | | + | |
| − | [[File:Uppsala2015_Filter_Transmission.png]]
| + | |
| − | '''''Figure 2.''' The region shaded in blue represents the range over which this filter is transmissive. At wavelengths shorter than the cut-on wavelength, the filter blocks the light. Transmission is plotted including surface reflections''
| + | |
| − | | + | |
| − | To avoid direct emission from the source light, the cuvette holder was designed so that the filter is placed in an angle of 90° to the two LED source lights (Figure 3).
| + | |
| − | | + | |
| − | | + | |
| − | [[File:Uppsala2015_Fluorometer.png]]
| + | |
| − | '''''Figure 3.''' A sliced model of the 3D-printed cuvette chamber''
| + | |
| − | | + | |
| − | ===Method=== | + | |
| − | | + | |
| − | A comparison mode measurement was conducted (in a dark room), where dTomato (BBa_K1688004) was assembled with each of two different standard constitutive Anderson promoters – BBa_J23101 (this construct) and BBa_J23110 (construct BBa_K1688011) respectively. For each construct, four different colonies from the same plate were used for overnight cultures. Each sample was then measured twice. Overnight cell cultures who had been prepared one day ahead of the others ("two-nights cultures") were also measured. The results were compared with measurements in the flow cytometer MACSQuant VYB.
| + | |
| − | | + | |
| − | ===Results===
| + | |
| − | | + | |
| − | Three of the four cultures of J23101 had highly similar fluorescence values and the one day/night older culture had about the double intensity (Figure 4), which was as expected.
| + | |
| − | | + | |
| − | [[File: Uppsala2015_J23101_Fluorescence.png]]
| + | |
| − | '''''Figure 4.''' Comparison of the fluorescence in J23101 cultures''
| + | |
| − | | + | |
| − | | + | |
| − | The fluorescence intensity in the J23110 cultures were more divergent, but it could still be seen that the older culture had a much higher intensity (Figure 5).
| + | |
| − | | + | |
| − | [[File: Uppsala2015_J23110_Fluorescence.png]]
| + | |
| − | '''''Figure 5.''' Comparison of the fluorescence in J23110 cultures''
| + | |
| − | | + | |
| − | | + | |
| − | When the average values of the two promoter cultures were compared, it could be seen that fluorescence intensity was generally higher in J23110 cultures. The average values are plotted together with the older cultures in Figure 6.
| + | |
| − | | + | |
| − | [[File: Uppsala2015_Average_Fluorescence.png]]
| + | |
| − | '''''Figure 6.''' Average (AVG) values of J23101and J23110 cultures respectively, along with older cultures''
| + | |
| − | | + | |
| − | | + | |
| − | For comparison with the MACS results (Figures 7 and 8), the average values of the duplicate fluorometer measurements for each of the two promoters were scaled down – 20 times for J23101 and 25 times for J23110. The reason for this was because the MACS and the fluorometer have different reference points for their output values.
| + | |
| − | | + | |
| − | [[File: Uppsala2015_J23101_Fluorescence_MACS.png]]
| + | |
| − | '''''Figure 7.''' The average of the four J23101+dT cultures (C1-4) compared to MACS-tests''
| + | |
| − | | + | |
| − | | + | |
| − | [[File: Uppsala2015_J23110_Fluorescence_MACS.png]]
| + | |
| − | '''''Figure 8.''' The average of the four J23110+dT cultures (C1-4) compared to MACS-tests''
| + | |
| − | | + | |
| − | | + | |
| − | However, the MACS gave some other values when it only measured the fluorescence of the living cells (P8 measurement). Of course, the custom-made fluorometer does not have the capability to measure this detail. The comparison results of the data-sets for J23101 are shown in Figure 9.
| + | |
| − | | + | |
| − | [[File: Uppsala2015_J23101_P8.png]]
| + | |
| − | '''''Figure 9.''' The P8 measurement of MACS compared with the fluorometer results for the J23101 cultures''
| + | |
| − | | + | |
| − | | + | |
| − | ===Discussion===
| + | |
| − | | + | |
| − | The data from the fluorometer and the MACS correlate in a somewhat good way, but there is a bad correlation when the MACS only measures the living cells of J23101 promoter. One possible reason to why that happens is that the J23101 promoter might be so strong that it kills the cells by limitless expression along with the high plasmid copy number, pSB1, that was used. The J23110 promoter is supposed to have half the expression rate and this might result in more cells surviving the high loads of the pSB1 plasmid. A possible solution could be to insert the promoters in a lower copy plasmid (e.g. pSB3) and then run the experiments again.
| + | |
| − | | + | |
| − | Nevertheless, another valuable explanation for many of the abnormalities gotten, a possible source of error could be the built-up of the custom-made fluorometer, since it was in its prototype stage. In prototyping stages, sometimes you have to use long cables and unstable connections that have a tendency to produce noise with the slightest movement of the circuit, or even the change of electric field if someone went close to it without even a direct contact.
| + | |
Assembly of Anderson promoter BBa_J23101 and RBS + dTomato (BBa_K1688004). dTomato has not been bricked previously.
Figure 1. dTomato expressed in E. coli DH5-alpha with an
inducible promoter.
The dTomato protein is a fluorescent protein dimer, created by direct evolution of the wild-type DsRed, from Discosoma sp. (Shaner et al, - Improved monomeric red, orange and yellow fluorescent proteins derived from Discosoma sp. red fluorescent protein, 2004). The dTomato protein is a fluorescent dimer protein that emits orange-red light when it is excited by green-yellow light. It is preferable to use – especially in self-made fluorometry tests – because the excitation wavelengths and the emission wavelengths don't overlap as much as in other fluorescent proteins. The dTomato excitation peak is at 554 nm and 50% of it is at 510 nm. Also, its emission peak is at 581 nm and its 50% emission at 629 nm (Figure 2).
Figure 2. Excitation (blue curve) and emission (red curve) spectra for the dTomato fluorescent protein (the graph is designed with the following tool: https://www.chroma.com/spectra-viewer)
Nathan C Shaner, Robert E Campbell, Paul A Steinbach, Ben N G Giepmans, Amy E Palmer & Roger Y Tsien. “Improved monomeric red, orange and yellow fluorescent proteins derived from Discosoma sp. red fluorescent protein”, 2004