
Difference between revisions of "Part:BBa K1688010"
(Created page with "The dTomato protein is a fluorescent dimer protein that emits orange-red light when it is excited by green-yellow light. The excitation wavelengths and the emission wavelengths d...") |
|||
| Line 1: | Line 1: | ||
| − | The dTomato protein is a fluorescent dimer protein that emits orange-red light when it is excited by green-yellow light. | + | The dTomato protein is a fluorescent dimer protein that emits orange-red light when it is excited by green-yellow light. It is preferable to use – especially in self-made fluorometry tests – because the excitation wavelengths and the emission wavelengths don't overlap as much as in other fluorescent proteins. The dTomato excitation peak is at 554 nm and 50% of it is at 510 nm. Also, its emission peak is at 581 nm and its 50% emission at 629 nm (Figure 1). Characterization has been made with the Anderson promoters BBa_J23101(this construct) and BBa_J23110 (construct BBa_K1688011) |
| + | |||
| + | [[File:Uppsala2015_dTomato_Chromatogram.png]] | ||
| + | Figure 1. Excitation (blue curve) and emission (red curve) spectra for the dTomato fluorescent protein (the graph is designed with the following tool: https://www.chroma.com/spectra-viewer) | ||
Revision as of 21:02, 15 September 2015
The dTomato protein is a fluorescent dimer protein that emits orange-red light when it is excited by green-yellow light. It is preferable to use – especially in self-made fluorometry tests – because the excitation wavelengths and the emission wavelengths don't overlap as much as in other fluorescent proteins. The dTomato excitation peak is at 554 nm and 50% of it is at 510 nm. Also, its emission peak is at 581 nm and its 50% emission at 629 nm (Figure 1). Characterization has been made with the Anderson promoters BBa_J23101(this construct) and BBa_J23110 (construct BBa_K1688011)
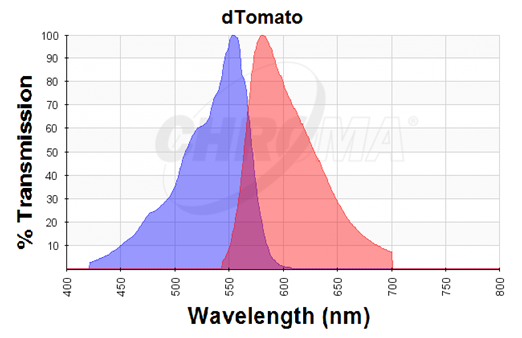

Figure 1. Excitation (blue curve) and emission (red curve) spectra for the dTomato fluorescent protein (the graph is designed with the following tool: https://www.chroma.com/spectra-viewer)