Difference between revisions of "Part:BBa K1159200"
(→Characterization by iGEM Kyoto 2019) |
|||
| Line 53: | Line 53: | ||
As shown in Fig. 1, conjugated bands become evident gradually (labeled with arrow). Signals were quantified and summarized in Fig. 2. The reaction looks saturated after 360 minutes, even though substrates still remain a lot. This might be explained by water evaporation while incubation. Otherwise, it is possible that a bound protein prevents another protein from binding to near sites on a capsule cage. If it is the case, it might limit the number of binding proteins on a capsule.<br><br> | As shown in Fig. 1, conjugated bands become evident gradually (labeled with arrow). Signals were quantified and summarized in Fig. 2. The reaction looks saturated after 360 minutes, even though substrates still remain a lot. This might be explained by water evaporation while incubation. Otherwise, it is possible that a bound protein prevents another protein from binding to near sites on a capsule cage. If it is the case, it might limit the number of binding proteins on a capsule.<br><br> | ||
| − | [[File:191001 SPYt-SPYC 2.png| | + | [[File:191001 SPYt-SPYC 2.png|410px|thumb|left|Fig. 1 Time development of SpyCatcher-Tag bond formation |
3µL of SpyCatcher protein (SpyC) solution and 3µL of SpyTag inserted TmEncapsulin (SpyTmEnc) solution was mixed, then placed for several times at room temperature (10 min, 30 min, 60 min, 180 min, 360 min, 1200 min). The concentrations of protein solutions are SpyC: 500ng/µL SpyTmEnc: 1000ng/µL. The reaction was stopped by adding 2x SDS sample buffer. Mixed samples were assessed with SDS-PAGE for 30 min in 200V. CBB-stained. | 3µL of SpyCatcher protein (SpyC) solution and 3µL of SpyTag inserted TmEncapsulin (SpyTmEnc) solution was mixed, then placed for several times at room temperature (10 min, 30 min, 60 min, 180 min, 360 min, 1200 min). The concentrations of protein solutions are SpyC: 500ng/µL SpyTmEnc: 1000ng/µL. The reaction was stopped by adding 2x SDS sample buffer. Mixed samples were assessed with SDS-PAGE for 30 min in 200V. CBB-stained. | ||
]] | ]] | ||
| Line 59: | Line 59: | ||
Conjugated bands’ intensity was quantified with ImageJ. Orange dots show averages value of three experiments. Blacklines show standard deviations. The time point 60min was deleted because it included negative value. | Conjugated bands’ intensity was quantified with ImageJ. Orange dots show averages value of three experiments. Blacklines show standard deviations. The time point 60min was deleted because it included negative value. | ||
]] | ]] | ||
| + | |||
== Reference == | == Reference == | ||
1 Putri, R.M., Allende-Ballestero, C., Luque, D., Klem, R., Rousou, K.A., Liu, A., Traulsen, C.H.H., Rurup, W.F., Koay, M.S.T., Castón, J.R., et al. (2017). | 1 Putri, R.M., Allende-Ballestero, C., Luque, D., Klem, R., Rousou, K.A., Liu, A., Traulsen, C.H.H., Rurup, W.F., Koay, M.S.T., Castón, J.R., et al. (2017). | ||
Revision as of 01:03, 21 October 2019
Splitted and engineered N-terminal FbaB for isopeptide bound formation (SpyCatcher) in RFC[25]
| Improved Part | |
|---|---|
| BioBrick Nr. | BBa_K2273015 |
| Submitted by | [http://2017.igem.org/Team:TU_Dresden TU Dresden] |
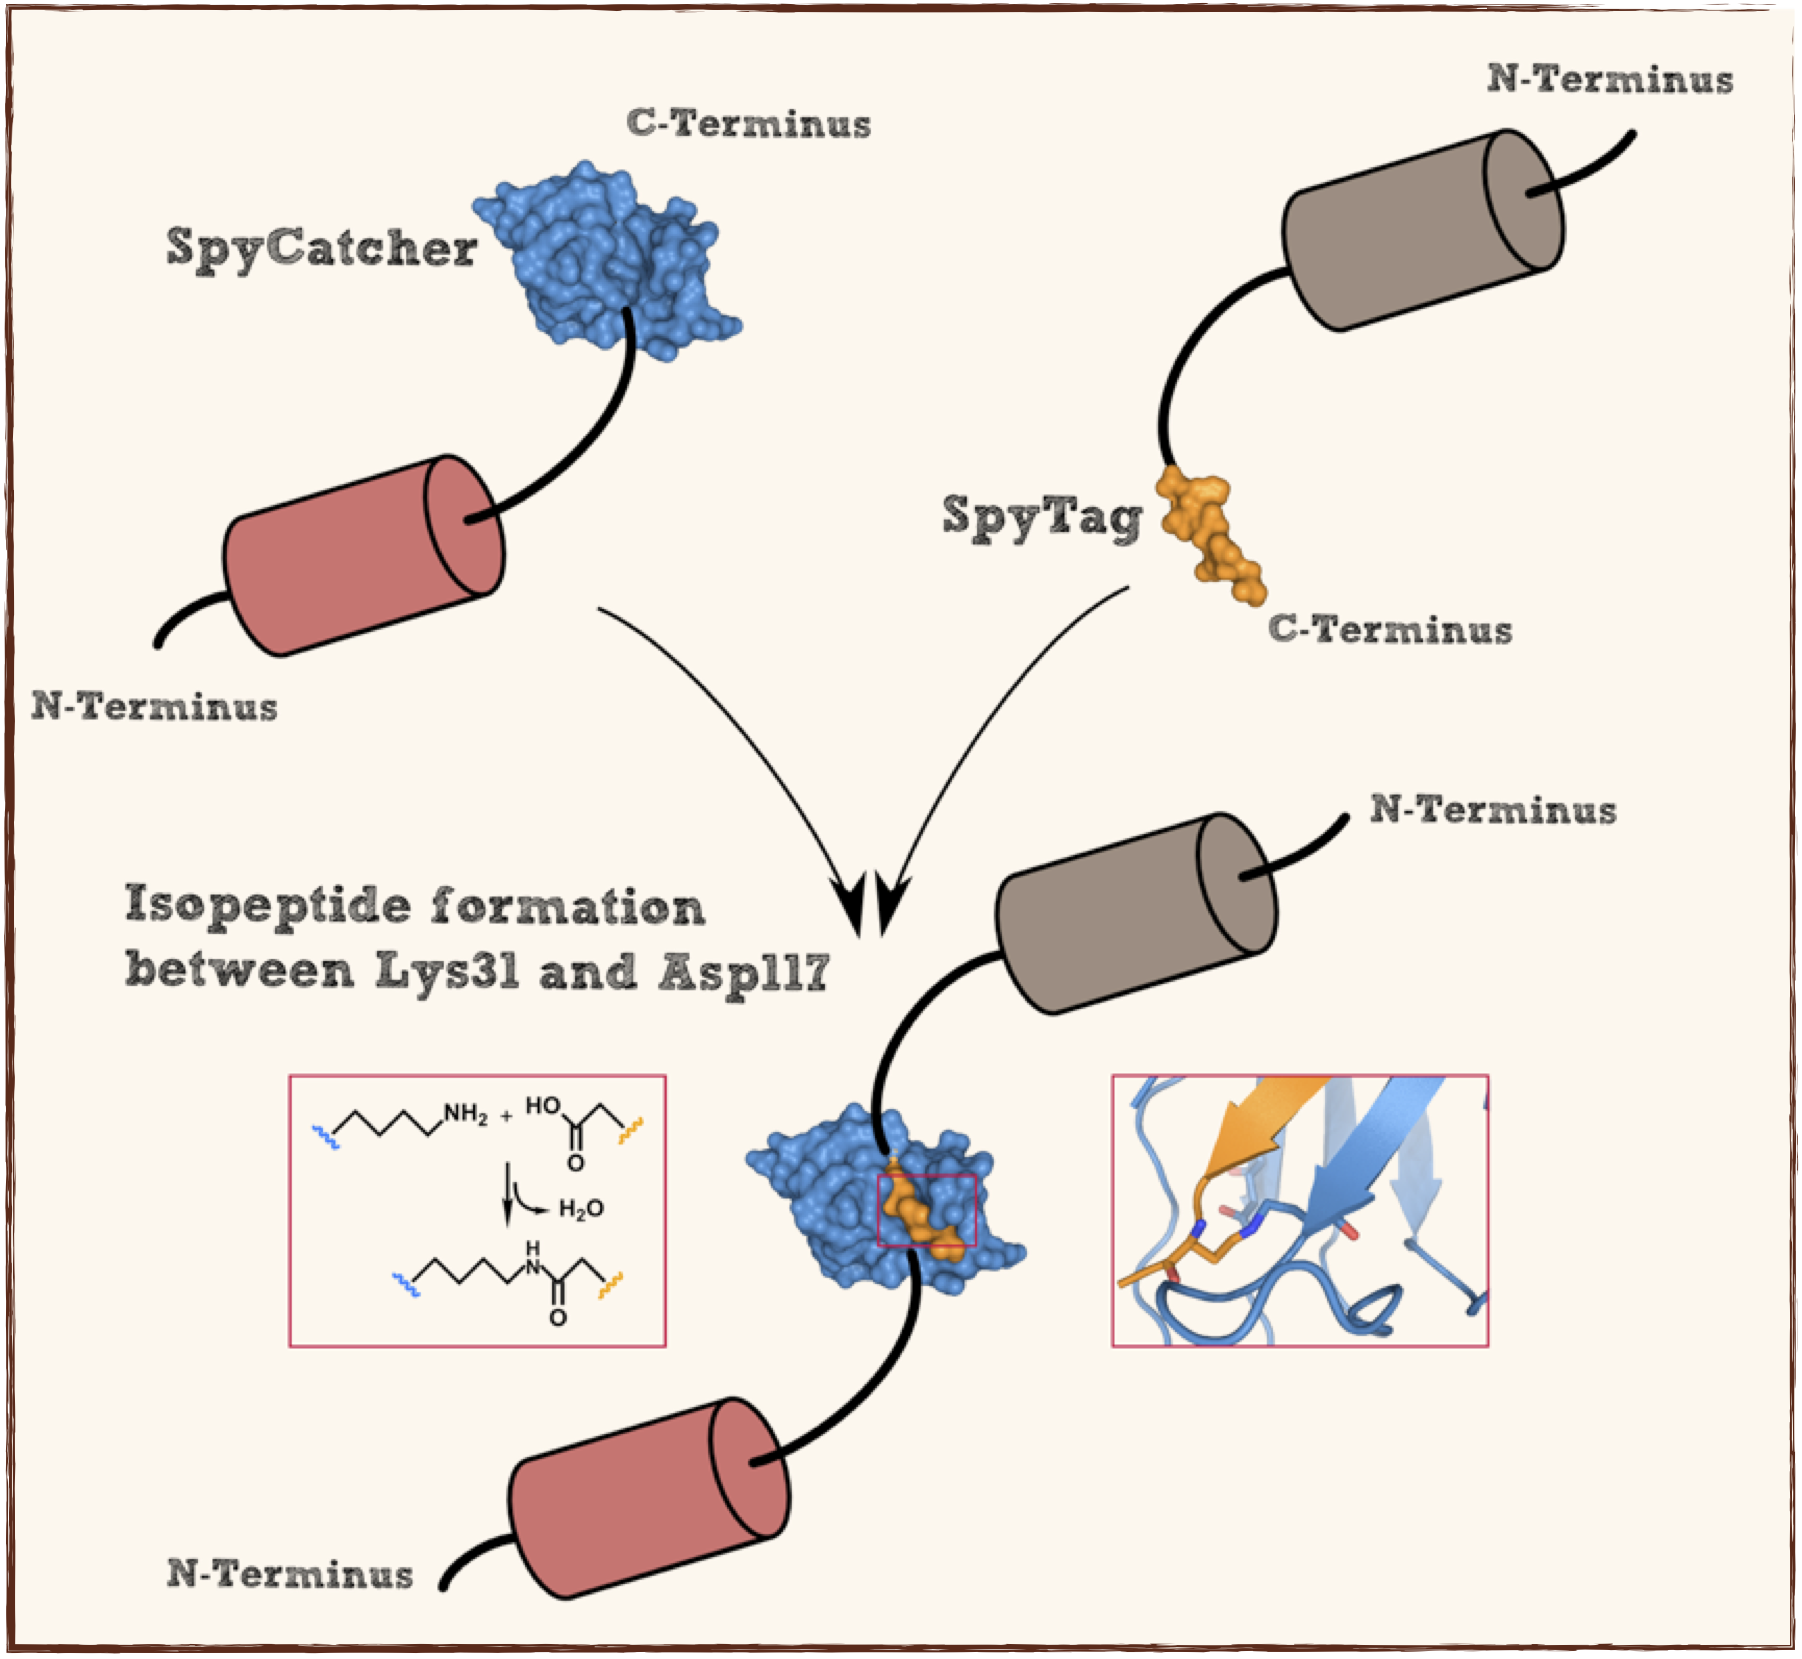
This part codes for a protein that recognizes and forms a covalent isopeptide bound to a oligopeptide. That oligopeptide can be found under BBa_K1159201. In contrast to the original SpyCatcher this part only contains the essential part for forming isopeptide bounds and does not contain a N-terminal His-tag and TEV cleavage site. Furthermore two amino acids were exchanged to improve the function, Ile34 was replaced by Glu34 which enhances the reaction rate, also the exposed hydrophobic redidue Met69 was replaced by Tyr69. This part is flanked by RFC[25] pre- and suffix for further protein fusions.
Experimental Evidence
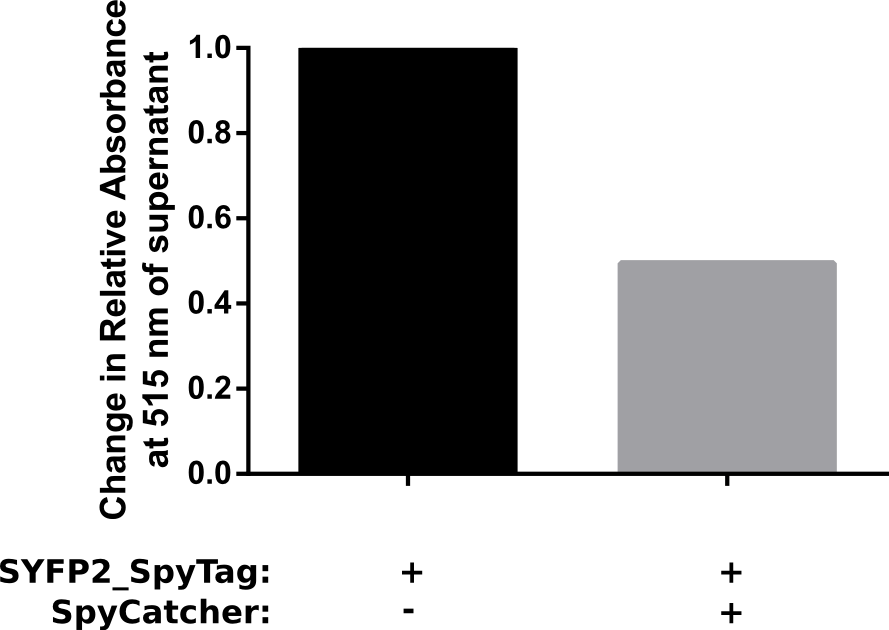
Proper funtion of the construct was verified in a pulldown assay using 10 μM of SpyCatcher with N-terminal HisTag which was incubated with 5 μM of C-terminal spytagged SYFP2 for 1 h in PBS. Afterwards HisTag beads were added to bind the fusion product, resulting in a decrease of spytagged SYFP2 in the supernatant. The results of this assay are shown in Figure 2. The results show that after one hour at room temeperature, a two fold change in relative absorbance was observed. This verifies that the construct is working as intended.
Furthermore the two interaction partners were mixed, incubated and analyzed via SDS Page (reducing conditions) and coomassie staining.
Improvment
Inspired by the self-catalysis, Peking iGEM 2016 fused three SpyTag spaced by (VPGVG)4 with 6xHistag in N-terminal and other functional protein modules in C-terminal. The network forming capacity is not affected. Moreover, E.coli has successfully secreted our fused protein when a few of specific signal peptides are added.
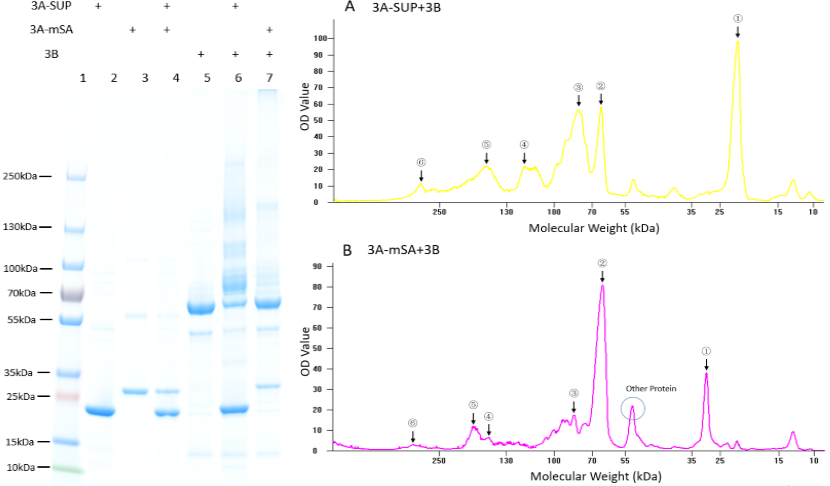
Fig. 1. Exploration of the polymerization ability of the 3A-SUP/3A-mSA with 3B. Left: the Coomassie Blue staining gel of basic experiment, which illustrates the basic cross-linking ability of 3A-SUP/3A-mSA and 3B. Lane 1, Thermo® Protein Marker; lane 2, 3A-SUP; lane 3, 3A-mSA; lane 4, 3A-SUP+3A-mSA; lane5, 3B; lane 6, 3A-SUP+3B; lane 7, 3A-mSA+3B. (Molecular Weight: 3A-SUP, 21.4kDa; 3A-mSA, 25.4kDa; 3B, 55.4(62) kDa. Right: A, the OD value of the lane 5 of oligomers produced by the mix of 3A-SUP and 3B. Peaks illustrate the monomers and the possible products, ①, 3A-SUP (21.4kDa); ②, 3B (62kDa); ③, 1x 3A-SUP+1x 3B (83.4kDa); ④, 3x 3A-SUP+1x 3B (126.2kDa); ⑤, 2x 3A-SUP+2x 3B (166.8kDa); ⑥, 4x 3A-SUP+4x 3B (333.6kDa). B, the OD value of the lane 6 of oligomers produced by the mix of 3A-mSA and 3B. Peaks illustrate the monomers and the possible products, ①, 3A-mSA (25.4kDa); ②, 3B (62kDa); ③, 1x 3A-mSA+1x 3B (87.4kDa); ④, 1x 3A-mSA+2x 3B (149.4kDa); ⑤, 2x 3A-mSA+2x 3B (174.4kDa); ⑥, 3x 3A-mSA+4x 3B (324.2kDa). (The software lane 1D was used to draw the graph.) (“3A-SUP” stands for “Triple SpyTag-SUP”, “3A-mSA” for “Triple SpyTag-mSA”, and “3B” is the abbreviation of “Triple SpyCatcher”)
We found that some new bands appeared above the band of 3B when it was mixed with monomers containing A, which demonstrated that our idea of forming functional hydrogel was executable. The products were mainly oligomers (Fig. 2 A-F, Table 1), for it is easy to form loops, which hindered the linkage between different monomers at such low concentration. Interestingly, with the restriction that A is equal to B in number, and the content of 3B was constant initially, the crosslinking ability at low concentration of these monomers were different with each other by comparing the surplus content of 3B. What’s more, it was surprising that the position of 3B band (~62kDa) was not accord with its theoretical weight (55.4kDa). Further experiments will be done to understand the differences.
If you want to learn more about Peking’s polymer network and the role of SUP in this network, please click here https://parts.igem.org/Part:BBa_K1989000", https://parts.igem.org/Part:BBa_K1989001" or https://parts.igem.org/Part:BBa_K1989002".
Reference
http://www.ncbi.nlm.nih.gov/pubmed/22366317 Zakeri et al., 2012 Zakeri B, Fierer JO, Celik E, Chittock EC, Schwarz-Linek U, Moy VT, Howarth M. (2012). Peptide tag forming a rapid covalent bond to a protein, through engineering a bacterial adhesin. Proc Natl Acad Sci U S A. 20;109(12)
Characterization by iGEM Kyoto 2019
We measured the time development of SpyCatcher-SpyTag bond formation. Here, we show the time development of bond formation between SpyCatcher and "SpyTag inserted TmEncapsulin". SpyTag inserted TmEncapsulin(BBa_K3185000) is one of our basic protein-coding part. SpyTag inserted TmEncapsulin forms capsule, Virus-like particle, spontaneously as 60mer[1]. In this part, SpyTag is exposed to the surface of the protein capsule. So we can display SpyCatcher-fused protein on the capsule.
In the experiment, an equal amount of SpyCatcher protein (SpyC) and SpyTag inserted TmEncapsulin (SpyTmEnc) were mixed and incubated at room temperature. At different time points, 10 min, 30 min, 60 min, 180 min, 360 min, 1200 min, the reaction was stopped by adding 2x SDS sample buffer. Mixed samples were assessed with SDS-PAGE. The intensities of the conjugated bands were quantified.
As shown in Fig. 1, conjugated bands become evident gradually (labeled with arrow). Signals were quantified and summarized in Fig. 2. The reaction looks saturated after 360 minutes, even though substrates still remain a lot. This might be explained by water evaporation while incubation. Otherwise, it is possible that a bound protein prevents another protein from binding to near sites on a capsule cage. If it is the case, it might limit the number of binding proteins on a capsule.

Reference
1 Putri, R.M., Allende-Ballestero, C., Luque, D., Klem, R., Rousou, K.A., Liu, A., Traulsen, C.H.H., Rurup, W.F., Koay, M.S.T., Castón, J.R., et al. (2017).
Structural Characterization of Native and Modified Encapsulins as Nanoplatforms for in Vitro Catalysis and Cellular Uptake.
ACS Nano 11, 12796–12804.
Sequence and Features
- 10COMPATIBLE WITH RFC[10]
- 12COMPATIBLE WITH RFC[12]
- 21COMPATIBLE WITH RFC[21]
- 23COMPATIBLE WITH RFC[23]
- 25COMPATIBLE WITH RFC[25]
- 1000COMPATIBLE WITH RFC[1000]
| Protein data table for BioBrick BBa_ automatically created by the BioBrick-AutoAnnotator version 1.0 | ||||||||||||||||||||||||||||||||||||||||||||||
|---|---|---|---|---|---|---|---|---|---|---|---|---|---|---|---|---|---|---|---|---|---|---|---|---|---|---|---|---|---|---|---|---|---|---|---|---|---|---|---|---|---|---|---|---|---|---|
| Nucleotide sequence in RFC 25, so ATGGCCGGC and ACCGGT were added (in italics) to the 5' and 3' ends: (underlined part encodes the protein) ATGGCCGGCGTTGATACC ... GCTCATATTACCGGT ORF from nucleotide position -8 to 345 (excluding stop-codon) | ||||||||||||||||||||||||||||||||||||||||||||||
Amino acid sequence: (RFC 25 scars in shown in bold, other sequence features underlined; both given below)
| ||||||||||||||||||||||||||||||||||||||||||||||
Sequence features: (with their position in the amino acid sequence, see the list of supported features)
| ||||||||||||||||||||||||||||||||||||||||||||||
Amino acid composition:
| ||||||||||||||||||||||||||||||||||||||||||||||
Amino acid counting
| Biochemical parameters
| |||||||||||||||||||||||||||||||||||||||||||||
| Plot for hydrophobicity, charge, predicted secondary structure, solvent accessability, transmembrane helices and disulfid bridges | ||||||||||||||||||||||||||||||||||||||||||||||
Codon usage
| ||||||||||||||||||||||||||||||||||||||||||||||
Alignments (obtained from PredictProtein.org)
| ||||||||||||||||||||||||||||||||||||||||||||||
| Predictions (obtained from PredictProtein.org) | ||||||||||||||||||||||||||||||||||||||||||||||
Subcellular Localization (reliability in brackets)
| Gene Ontology (reliability in brackets)
| |||||||||||||||||||||||||||||||||||||||||||||
Predicted features:
| ||||||||||||||||||||||||||||||||||||||||||||||
| The BioBrick-AutoAnnotator was created by TU-Munich 2013 iGEM team. For more information please see the documentation. If you have any questions, comments or suggestions, please leave us a comment. | ||||||||||||||||||||||||||||||||||||||||||||||
This part has been improved:BBa_K2273015


