
File:TU Eindhoven mNeonGreen EmissionScan.png
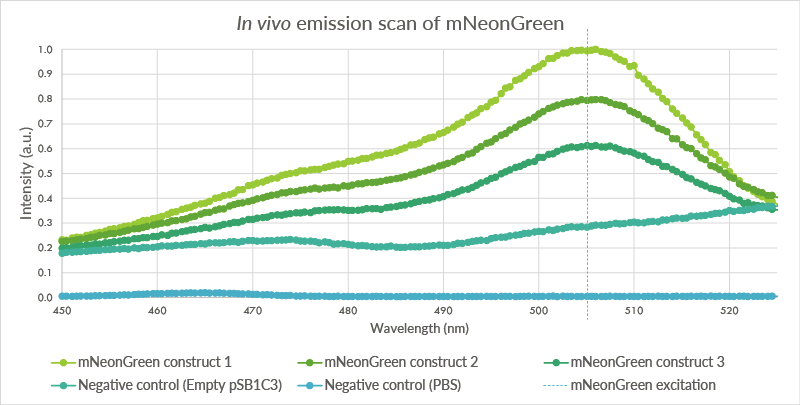
Revision as of 23:23, 18 September 2015 by S136969 (Talk | contribs) (An in vivo emissions scan was conducted for mNeonGreen in the BL21(DE3) cells. The cells containing mNeonGreen show a peak at 506 nm. The first negative control, BL21(DE3) cells with the empty pSB1C3 plasmid do not show such a peak. The second negative co)
No higher resolution available.
TU_Eindhoven_mNeonGreen_EmissionScan.png (800 × 405 pixels, file size: 64 KB, MIME type: image/png)
An in vivo emissions scan was conducted for mNeonGreen in the BL21(DE3) cells. The cells containing mNeonGreen show a peak at 506 nm. The first negative control, BL21(DE3) cells with the empty pSB1C3 plasmid do not show such a peak. The second negative control, pure PBS, shows almost no fluorescence. The higher level of fluorescence of the BL21(DE3) cells is possibly caused by autofluorescence.
File history
Click on a date/time to view the file as it appeared at that time.
| Date/Time | Thumbnail | Dimensions | User | Comment | |
|---|---|---|---|---|---|
| current | 23:23, 18 September 2015 | | 800 × 405 (64 KB) | S136969 (Talk | contribs) | An in vivo emissions scan was conducted for mNeonGreen in the BL21(DE3) cells. The cells containing mNeonGreen show a peak at 506 nm. The first negative control, BL21(DE3) cells with the empty pSB1C3 plasmid do not show such a peak. The second negative co |
- You cannot overwrite this file.
File usage
The following page links to this file: