
File:Plate reader 1.png
Revision as of 02:32, 28 October 2017 by Kshitijrai (Talk | contribs) (Fig. 1 Total Intensity in the encapsulated droplet over time. Since photobleaching is known to be a first order process, we have fitted an exponential curve to the data. The high R-squared value implies a good fit of the exponential model to the data....)
Size of this preview: 800 × 458 pixels. Other resolution: 320 × 183 pixels.
Original file (1,516 × 867 pixels, file size: 74 KB, MIME type: image/png)
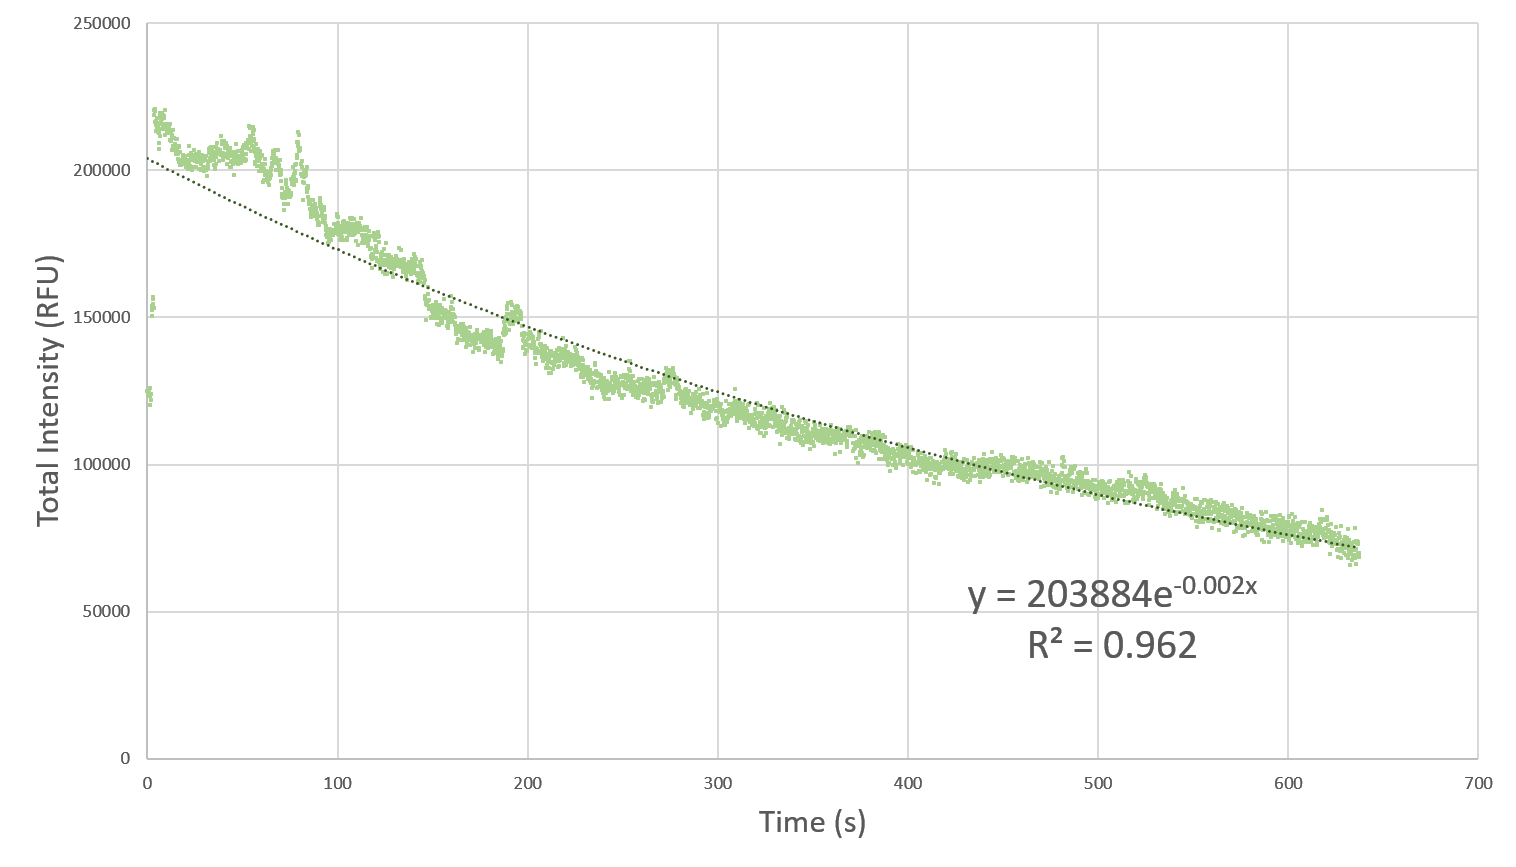
Fig. 1 Total Intensity in the encapsulated droplet over time. Since photobleaching is known to be a first order process, we have fitted an exponential curve to the data. The high R-squared value implies a good fit of the exponential model to the data. The rate of photobleaching turns out to be 0.002 per second (7.2 per hour).
File history
Click on a date/time to view the file as it appeared at that time.
| Date/Time | Thumbnail | Dimensions | User | Comment | |
|---|---|---|---|---|---|
| current | 02:32, 28 October 2017 | | 1,516 × 867 (74 KB) | Kshitijrai (Talk | contribs) | Fig. 1 Total Intensity in the encapsulated droplet over time. Since photobleaching is known to be a first order process, we have fitted an exponential curve to the data. The high R-squared value implies a good fit of the exponential model to the data.... |
- You cannot overwrite this file.
File usage
The following page links to this file: