File:TU Eindhoven mNeonGreen ExcitationScan.png
Revision as of 23:23, 18 September 2015 by S136969 (Talk | contribs) (The pSB1C3 vector containing mNeonGreen vector was transformed into BL21(DE3) cells. These cells were measured at an OD of 2.0. Three biological triplicates were obtained which all showed peaks at approximately 517 nm. The first negative control, cells wi)
TU_Eindhoven_mNeonGreen_ExcitationScan.png (800 × 405 pixels, file size: 53 KB, MIME type: image/png)
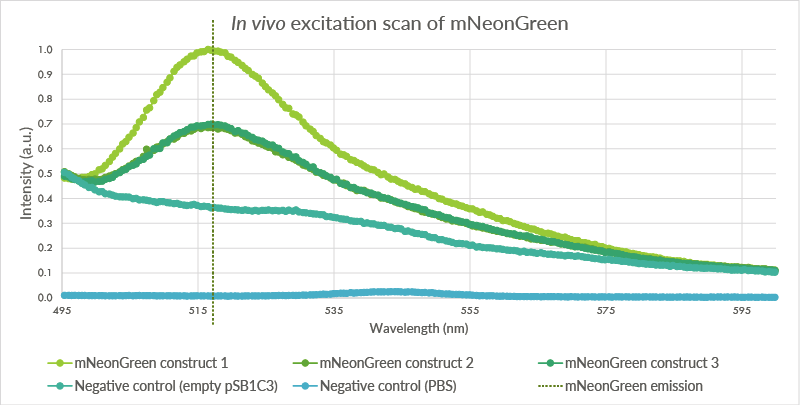
The pSB1C3 vector containing mNeonGreen vector was transformed into BL21(DE3) cells. These cells were measured at an OD of 2.0. Three biological triplicates were obtained which all showed peaks at approximately 517 nm. The first negative control, cells with an empty pSB1C3 plasmid, do not show such a peak. The second negative control, pure PBS, showed a very low intensity.
File history
Click on a date/time to view the file as it appeared at that time.
| Date/Time | Thumbnail | Dimensions | User | Comment | |
|---|---|---|---|---|---|
| current | 23:23, 18 September 2015 |  | 800 × 405 (53 KB) | S136969 (Talk | contribs) | The pSB1C3 vector containing mNeonGreen vector was transformed into BL21(DE3) cells. These cells were measured at an OD of 2.0. Three biological triplicates were obtained which all showed peaks at approximately 517 nm. The first negative control, cells wi |
- You cannot overwrite this file.
File usage
The following page links to this file:
