BBa K731700 and BBa K731710 measurements
Hello world
In this page we are really proud to introduce you the protocol we (Giacomo and Anna) developed for the characterization transcriptional terminators' effects on gene expression. (Tested on BBa_J64997)
The develop of this protocol cost us not only sleepless night but also wasted sunny and beautiful weekend so take a hot cup of tea and read it all.
IN VIVO ANALYSIS
|
BEFORE STARTING:
NOTE1:Antibiotic are at concentration of 0.1mg/ml ampicillin and 0.035mg/ml cloranphenicol NOTE2:Four glycerol stocks for both control and sample will give you a good level of significance
|
PROTOCOL DEVELOPMENT:
Emission and Excitation parameter choise:
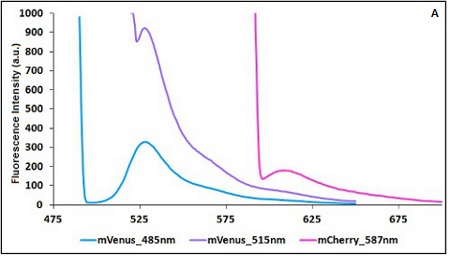
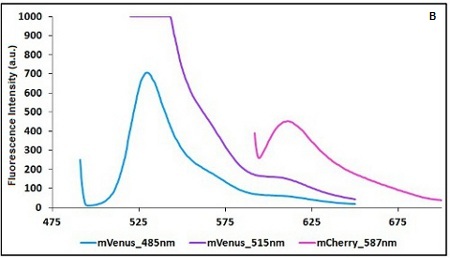
The two proteins in use in BBa_K731700 and BBa_K731710 are mCherry and A206K Venus (mVenus), respectively upstream and downstream of the terminator. After excitation of the two proteins with standard parameters, we noticed a huge difference in fluorescence intensity between the two peaks, as mVenus emission peak was about 10 times stronger than the mCherry peak. Moreover, the two fluorescent proteins presented excitation and emission peaks very close to each other. This feature may cause unwanted interferences of the scattering effect caused by the excitation ray.
In this case a shift of the brighter protein (mVenus) excitation wavelength toward smaller wavelength can bring two main benefits:
- A decrease in emission peak's fluorescence intensity
- A larger gap between the excitation wavelength and the emission peak's wavelength
Moreover, the less bright protein (mCherry) was measured at a slightly higher wavelength than the peak seen in the emission spectrum.
Here is a summary of the wavelengths used to take the measurements with BBa_K731700 and BBa_K731710:
The emission and excitation wavelengths must be aimed at achievement of the maximum distance between the two points at which you take emission measurements and the maximum comparability in terms of fluorescence intensity according to the limits imposed by the two fluorescent proteins in use.
Example: The two proteins in use in BBa_K731700 and BBa_K731710 are mCherry and A206K Venus (mVenus). After excitation of the two proteins with standard parameters we note a huge difference in fluorescence intensity between the two proteins; moreover the proximity between the excitation wavelenght and the emission peak can easily influence the measurements.
In this case a shift of the brighter protein (mVenus) excitation wavelength toward smaller wavelength can bring two main benefits:
- A decrease in emission peak's fluorescence intensity
- A larger distance between the excitation wavelength and the emission peak's wavelength
The proximity of the emission and excitation peaks of the less bright protein (mCherry) could also cause unwanted interferences; to avoid this possibility its emission is measured at a little higher wavelength than the emission peak.
Here is a summary of the wavelengths used to take the measurements with BBa_K731700 and BBa_K731710:
| Standard Excitation (nm) | Standard Emission (nm) | Modified Excitation (nm) | Modified Emission (nm) | |
| mCherry | 587 | 609 | 587 | 615 |
| mVenus | 515 | 528 | 485 | 528 |
TABLE 1: Standard and modified excitation and emission wavelengths
CHART 1A/B: Emission scan of BBa_K731700 (A) and BBa_K731710 (B) with standard and modified excitation wavelenght (instrument: Varian Cary Eclipse, voltage: 570 V (A) and 520 V (B))
Sonication of the samples:
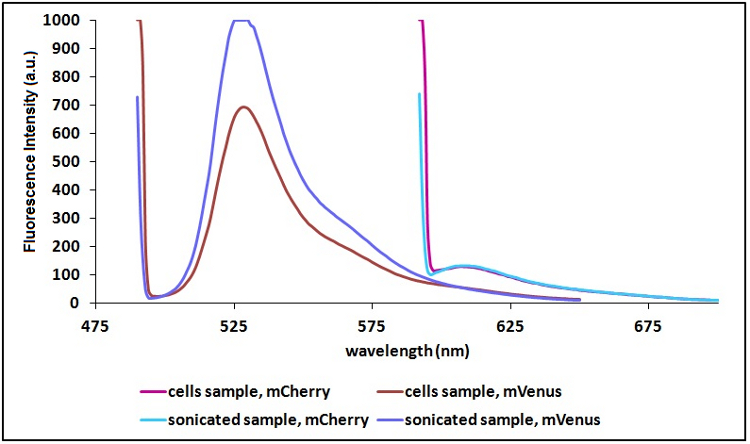
In order to reduce the scattering (signal due to excitation light in proximity of the excitation wavelength) and to have a clearer signal, we decided to sonicate our sample before measure them. Both the improvements are due to the lower O.D. of a sonicated sample compared to a cell suspension sample. A higher O.D. means a decrease in the amount of light emitted by the fluorescent proteins that reach the sensor (light that), a decrease in the light that actually reach the fluorescent proteins and an icrease of the excitation light that is reflected to the sensor (increase in scattering).
Test on different colonies:
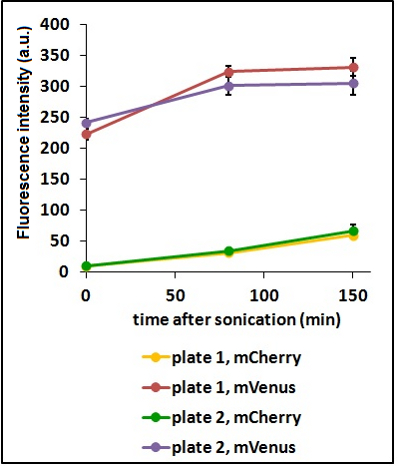
The use of glycerol stock instead of O.N cultures makes the procedure easier and faster. Glycerol stocks come however from the same colony so it was necessary to test the platform with cultures of different origin in order to find eventual differences in the behavior.
CHART 3: Behavaior of different colonies.
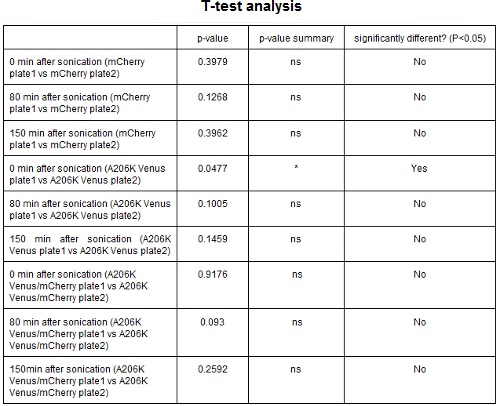
TABLE 2: The table shows the statistic analysis performed on the data in CHART 3. Neither the proteins peaks of the two plates nor their ratio are significantly different (the result of ‘0 min after sonication (A206K Venus plate 1 vs A206K Venus plate 2)’ is considered a false positive since the other two times show no significant difference).
Different concentrations of inducing agent:
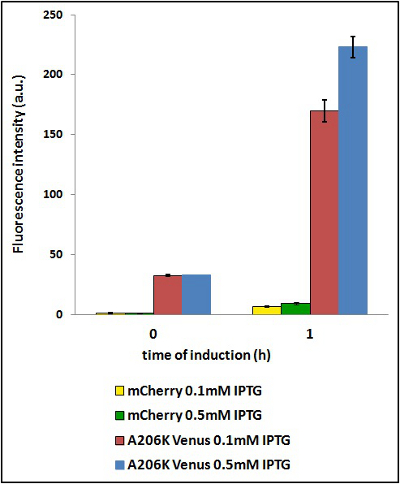
The use of different concentration of inducing agent should not influence the ratio between the fluorescence intensity of the two proteins. Nevertheless we tested two different concentration to verify the veracity of this statement.
Example:Two identical cultures are grown in LB until O.D. 0.6 and then iduced with different IPTG concentration (0.1 mM and 0.5 mM). Starting from induction time 0, withdraw 1 mL of culture at predetermined times (in this case all the times after 90 min miss cause of overflow in mVenus fluorescence intensity). Every time you withdraw 1 mL of culture, you have to prepare the sample for the fluorimetric measurements according to the protol shown in the beginning of this page (start from the sonication point).
CHART 4: Behavaior at different concentration of inducing agent (IPTG).
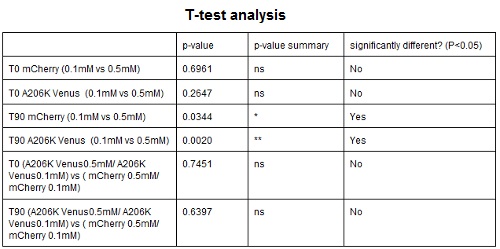
TABLE 3: The table shows the statistic analysis permormed on the data in CHART 4. There is no significant differences between the two samples at induction time 0 min; significant differences are instead shown between the samples at induction time 90 min. The t-tests also show that the % increase in protein expression between 0.1mM e 0.5mM is the same in the two proteins.
O.D. equalization:
This point allows to have low standard deviation and variability in the data.

