Part:BBa_E0040
green fluorescent protein derived from jellyfish Aequeora victoria wild-type GFP (SwissProt: P42212
GFP (mut3b) [note that this part does not have a barcode]
Usage and Biology
Untagged version of gfp from Repressilator reporter. See the design page for more source information.
The original citation for GFPmut3b is as follows:
Cormack, B.P., Valdivia, R.H., and S. Falkow. FACS-optimized mutants of green fluorescent protein (GFP). Gene 173: 33-38 (1996).
Here's the link: http://www.sciencedirect.com/science/article/pii/0378111995006850
Fluorescence wavelengths
Cormack et al.Cormack report the following excitation and emission data for GFPmut3 -
- Excitation max - 501nm
- Emission max - 511nm
Latency
Cormack et al.Cormack report detectable fluorescence within 8 mins. Please add maturation time data for E0040 here.
References
<biblio>
- Cormack pmid=10659856
</biblio>
Allergen characterization of BBa_E0040
The Baltimore Biocrew 2017 team discovered that proteins generated through biobrick parts can be evaluated for allergenicity. This information is important to the people using these parts in the lab, as well as when considering using the protein for mass production, or using in the environment. The allergenicity test permits a comparison between the sequences of the biobrick parts and the identified allergen proteins enlisted in a data base.The higher the similarity between the biobricks and the proteins, the more likely the biobrick is allergenic cross-reactive. In the full-length alignments by FASTA, 30% or more amount of similarity signifies that the biobrick has a Precaution Status meaning there is a potential risk with using the part. A 50% or more amount of identity signifies that the biobrick has a Possible Allergen Status. In the sliding window of 80 amino acid segments, greater than 35% signifies similarity to allergens. The percentage of similarity implies the potential of harm biobricks’ potential negative impact to exposed populations. For more information on how to assess your own biobrick part please see the “Allergenicity Testing Protocol” in the following page http://2017.igem.org/Team:Baltimore_Bio-Crew/Experiments
For the biobrick part, BBa_E0040, there was a 28.7% of identity match and 47.1% of similarity match compared to the top allergen in the database. This means that the biobrick part is NOT of potential allergen status. In the 80 amino acid alignments by FASTA, no matches found that are greater than 35% for this biobrick.
Part Characteristics in Cell-Free Chassis
| Parameter | Value and Description |
|---|---|
| Calibration | A conversion factor of 79.429 from Au to concentraion in nM |
| Half-life | 33 hours in the cell-free chassis, with a degradation constant of 0.0210 (in hours) |
Purificaton
GFPmut3b can be purified for calibration after the addition of a his-tag. The detailed [http://2007.igem.org/Imperial/Wet_Lab/Protocols/Prot1.6 protocols]and [http://2007.igem.org/Imperial/Wet_Lab/Results/Res1.6 results]for the purification can be found.
Calibration
The fluorescence of purified GFPmut3B was calibrated in the cell-free chassis. The derived [http://2007.igem.org/Imperial/Wet_Lab/Results/Res1.3 calilbration curve]allows the determination of the concentration of GFPmut3b in the cell-free chassis. [http://2007.igem.org/Imperial/Wet_Lab/Protocols/Prot1.3 Detailed protocols]for generating the calibration curve are available. Other calibration curves for are also available on the results page.
Degradation
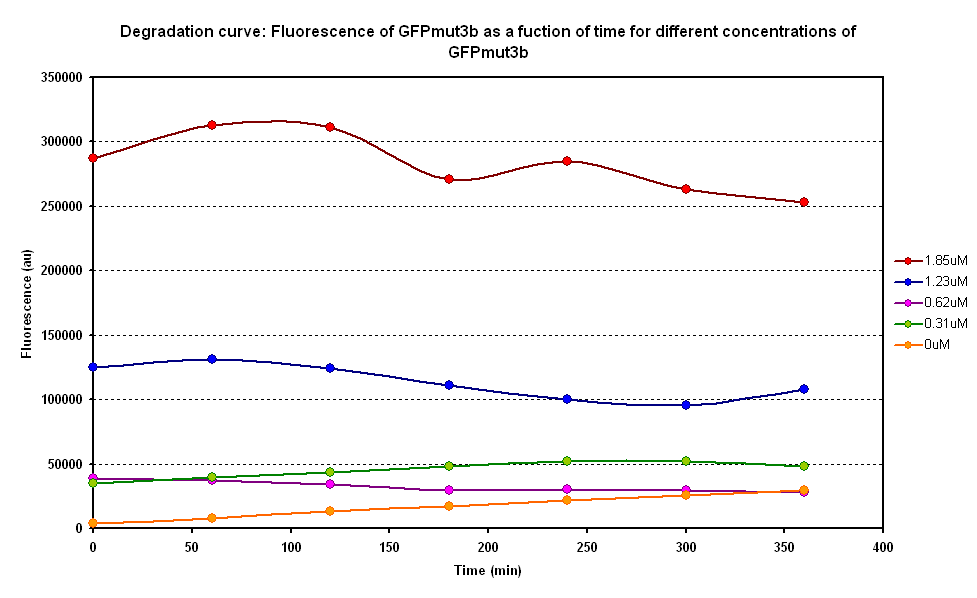
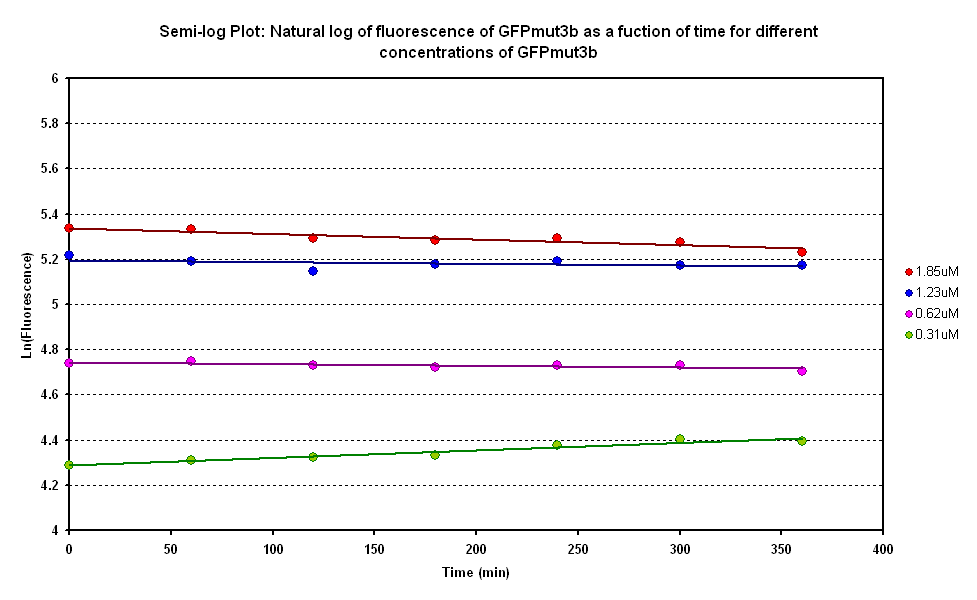
The degradation of GFPmut3B in the cell-free chassis was also characterized. Purified GFPmut3B was allowed to degrade in the cell-free chassis and the fluorescence was measured over time. [http://2007.igem.org/Imperial/Wet_Lab/Protocols/Prot1.4 Detailed protocols]and [http://2007.igem.org/Imperial/Wet_Lab/Results/Res1.4 results]are attached.
From the semi-log plot, the degradation constant (in minutes) was derived to be 0.0003501, which is equivalent to GFPmut3b having a half-life of 33 hours in the cell-free chassis.
Expression of GFP-mut3b in cell lysate
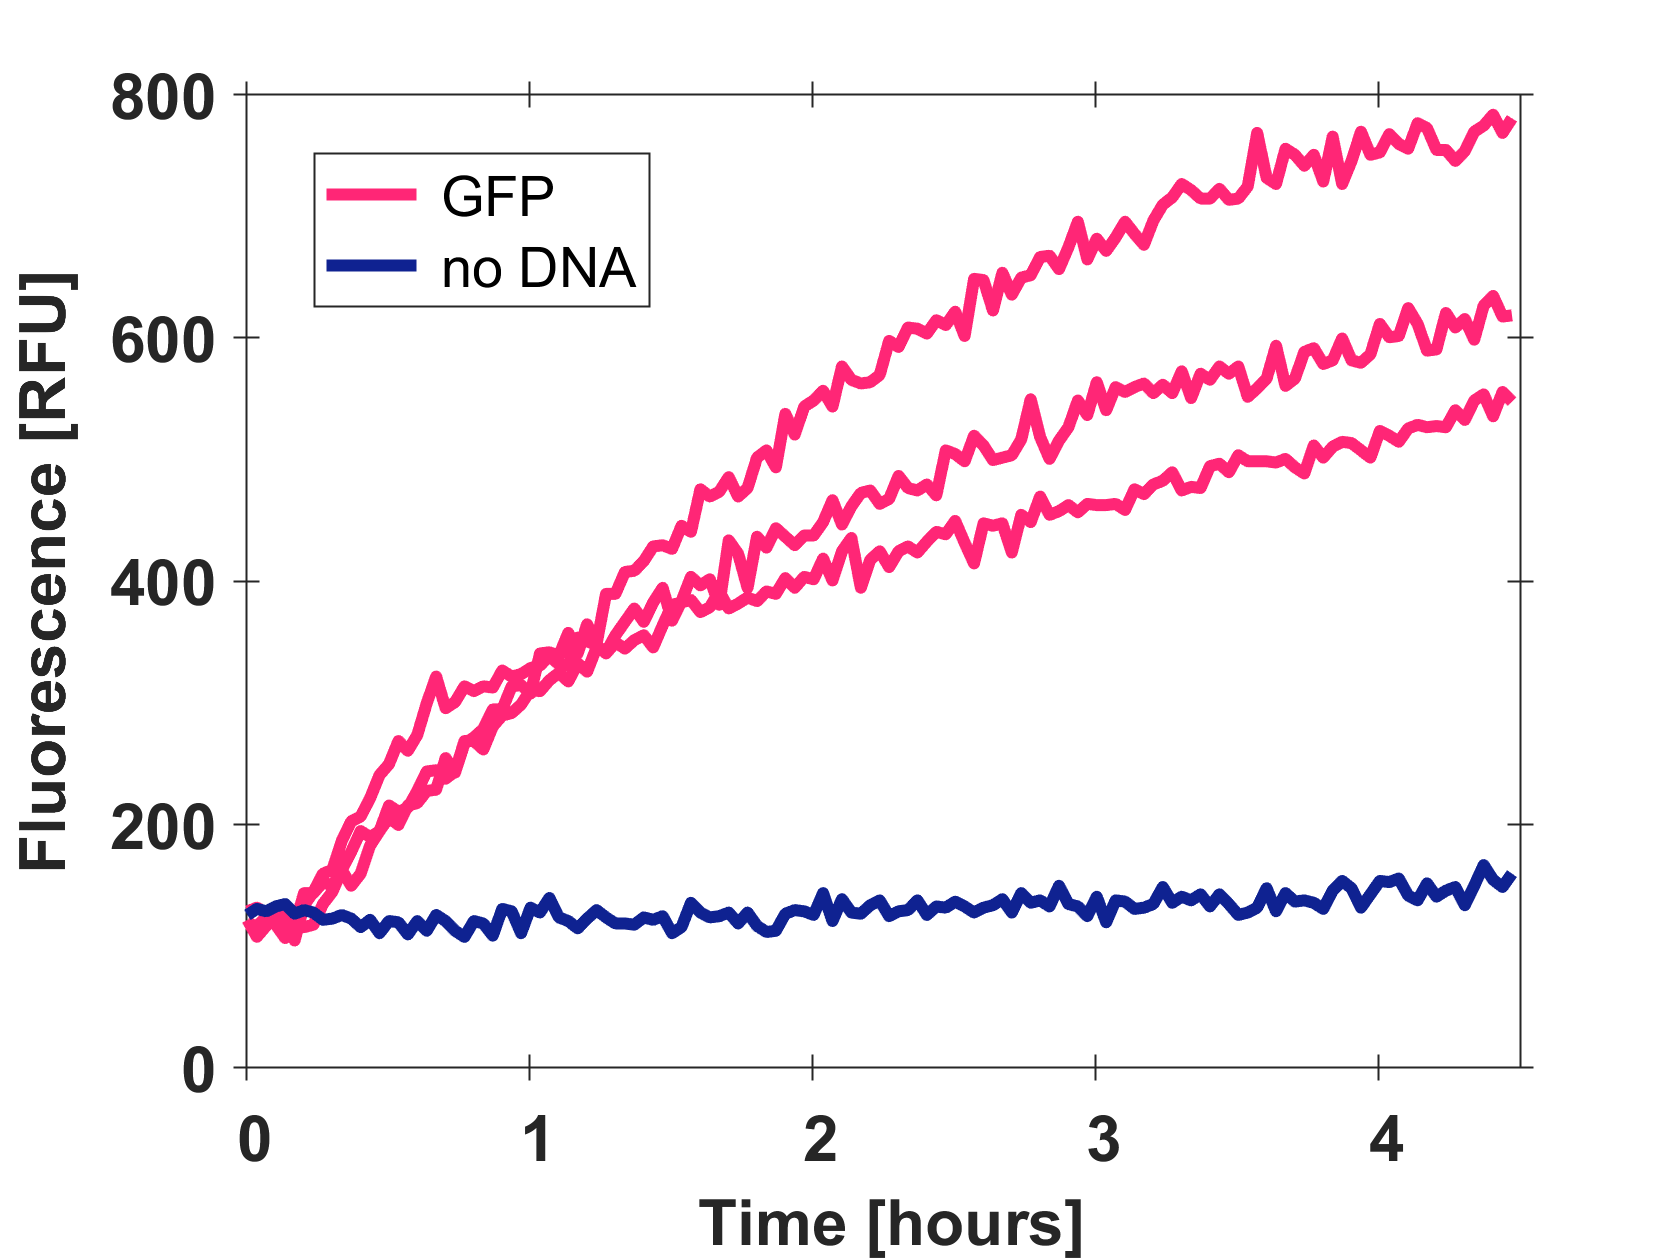
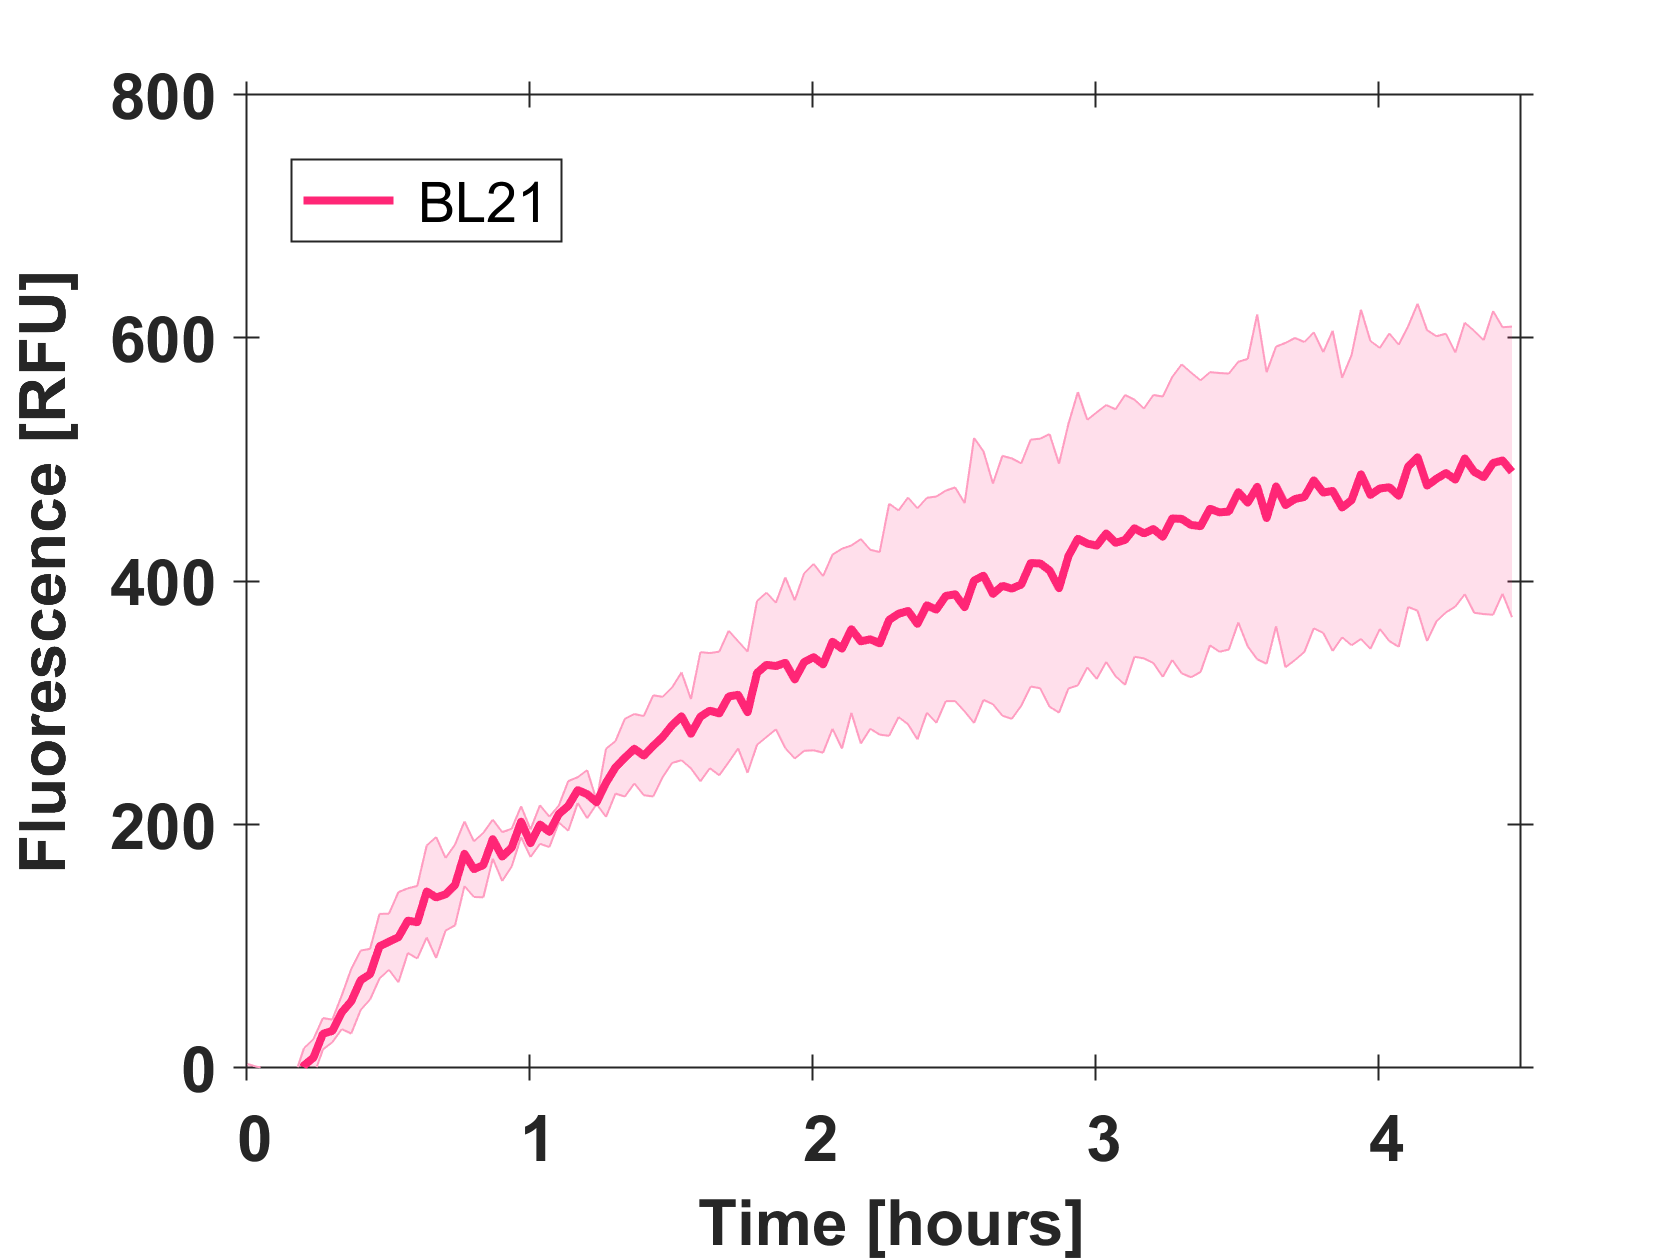
Cell-free GFP-mut3b synthesis was analyzed in self-made E.Coli lysate from strain BL21(DE3). Fluorescence was measured at 37°C for five hours on a plate reader. For details on how the lysate and the energy solution were made and which components went into the final reaction volume of 10uL, check out our [http://2017.igem.org/Team:EPFL/Protocols protocols]. Shown are three repeats with a negative control as well as a shaded error graph (control was subtracted) summarizing the result. GFP-mut3b expression yields high signals in lysate and thus is a good choice of reporter while working on a cell-free chassis. Saturation occurs after about five hours.
IIT Delhi 2017 - Characterization of Photobleaching
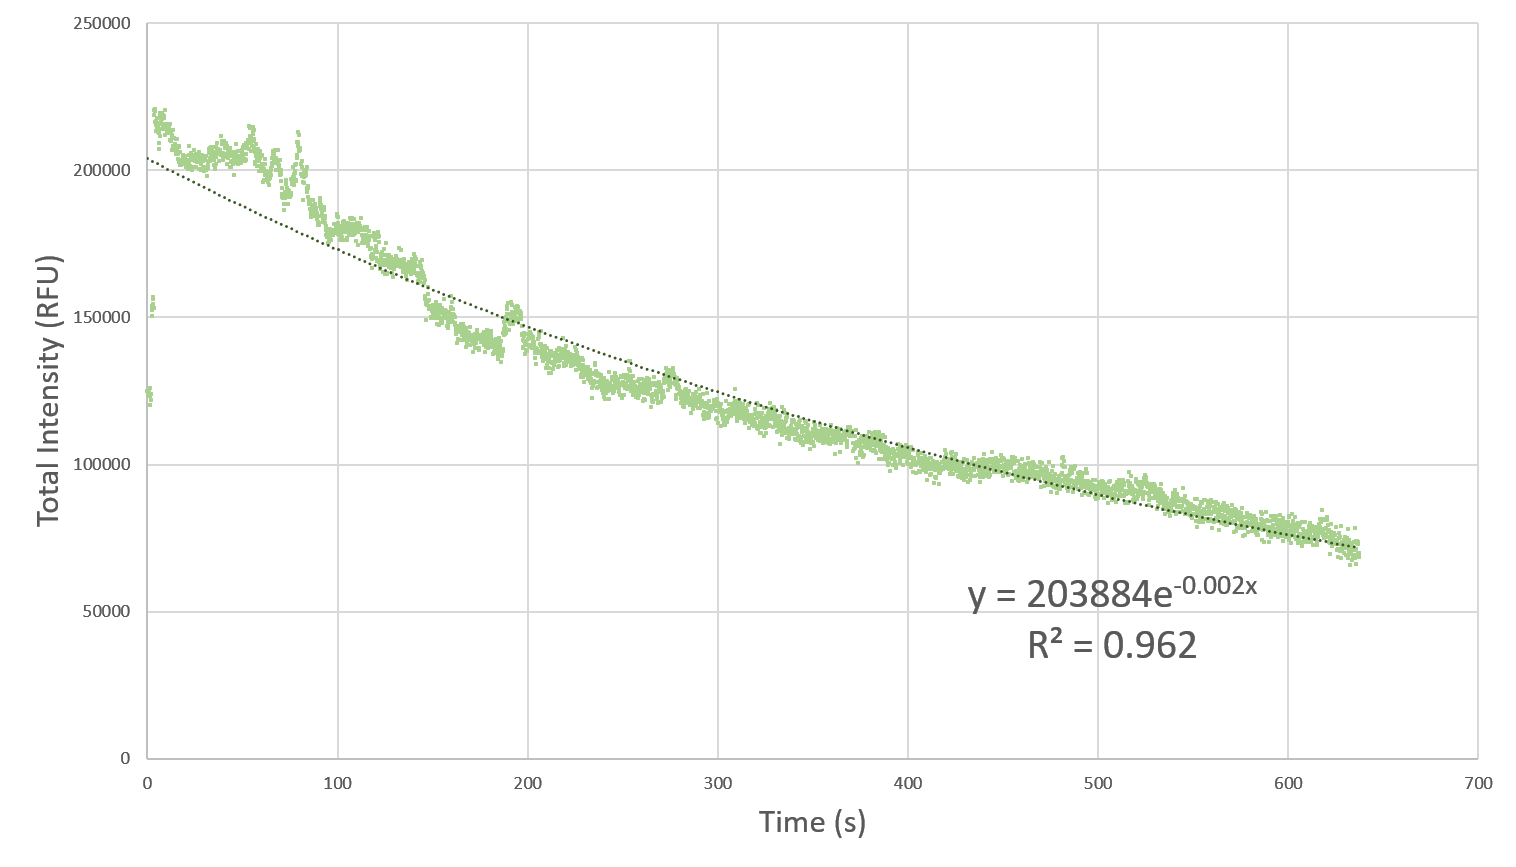
Photobleaching is the phenomenon of irreversible damage to the fluorophore, such that after certain number of electronic transitions on absorption of photons, it cannot fluoresce anymore. This hinders the ability to continuously image a sample over a long period of time, thus acting as a bottleneck to the characterization pipeline. Therefore, it is of paramount importance to understand and characterize the bleaching effect so that an optimum time gap between successive images could be chosen. This would ensure that the fluorophores do not bleach and at the same time we don’t have to compromise on the amount of collected data due to the time gap.
Here, we characterize the photobleaching effect in wildtype GFP (E0040) using fluorescent microscopy with the etaluma Lumascope 500 microscope. Cells expressing GFP under the PhlF repressible promoter (BBa_K2525016) in the absence of PhlF, so that it constitutively expressed GFP. Cells were loaded in microfluidic chambers and droplet encapsulation was performed to capture a small number of cells. This droplet was continuously exposed to light corresponding to the excitation wavelength of GFP (~485 nm) and the emission was captured continuously as well. The real time video for photobleaching in the cells encapsulated in the droplet is shown in GIF 1. ImageJ was used to analyze the images to obtain the rate of photobleaching as shown in Fig 1. Where we have fitted an exponential curve to the total intensity over time. It is known that photobleaching has a first order decay. We obtain a photobleaching rate of 0.002 per second (7.2 per hour).
Kyoto 2018 - Characterization
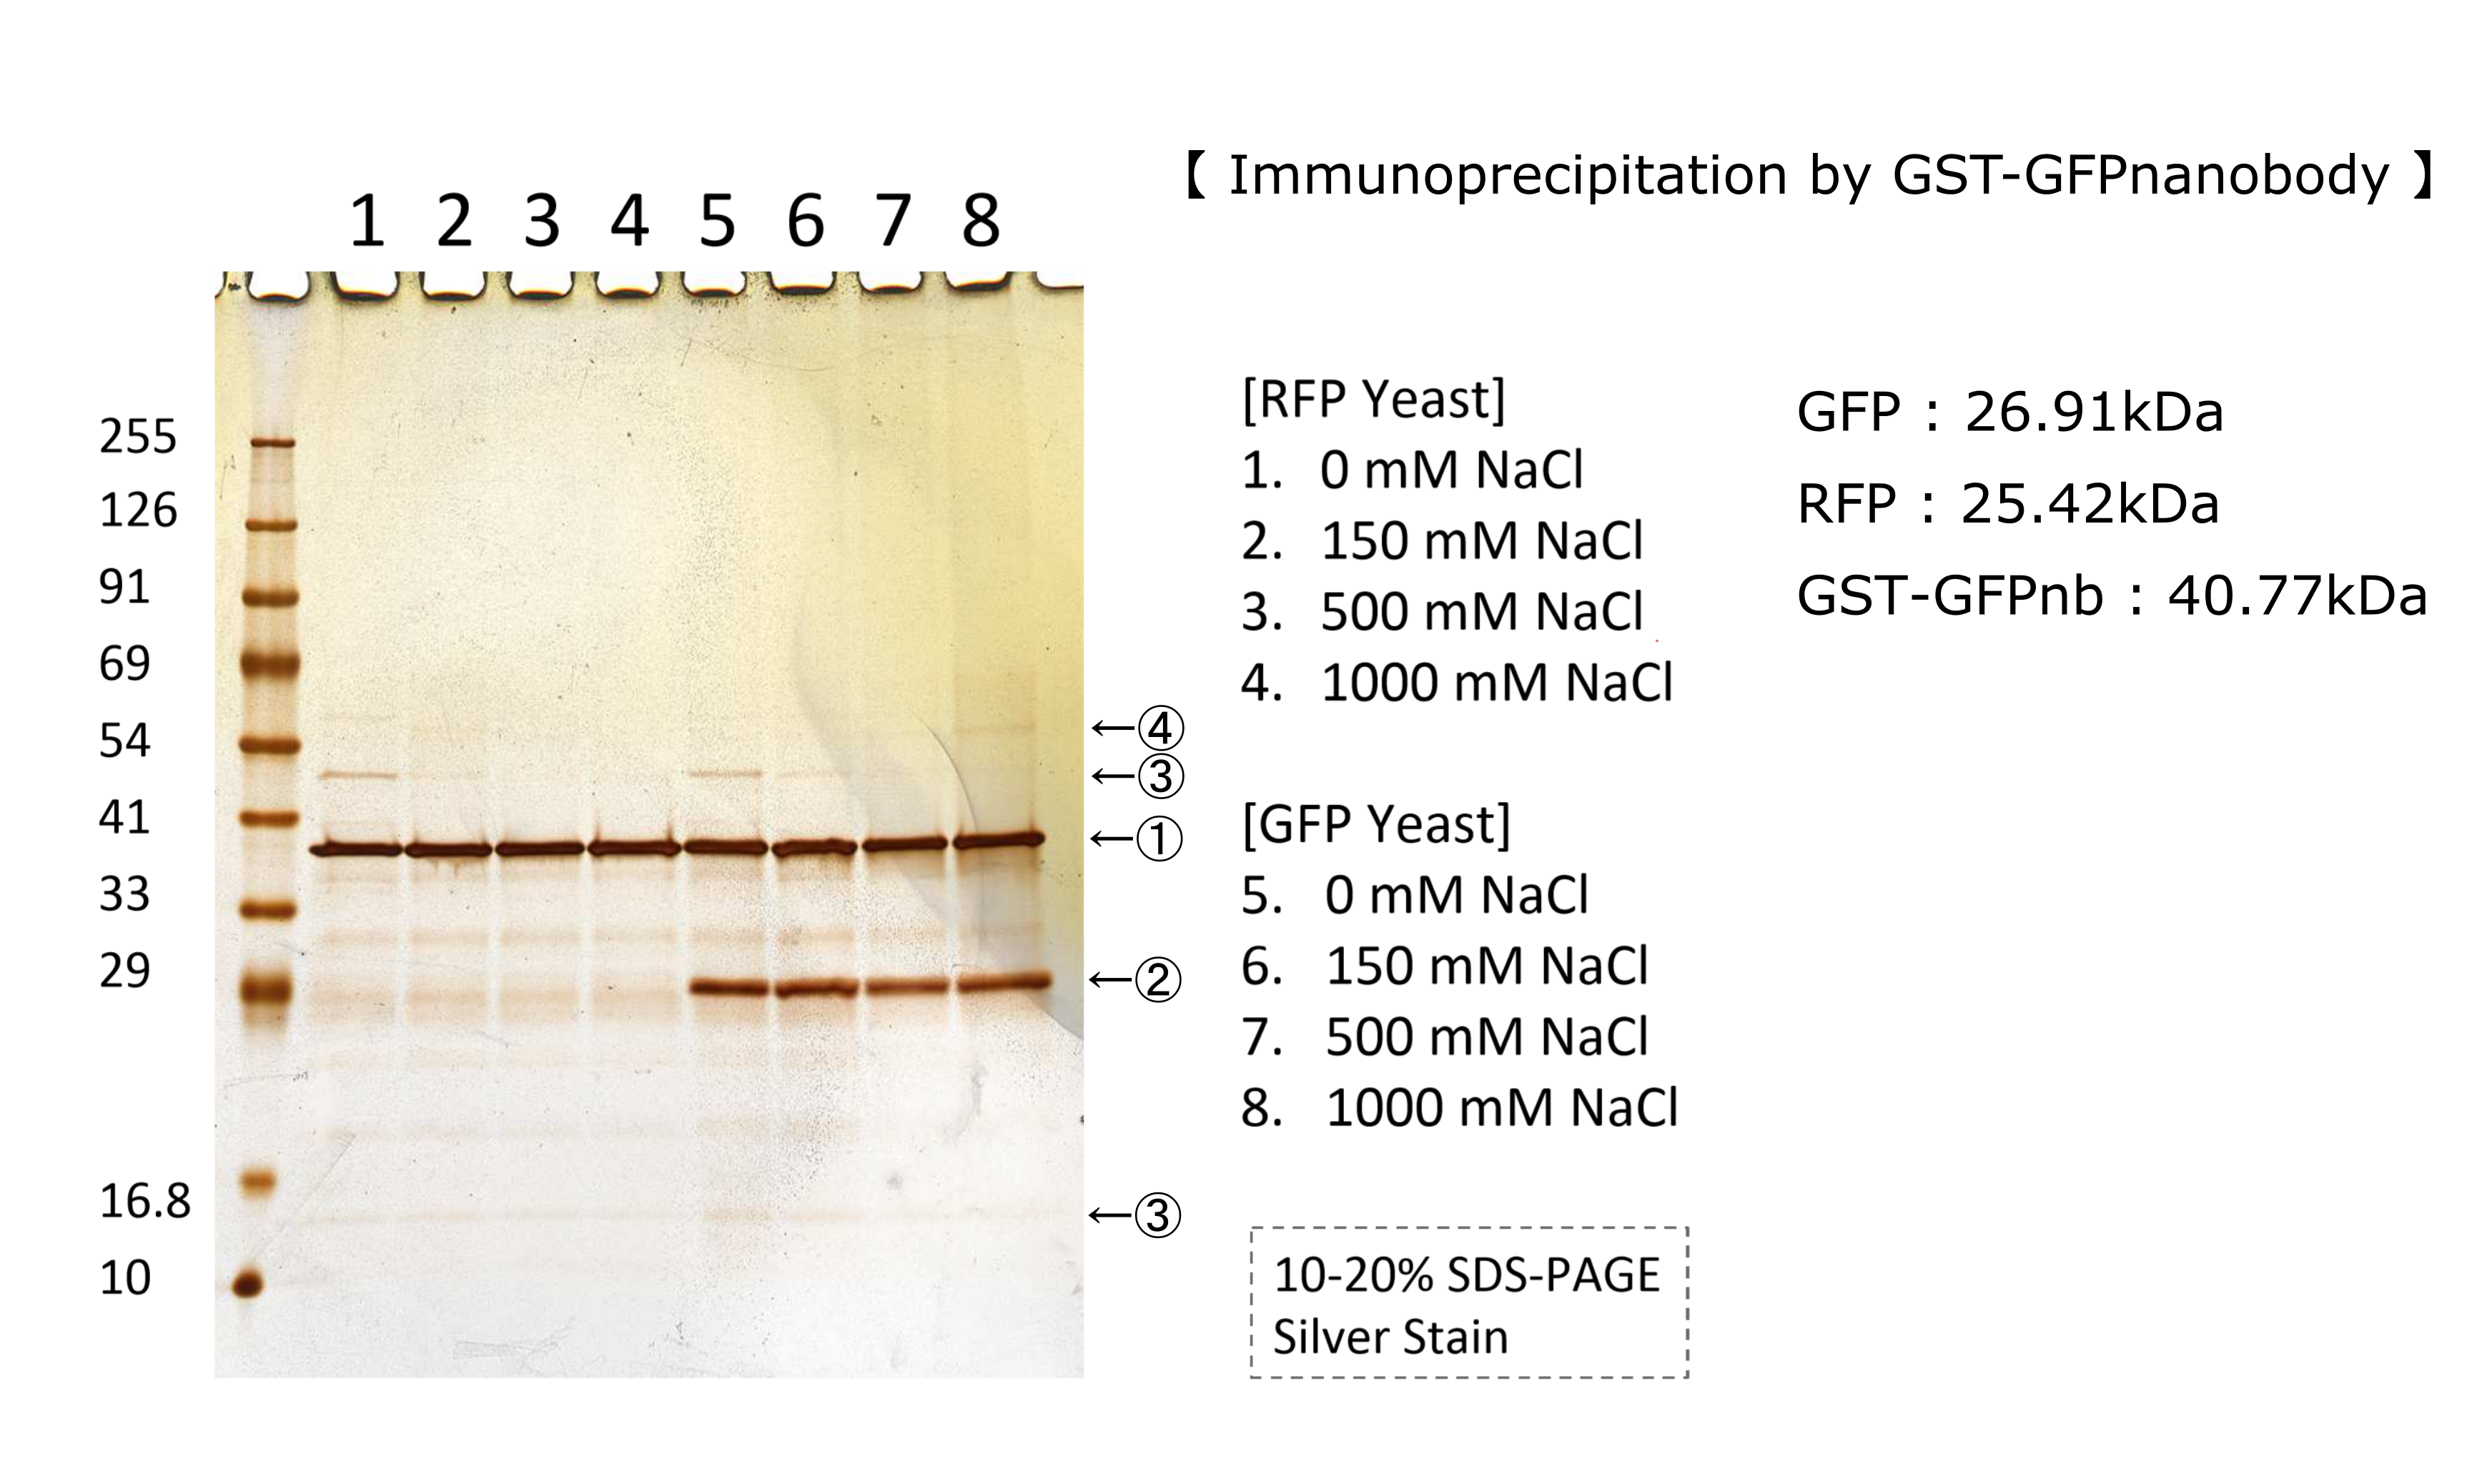
We tested nonspecifically interaction of GFP by immunoprecipitation.
FigXXXX shows the result of immunoprecipitation by GFPnanobody.
Without GFP’s band, we can see same bands pattern in lane 2 and 6.
This result shows GFP has no nonspecifically interaction with proteins of S.cerevisiae under physiological salt concentration. So, there is no problem when we identify the location of localized proteins that fused with this GFP.
Otherwise, in lane 8, there is a unique band.(④) This band might shows GFP’s nonspecifically interaction under high salt concentrations. So, when we use this part, we have to experiment under physiological salt concentration.
Improvements
• Chlamydomonas reinhardtii chloroplast optimised: BBa_K2148009
•
Yeast- and FACS optimized GFP: BBa_K194001
• Yeast- and FACS optimized, fast degradable GFP: BBa_K194002
• RFC[1000] compatible GFP: BBa_K2294444
| Protein data table for BioBrick BBa_E0040 automatically created by the BioBrick-AutoAnnotator version 1.0 | ||||||||||||||||||||||||||||||||||||||||||||||
|---|---|---|---|---|---|---|---|---|---|---|---|---|---|---|---|---|---|---|---|---|---|---|---|---|---|---|---|---|---|---|---|---|---|---|---|---|---|---|---|---|---|---|---|---|---|---|
| Nucleotide sequence in RFC 10: (underlined part encodes the protein) ATGCGTAAA ... CTATACAAATAATAA ORF from nucleotide position 1 to 714 (excluding stop-codon) | ||||||||||||||||||||||||||||||||||||||||||||||
Amino acid sequence: (RFC 25 scars in shown in bold, other sequence features underlined; both given below)
| ||||||||||||||||||||||||||||||||||||||||||||||
Sequence features: (with their position in the amino acid sequence, see the list of supported features)
| ||||||||||||||||||||||||||||||||||||||||||||||
Amino acid composition:
| ||||||||||||||||||||||||||||||||||||||||||||||
Amino acid counting
| Biochemical parameters
| |||||||||||||||||||||||||||||||||||||||||||||
| Plot for hydrophobicity, charge, predicted secondary structure, solvent accessability, transmembrane helices and disulfid bridges | ||||||||||||||||||||||||||||||||||||||||||||||
Codon usage
| ||||||||||||||||||||||||||||||||||||||||||||||
Alignments (obtained from PredictProtein.org)
| ||||||||||||||||||||||||||||||||||||||||||||||
| Predictions (obtained from PredictProtein.org) | ||||||||||||||||||||||||||||||||||||||||||||||
Subcellular Localization (reliability in brackets)
| Gene Ontology (reliability in brackets)
| |||||||||||||||||||||||||||||||||||||||||||||
Predicted features:
| ||||||||||||||||||||||||||||||||||||||||||||||
| The BioBrick-AutoAnnotator was created by TU-Munich 2013 iGEM team. For more information please see the documentation. If you have any questions, comments or suggestions, please leave us a comment. | ||||||||||||||||||||||||||||||||||||||||||||||
- 10COMPATIBLE WITH RFC[10]
- 12COMPATIBLE WITH RFC[12]
- 21COMPATIBLE WITH RFC[21]
- 23COMPATIBLE WITH RFC[23]
- 25COMPATIBLE WITH RFC[25]
- 1000INCOMPATIBLE WITH RFC[1000]Illegal BsaI.rc site found at 644
//chassis/prokaryote/bsubtilis
//chassis/prokaryote/ecoli
//function/reporter/fluorescence
| color | Green |
| direction | Forward |
| emission | |
| emit | 511 |
| excitation | |
| excite | 501 |
| kegg | |
| lum | |
| protein | GFPmut3b |
| swisspro | |
| tag | None |

 1 Registry Star
