
Difference between revisions of "Part:BBa K4165254"
(→WetLab Results) |
|||
| Line 41: | Line 41: | ||
===WetLab Results=== | ===WetLab Results=== | ||
In the wet lab we started with cloning in the pJET vector followed by the expression in the pgs21a, then we performed two different kinds of lysis to extract the protein to find which lysis buffer will give better yield, and quantified the protein expression before and after induction using BCA assay, in the end, we tested the GST COH affinity by the pulldown assay against the his DOC | In the wet lab we started with cloning in the pJET vector followed by the expression in the pgs21a, then we performed two different kinds of lysis to extract the protein to find which lysis buffer will give better yield, and quantified the protein expression before and after induction using BCA assay, in the end, we tested the GST COH affinity by the pulldown assay against the his DOC | ||
| + | <p style=" font-weight: bold; font-size:14px;"> Ligation reaction between GST Coh and pJET cloning vector </p> | ||
| + | we used T4 ligase to ligate GST Coh with pJET cloning vector so, we incubated GST Coh with pJET overnight at 15°C | ||
| + | <html> | ||
| + | <p><img src="https://static.igem.wiki/teams/4165/wiki/parts-registry/wetlab-results/ligation-of-gst-coh.png" style="margin-left:200px;" alt="" width="500" /></p> | ||
| + | </html> | ||
| + | Figure 3. This figure shows the ligation between GST Coh and pJET cloning vector | ||
| + | |||
<p style=" font-weight: bold; font-size:14px;"> Transformation of GST COH in DH-5 alpha using pJET cloning vector </p> | <p style=" font-weight: bold; font-size:14px;"> Transformation of GST COH in DH-5 alpha using pJET cloning vector </p> | ||
The transformation was done using TSS buffer protocol, after trying three buffers which are Calcium chloride, Magnesium chloride and a combination between Calcium chloride and Magnesium chloride, we optimized our protocol to use the TSS buffer protocol as it showed the best results with a transformation efficiency of GST coh in DH-5 alpha using pJET vector is 〖40×10〗^4 No.of transformants/μg, you can find the complete protocol in our wiki page | The transformation was done using TSS buffer protocol, after trying three buffers which are Calcium chloride, Magnesium chloride and a combination between Calcium chloride and Magnesium chloride, we optimized our protocol to use the TSS buffer protocol as it showed the best results with a transformation efficiency of GST coh in DH-5 alpha using pJET vector is 〖40×10〗^4 No.of transformants/μg, you can find the complete protocol in our wiki page | ||
| Line 46: | Line 53: | ||
<p><img src="https://static.igem.wiki/teams/4165/wiki/parts-registry/wetlab-results/gst-coh-pjet.jpg" style="margin-left:200px;" alt="" width="500" /></p> | <p><img src="https://static.igem.wiki/teams/4165/wiki/parts-registry/wetlab-results/gst-coh-pjet.jpg" style="margin-left:200px;" alt="" width="500" /></p> | ||
</html> | </html> | ||
| − | Figure | + | Figure 4. Transformed plate of GST COH + pJET. |
<p style=" font-weight: bold; font-size:14px;"> Transformation of GST COH in BL-21 using pGS-21a expression vector </p> | <p style=" font-weight: bold; font-size:14px;"> Transformation of GST COH in BL-21 using pGS-21a expression vector </p> | ||
| Line 52: | Line 59: | ||
<p><img src="https://static.igem.wiki/teams/4165/wiki/parts-registry/wetlab-results/gst-coh.jpg" style="margin-left:200px;" alt="" width="500" /></p> | <p><img src="https://static.igem.wiki/teams/4165/wiki/parts-registry/wetlab-results/gst-coh.jpg" style="margin-left:200px;" alt="" width="500" /></p> | ||
</html> | </html> | ||
| − | Figure | + | Figure 5. Transformed plate of GST COH + pGS-21a. |
| − | + | <p style=" font-weight: bold; font-size:14px;"> Miniprep for GST Coh </p> | |
| + | Miniprep is a technique which is done to extract the plasmid that contains our part so, we performed miniprep for GST Coh in pJET cloning vector to extract our protein. | ||
| + | <html> | ||
| + | <p><img src="https://static.igem.wiki/teams/4165/wiki/parts-registry/wetlab-results/gst-coh-miniprep.png" style="margin-left:200px;" alt="" width="500" /></p> | ||
| + | </html> | ||
| + | Figure 6. This figure shows the miniprep of GST Coh in pJET cloning vector | ||
<p style=" font-weight: bold; font-size:14px;"> Comparison between chemical lysis and sonication for GST COH </p> | <p style=" font-weight: bold; font-size:14px;"> Comparison between chemical lysis and sonication for GST COH </p> | ||
Chemical lysis and sonication were done to check which of them gives better results in the protein extraction, and after comparing the results we optimized our protocol to use sonication for GST coh | Chemical lysis and sonication were done to check which of them gives better results in the protein extraction, and after comparing the results we optimized our protocol to use sonication for GST coh | ||
| Line 60: | Line 72: | ||
</html> | </html> | ||
| − | Figure | + | Figure 7. This graph shows a highly significant difference between the |
chemical lysis and sonication for GST COH, after we had this | chemical lysis and sonication for GST COH, after we had this | ||
result we optimized our protocol to use sonication for GST COH | result we optimized our protocol to use sonication for GST COH | ||
| Line 68: | Line 80: | ||
<p><img src="https://static.igem.wiki/teams/4165/wiki/parts-registry/wetlab-results/coh-vs-doc.jpg" style="margin-left:200px;" alt="" width="500" /></p> | <p><img src="https://static.igem.wiki/teams/4165/wiki/parts-registry/wetlab-results/coh-vs-doc.jpg" style="margin-left:200px;" alt="" width="500" /></p> | ||
</html> | </html> | ||
| − | Figure | + | Figure 8. This graph illustrates that the binding between His DOC with GST COH is more |
stable than that of His COH with GST DOC | stable than that of His COH with GST DOC | ||
<p style=" font-weight: bold; font-size:14px;"> BCA assay results for His COH and GST COH </p> | <p style=" font-weight: bold; font-size:14px;"> BCA assay results for His COH and GST COH </p> | ||
| Line 79: | Line 91: | ||
<p><img src="https://static.igem.wiki/teams/4165/wiki/parts-registry/wetlab-results/bca-gst-coh.png" style="margin-left:200px;" alt="" width="500" /></p> | <p><img src="https://static.igem.wiki/teams/4165/wiki/parts-registry/wetlab-results/bca-gst-coh.png" style="margin-left:200px;" alt="" width="500" /></p> | ||
</html> | </html> | ||
| − | Figure | + | Figure 9. This graph illustrates the results of BCA assay for GST COH showing that our protein |
concentration is expected to be 0.1158 | concentration is expected to be 0.1158 | ||
<p style=" font-weight: bold; font-size:14px;"> pull down assay was performed to check the protein-protein interactions </p> | <p style=" font-weight: bold; font-size:14px;"> pull down assay was performed to check the protein-protein interactions </p> | ||
| Line 85: | Line 97: | ||
<p><img src="https://static.igem.wiki/teams/4165/wiki/data-analysis/pull-down/his-doc-gst-coh.jpg" style="margin-left:200px;" alt="" width="500" /></p> | <p><img src="https://static.igem.wiki/teams/4165/wiki/data-analysis/pull-down/his-doc-gst-coh.jpg" style="margin-left:200px;" alt="" width="500" /></p> | ||
</html> | </html> | ||
| − | + | Figure 10. This figure shows that the binding between his doc and gst coh happened as the concentration of | |
the gst coh and his doc more than that of his doc alone | the gst coh and his doc more than that of his doc alone | ||
| − | |||
| − | |||
| − | |||
| − | |||
| − | |||
===References=== | ===References=== | ||
Revision as of 12:55, 13 October 2022
GST-Coh2
This part encodes Cohesin 2 protein tagged with GST for its purification and characterization
Usage and Biology
The Cohesin 2 module comes from the C. thermocellum scaffoldin and it could recognize and bind tightly to its complementary counterpart Dockerin S. The Coh2–DocS pair represents the interaction between two complementary families of protein modules that exhibit divergent specificities and affinities, ranging from one of the highest known affinity constants between two proteins to relatively low-affinity interactions. This serves an essential role in the assembly of cellulosomal enzymes into the multienzyme cellulolytic complex (cellulosome), this interaction happens in two different forms, called the dual binding mode, in a calcium-dependent manner due to the presence of a calcium-binding site in the dockerin protein.
We used the DocS-Coh2 binding in our Snitch system to form the PROTAC pair that will conjugate E3 ligase trim 21 (BBa_K4165001) with the binding peptide for our targeted protein tau. Sequence and Features
- 10COMPATIBLE WITH RFC[10]
- 12COMPATIBLE WITH RFC[12]
- 21COMPATIBLE WITH RFC[21]
- 23COMPATIBLE WITH RFC[23]
- 25COMPATIBLE WITH RFC[25]
- 1000INCOMPATIBLE WITH RFC[1000]Illegal SapI.rc site found at 85
Dry lab characterization
Modeling
Coh2 was modeled tagged with GST to purify it and measure its expression yield, the models were done using (Alphafold - Modeller - trRosetta - Rosettafold) and the top models were obtained from Alphafold and trRosetta ranking 5 out of 6 according to our QA code.

Figure 1.: Predicted 3D structure of Coh2 protein tagged by GST designed by AlphaFold tool visualized on Pymol.
Table 1: Quality assessment parameters of GST-Coh2 model.

Docking
GST-Coh2 is docked to His-DocS
ΔG = -13.15 kcal/mol

Figure 2.: 3D structure of GST-Coh2 docked with His-DocS on Galaxy and visualized on pymol.
WetLab Results
In the wet lab we started with cloning in the pJET vector followed by the expression in the pgs21a, then we performed two different kinds of lysis to extract the protein to find which lysis buffer will give better yield, and quantified the protein expression before and after induction using BCA assay, in the end, we tested the GST COH affinity by the pulldown assay against the his DOC
Ligation reaction between GST Coh and pJET cloning vector
we used T4 ligase to ligate GST Coh with pJET cloning vector so, we incubated GST Coh with pJET overnight at 15°C

Figure 3. This figure shows the ligation between GST Coh and pJET cloning vector
Transformation of GST COH in DH-5 alpha using pJET cloning vector
The transformation was done using TSS buffer protocol, after trying three buffers which are Calcium chloride, Magnesium chloride and a combination between Calcium chloride and Magnesium chloride, we optimized our protocol to use the TSS buffer protocol as it showed the best results with a transformation efficiency of GST coh in DH-5 alpha using pJET vector is 〖40×10〗^4 No.of transformants/μg, you can find the complete protocol in our wiki page

Figure 4. Transformed plate of GST COH + pJET.
Transformation of GST COH in BL-21 using pGS-21a expression vector

Figure 5. Transformed plate of GST COH + pGS-21a.
Miniprep for GST Coh
Miniprep is a technique which is done to extract the plasmid that contains our part so, we performed miniprep for GST Coh in pJET cloning vector to extract our protein.

Figure 6. This figure shows the miniprep of GST Coh in pJET cloning vector
Comparison between chemical lysis and sonication for GST COH
Chemical lysis and sonication were done to check which of them gives better results in the protein extraction, and after comparing the results we optimized our protocol to use sonication for GST coh
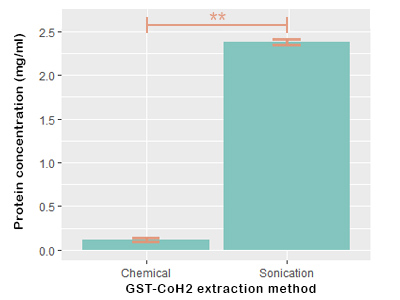
                                  Figure 7. This graph shows a highly significant difference between the
                                            chemical lysis and sonication for GST COH, after we had this
                                            result we optimized our protocol to use sonication for GST COH
Pull down assay of His COH with GST DOC and His DOC with GST COH
Pull down assay is a technique performed to check the interactions between the proteins and to check if they bind properly, we performed pull down assay to check the binding between his doc and GST Coh

                      Figure 8. This graph illustrates that the binding between His DOC with GST COH is more
                                            stable than that of His COH with GST DOC
BCA assay results for His COH and GST COH
BCA assay is a technique that is performed to quantify the proteins, and it depends on the color of the BCA dye which is directly proportional with the quantity of the protein, we performed BCA for GST COH to know its concentration and it is found to be 0.1158


                Figure 9. This graph illustrates the results of BCA assay for GST COH showing that our protein
                                       concentration is expected to be 0.1158
pull down assay was performed to check the protein-protein interactions

         Figure 10. This figure shows that the binding between his doc and gst coh happened as the concentration of
                               the gst coh and his doc more than that of his doc alone
References
1. Brás, J. L., Carvalho, A. L., Viegas, A., Najmudin, S., Alves, V. D., Prates, J. A., Ferreira, L. M., Romão, M. J., Gilbert, H. J., & Fontes, C. M. (2012). Escherichia coli Expression, Purification, Crystallization, and Structure Determination of Bacterial Cohesin–Dockerin Complexes. Methods in Enzymology, 510, 395-415. https://doi.org/10.1016/B978-0-12-415931-0.00021-5
2. Slutzki, M., Ruimy, V., Morag, E., Barak, Y., Haimovitz, R., Lamed, R., & Bayer, E. A. (2012). High-Throughput Screening of Cohesin Mutant Libraries on Cellulose Microarrays. Methods in Enzymology, 510, 453-463. https://doi.org/10.1016/B978-0-12-415931-0.00024-0
3. Stahl, S. W., Nash, M. A., Fried, D. B., Slutzki, M., Barak, Y., Bayer, E. A., & Gaub, H. E. (2012). Single-molecule dissection of the high-affinity cohesin–dockerin complex. Proceedings of the National Academy of Sciences, 109(50), 20431-20436.
4. Karpol A, Kantorovich L, Demishtein A, Barak Y, Morag E, Lamed R, Bayer EA. Engineering a reversible, high-affinity system for efficient protein purification based on the cohesin-dockerin interaction. J Mol Recognit. 2009 Mar-Apr;22(2):91-8. doi: 10.1002/jmr.926. PMID: 18979459.
5. Wojciechowski, M., Różycki, B., Huy, P.D.Q. et al. Dual binding in cohesin-dockerin complexes: the energy landscape and the role of short, terminal segments of the dockerin module. Sci Rep 8, 5051 (2018). https://doi.org/10.1038/s41598-018-23380-9