Difference between revisions of "Part:BBa K4235011"
(→Characterization) |
|||
| Line 2: | Line 2: | ||
__NOTOC__ | __NOTOC__ | ||
<partinfo>BBa_K4235011 short</partinfo> | <partinfo>BBa_K4235011 short</partinfo> | ||
| − | <br> | + | <br> |
===Usage and Biology=== | ===Usage and Biology=== | ||
Protein S is a vitamin K-dependent plasma protein that functions to prevent hypercoagulation of the blood. It serves as a non enzymatic cofactor for activated Protein C and is involved in the inactivation of coagulation factors Va and VIIIa. Protein S exists in two states in plasma, about 40% circulates as a free, functionally active form and the remaining 60% exists in the inactive form bound with C4b-binding protein. Protein S is secreted by hepatocytes, megakaryocytes, endothelial cells, etc. The initial form of secreted protein S is a 676 amino acid precursor protein, which undergoes a cleavage of a signal peptide present at the N-terminal, resulting in the mature 635 amino acid protein. Functionally active Protein S can directly bind to inhibit factor IXa, which activates factor X to Xa. Factor Xa and Va together form the prothrombinase complex responsible for activation of thrombin. Moreover, by acting as a cofactor for activated protein C, protein S promotes the cleavage of Factor VIIIa and Va, inhibiting the coagulation cascades. | Protein S is a vitamin K-dependent plasma protein that functions to prevent hypercoagulation of the blood. It serves as a non enzymatic cofactor for activated Protein C and is involved in the inactivation of coagulation factors Va and VIIIa. Protein S exists in two states in plasma, about 40% circulates as a free, functionally active form and the remaining 60% exists in the inactive form bound with C4b-binding protein. Protein S is secreted by hepatocytes, megakaryocytes, endothelial cells, etc. The initial form of secreted protein S is a 676 amino acid precursor protein, which undergoes a cleavage of a signal peptide present at the N-terminal, resulting in the mature 635 amino acid protein. Functionally active Protein S can directly bind to inhibit factor IXa, which activates factor X to Xa. Factor Xa and Va together form the prothrombinase complex responsible for activation of thrombin. Moreover, by acting as a cofactor for activated protein C, protein S promotes the cleavage of Factor VIIIa and Va, inhibiting the coagulation cascades. | ||
Revision as of 00:20, 3 October 2022
Human Protein S Gene (PROS1)
Usage and Biology
Protein S is a vitamin K-dependent plasma protein that functions to prevent hypercoagulation of the blood. It serves as a non enzymatic cofactor for activated Protein C and is involved in the inactivation of coagulation factors Va and VIIIa. Protein S exists in two states in plasma, about 40% circulates as a free, functionally active form and the remaining 60% exists in the inactive form bound with C4b-binding protein. Protein S is secreted by hepatocytes, megakaryocytes, endothelial cells, etc. The initial form of secreted protein S is a 676 amino acid precursor protein, which undergoes a cleavage of a signal peptide present at the N-terminal, resulting in the mature 635 amino acid protein. Functionally active Protein S can directly bind to inhibit factor IXa, which activates factor X to Xa. Factor Xa and Va together form the prothrombinase complex responsible for activation of thrombin. Moreover, by acting as a cofactor for activated protein C, protein S promotes the cleavage of Factor VIIIa and Va, inhibiting the coagulation cascades.
Mutations in this gene (inherited as an autosomal dominant, homozygous or heterozygous fashion) cause non-functional or lower plasma levels of Protein S resulting in a Protein S deficiency. Individuals with Protein S deficiency are at an increased risk of developing abnormal blood clots, specifically in the smaller veins, known as venous thromboembolism. Two most common conditions associated with Protein S deficiency are deep vein thrombosis and pulmonary embolism. Although rare, infants with severe protein S deficiency can develop several blood clots throughout the body, resulting in a life threatening condition known as purpura fulminans. Moreover, severe COVID-19 infections are known to cause a decline in protein S levels, which further contributes to infection severity by causing extensive endothelial dysfunction and lung damage, which is a major cause of COVID-related mortality.
Sequence and Features
- 10COMPATIBLE WITH RFC[10]
- 12COMPATIBLE WITH RFC[12]
- 21INCOMPATIBLE WITH RFC[21]Illegal BglII site found at 1947
- 23COMPATIBLE WITH RFC[23]
- 25INCOMPATIBLE WITH RFC[25]Illegal AgeI site found at 1117
- 1000COMPATIBLE WITH RFC[1000]
Characterization
(1.) Gel electrophoresis result insert PCR amplification:

Reagents for running the 1% Agarose gel:
* 1X TAE
* 2 uL 1Kb plus ladder
* 5 uL insert (10 ng)
* 1 uL 6X loading dye
* 2.5 uL SYBR safe.
(2.) Gel electrophoresis result of 2Bc-T miniprep:
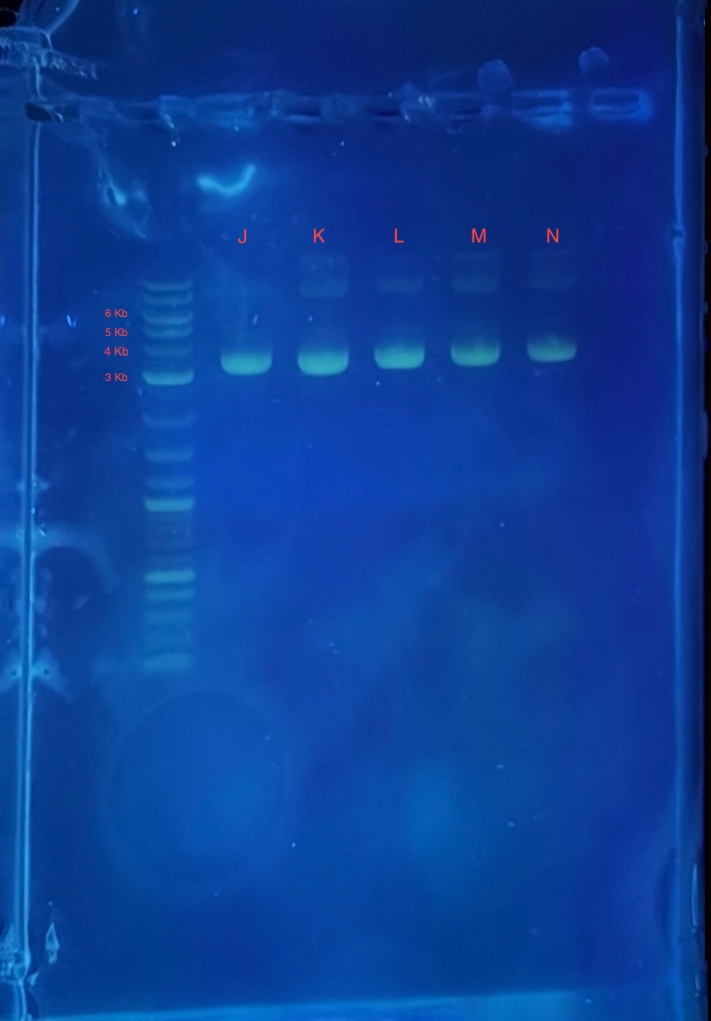
* 4 uL 1Kb plus ladder
* 4 uL mini prepped plasmids J,K,L,M and N
* 4 uL 6X loading dye
* 2.5 uL SYBR safe.
(3.) Transformation of Dh5alpha post LIC reaction:

We transformed our annealed construct after the LIC reaction into Dh5alpha. Colonies growing on Ampicillin plates confirm the presence of recombinant vector. The LIC (Ligation Independent Cloning) reaction was carried out as follows:
* Reaction 1: 2 uL of insert LIC product + 10 uL of vector LIC product + 8 uL Molecular grade H2O.
* Reaction 2: 5 uL of insert LIC product + 10 uL of vector LIC product + 5 uL Molecular grade H2O.
Concentrations of the insert and vector after the LIC reaction were 5.55 ng/uL and 68.35 ng/uL respectively
(4.) Restriction digest analysis:
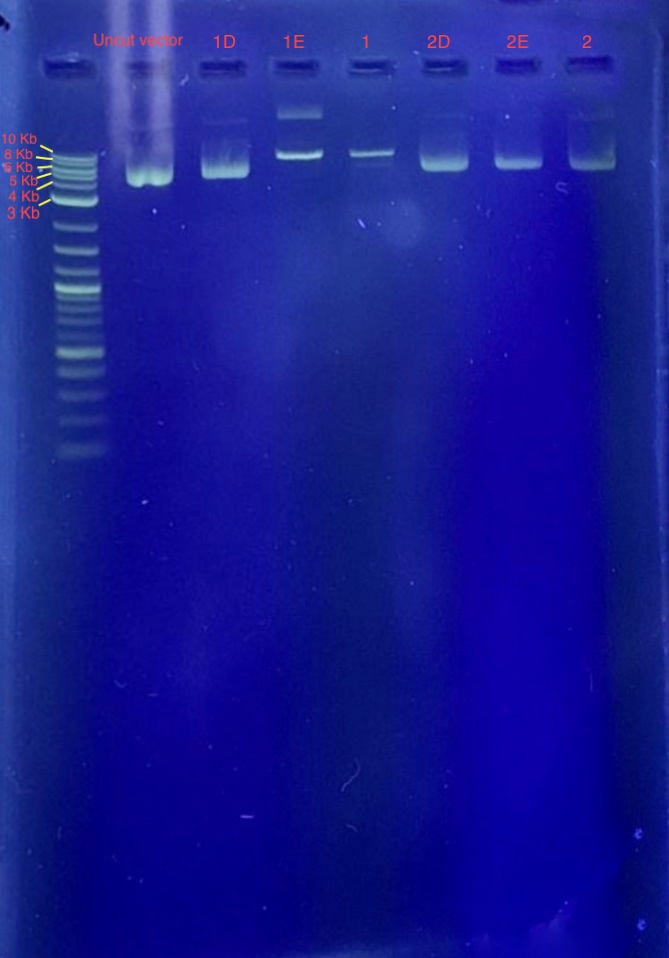
Reagents for running the 1% agarose gel:
* 4 uL 1Kb plus ladder
* restriction digest vectors (1E-2F)
* 4 uL 6X loading dye
* 2.5 uL SYBR safe.
* 1x TAE.
From the results we concluded that only one of the two restriction enzymes used for the digest functioned and just linearized the vector. Since the bands of samples 1E and 1F are around 7-8 Kb, we concluded that these samples contain our recombinant plasmid. Well 1 contains 4 uL 1 Kb plus ladder, Well 2 contains the plasmid before restriction digest, Wells 3-8 contains samples 1E-2F.
(5.) Cloning confirmation using insert primers for PCR:
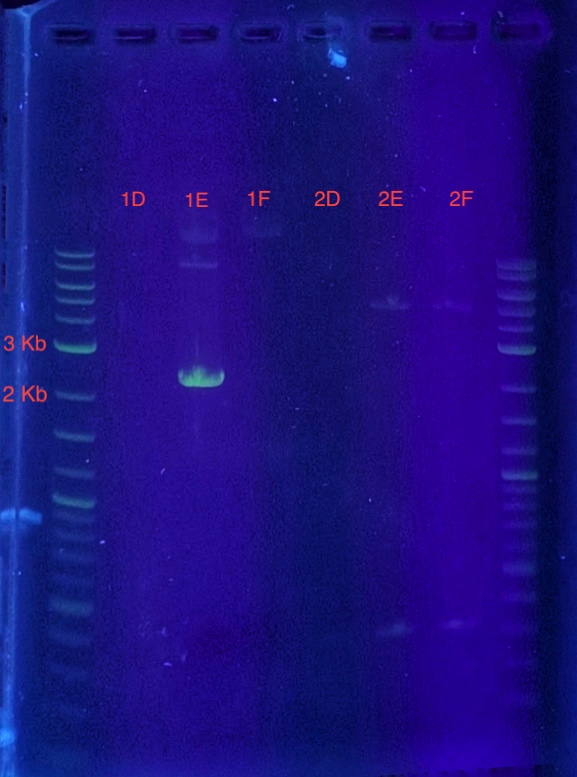
PCR reaction set-up:
* 12.5 uL Q5 High Fidelity 2X Master Mix
* 1.25 uL T7 Forward Primer
* 1.25 uL T7 Reverse Primer
* 1 uL DNA (samples 1E-2F, 6 PCR reaction tubes)
* 9 uL Molecular Biology Grade Water
Since sample 1E showed a band between 2-3 kb, it can be concluded that the recombinant vector in sample 1E contains the insert. Sample 1E indicates successful cloning of our insert into the vector using LIC and can be used for expression.
(6.) Transformation of Bl21 using the recombinant vector:

Transformation reaction:
*1 uL recombinant vector was added to a tube of Bl21 cells.
Place the tube on ice for 30 minutes.
* Place the tubes on the 42 C heat block.
* Place the tube on ice for 2 minutes.
* Add 1 mL of LB Broth to the tube and incubate in the shaker at 37 C, 220 rpm for 1 hour.
* Plate 150 ul from the transformation tube on ampicillin agar plates.
As evident from the figure, transformation was successful and colonies grew after incubating for about6 hours at 37 C.
(7.) Transformation of Origami B using the recombinant vector:
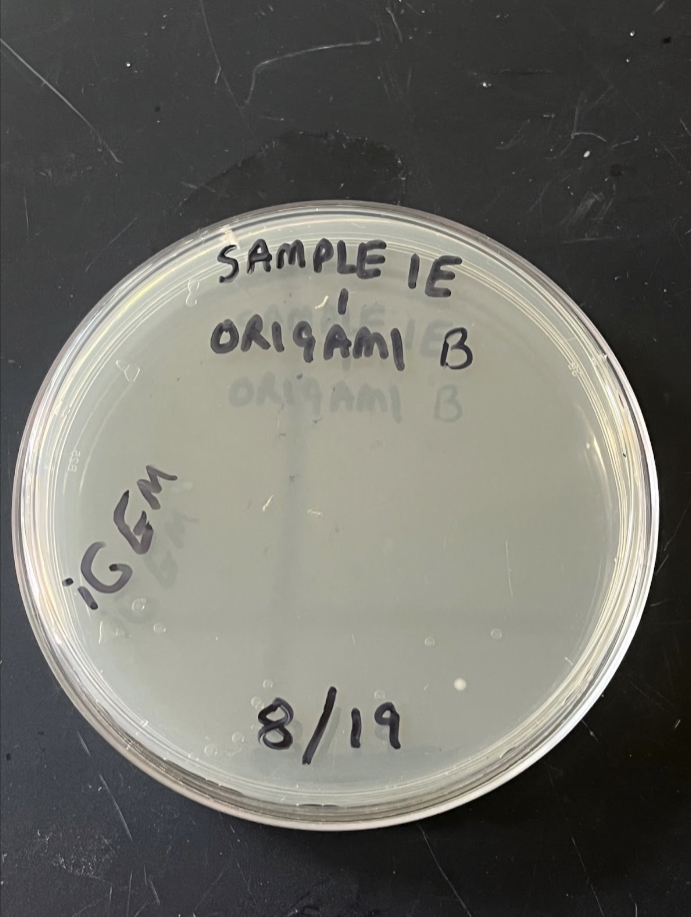
Transformation reaction:
*1 uL recombinant vector was added to a tube of Origami B cells.
Place the tube on ice for 30 minutes.
* Place the tubes on the 42 C heat block.
* Place the tube on ice for 2 minutes.
* Add 1 mL of LB Broth to the tube and incubate in the shaker at 37 C, 220 rpm for 1 hour.
* Plate 150 ul from the transformation tube on ampicillin agar plates.
As evident from the figure, transformation was successful and colonies grew after incubating for about6 hours at 37 C.
(8.) Western Blot result:
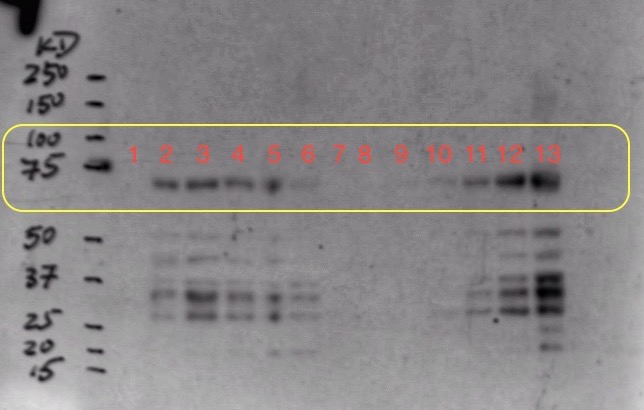
To optimize the expression, we decided to induce origami cells at 37 C and gradually reduce the temperature to 23 C and induce using 0.5 mM instead of 1 mM. We also decided to induce two origami samples at different cell concentrations in parallel. Moreover, we also sonicated the induction samples for 1 min and added protease inhibitors before performing the western blot.
Sample Ori 2 was induced at OD=0.4 and sample Ori 3 was induced at OD=1.1
We collected one pre-induction sample from both ori 2 and 3 before inducing with 0.5 mM IPTG and 4 post-induction samples at an increment of 1 hour. We expressed sample ori 2 for about 16 hours and ori 3 for about 12 hours to collect overnight induction samples.
Well mark-up is as follows:
- 1. Pre-induction Sample (Ori 2)
- 2. One hour post-induction (Ori 2)
- 3. Two hour post-induction (Ori 2)
- 4. Three hour post-induction (Ori 2)
- 5. Four hour post-induction (Ori 2)
- 6. Overnight induction (Ori 2)
- 7. Empty well (loading dye)
- 8. Pre-induction Sample (Ori 3)
- 9. One hour post-induction (Ori 3)
- 10. Two hour post-induction (Ori 3)
- 11. Three hour post-induction (Ori 3)
- 12. Four hour post-induction (Ori 3)
- 13. Overnight induction (Ori 3)
Protein modeling
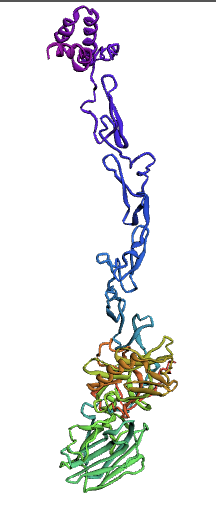
Bioinformatics tools can be used to model a protein structure if the amino-acid sequence of the protein is known. Computational protein structure prediction relies on principles obtained through techniques including X-ray crystallography, NMR spectroscopy and other physical energy functions to predict, with a certain level of accuracy, the three-dimensional structures of proteins. These methods use various Machine Learning algorithms to develop and predict comprehensive protein structures. We decided to use three methods for modeling our protein, protein S, for which there is not a structure available.
Here, we used the Ab-Initio Method to model Protein S structure. When there is not a known structure of a similar protein, this method can be used to determine the tertiary structure of a protein. This method conducts a conformational search using a designed energy function and generates a number of possible conformations. From these, final models can be selected.
The Protein S (PROS1) sequence comprises 676 amino acids. Through literature review, it was found that PROS1 is synthesized as a 676 amino acid precursor protein which is processed to a mature protein of 635 amino acids. The 41 amino acid difference between the two accounts for a signaling peptide that is necessary for the expression of the protein. A post-translational modification, specifically a simple singular peptide bond cleavage, results in the mature form of the protein that gets secreted. Therefore, we chose to model both the pre-cleaved PROS1 (676 AA), and the truncated mature PROS1 (635 AA).
676 Precursor Protein Sequence
MRVLGGRCGALLACLLLVLPVSEANFLSKQQASQVLVRKRRANSLLEETKQGNLERECIEELCNKEEARE
VFENDPETDYFYPKYLVCLRSFQTGLFTAARQSTNAYPDLRSCVNAIPDQCSPLPCNEDGYMSCKDGKASFTCTCKPGWQGEKCEFDINECKDPSNIN
GGCSQICDNTPGSYHCSCKNGFVMLSNKKDCKDVDECSLKPSICGTAVCKNIPGDFECECPEGYRYNLKSKSCEDIDECSENMCAQLCVNYPGGYTCYCDGKKGFKLAQ
DQKSCEVVSVCLPLNLDTKYELLYLAEQFAGVVLYLKFRLPEISRFSAEFDFRTYDSEGVILYAESIDHSAWLLIALRGGKIEVQLKNEHTSKITTGGDVINNGLWNMVSVEELE
HSISIKIAKEAVMDINKPGPLFKPENGLLETKVYFAGFPRKVESELIKPINPRLDGCIRSWNLMKQGASGIKEIIQEKQNKHCLVTVEKGSYYPGSGIAQFHIDYNNVSSAEGW
HVNVTLNIRPSTGTGVMLALVSGNNTVPFAVSLVDSTSEKSQDILLSVENTVIYRIQALSLCSDQQSHLEFRVNRNNLELSTPLKIETISHEDLQRQLAVLDKAMKAKVAT
YLGGLPDVPFSATPVNAFYNGCMEVNINGVQLDLDEAISKHNDIRAHSCPSVWKKTKNS
635 Mature Protein Sequence
ANSLLEETKQGNLERECIEELCNKEEAREVFENDPETDYFYPKYLVCLRSFQTGLFTAARQSTNAYPDLR
SCVNAIPDQCSPLPCNEDGYMSCKDGKASFTCTCKPGWQGEKCEFDINECKDPSNINGGCSQICDNTPGSYHCSCKNGFVMLSNKKDCKDVDECSLKPSICGTAVCKNI
PGDFECECPEGYRYNLKSKSCEDIDECSENMCAQLCVNYPGGYTCYCDGKKGFKLAQDQKSCEVVSVCLPLNLDTKYELLYLAEQFAGVVLYLKFRLPEISRFSAEFDF
RTYDSEGVILYAESIDHSAWLLIALRGGKIEVQLKNEHTSKITTGGDVINNGLWNMVSVEELEHSISIKIAKEAVMDINKPGPLFKPENGLLETKVYFAGFPRKVESEL
IKPINPRLDGCIRSWNLMKQGASGIKEIIQEKQNKHCLVTVEKGSYYPGSGIAQFHIDYNNVSSAEGWHVNVTLNIRPSTGTGVMLALVSGNNTVPFAVSLVDSTSEKS
QDILLSVENTVIYRIQALSLCSDQQSHLEFRVNRNNLELSTPLKIETISHEDLQRQLAVLDKAMKAKVATYLGGLPDVPFSATPVNAFYNGCMEVNINGVQLDLDEAIS
KHNDIRAHSCPSVWKKTKNS
(1.)676 Precursor Protein Sequence model:
(2.)635 Precursor Protein Sequence model:
Ramachandran plots
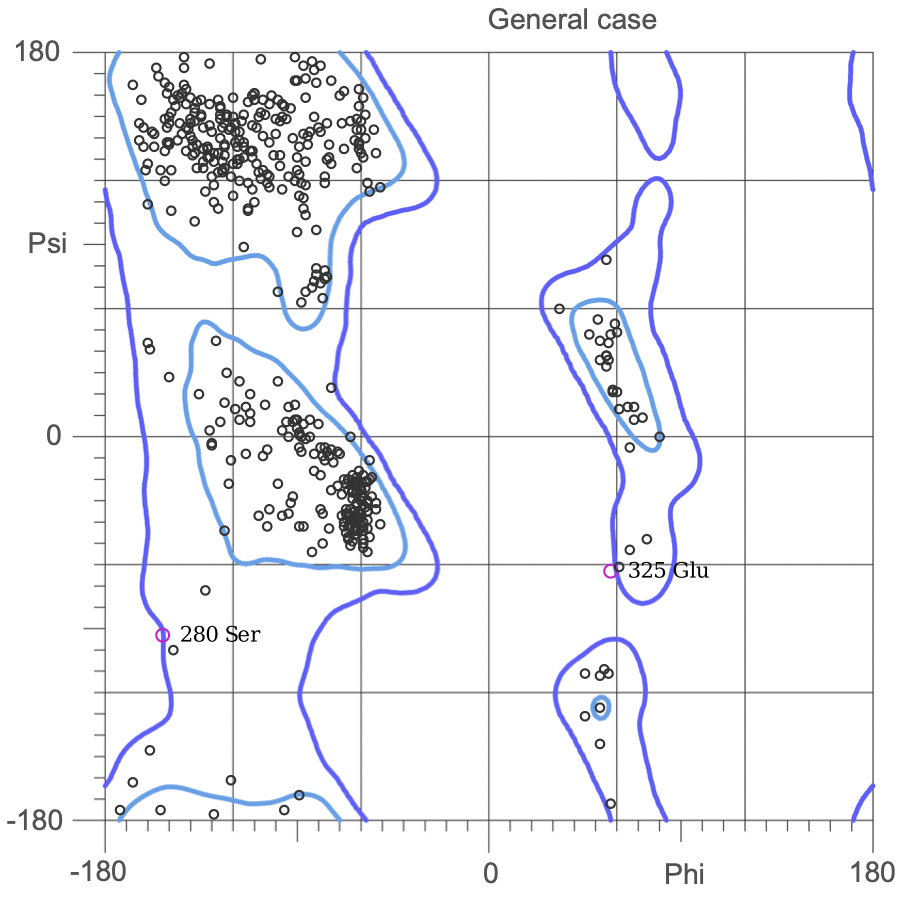
The Ramachandran plot shows the statistical distribution of the combinations of the backbone dihedral angles ϕ and ψ. It gives information about the energetically allowed and disallowed regions in the protein. Having a lower number of residues in the disallowed regions and a high number of residues in the allowed energy regions indicates a good protein structure. We measured this parameter across all models obtained from the ab-initio method. The Ramachandran plots have been generated using MolProbity. It is most complete for crystal structure of proteins and acts as an active validation tool that produces coordinates, graphics and numerical evaluations. Higher weightage was given to the Ramachandran Plot values over the RMSD values.
(3.)Ramachandran Plot for the 676 Precursor Protein Sequence:
(4.)Ramachandran plot for the 635 Precursor Protein Sequence:
Conclusion
Through protein modeling, we were better able to understand the behavior of protein S, allowing us to understand how cells function and how the misfolded protein can cause disease. This data proved useful in allowing us to understand how the protein structure can change with different genetic mutations, and how this contributes to type I, type II, and type III protein S deficiency.
The protein modeling also gave us better insight into possible mutations that may arise when trying to express a recombinant version of the protein, and what the possible variations of our product might be from natural, functional protein S. Overall, generating possible structures provided us with a greater level of understanding of how protein S works, allowing us to create hypotheses about how to affect, control, and modify it. Even in the future, beyond iGEM, knowing the protein’s structure can also allow us to possibly design site-directed mutations with the intent of changing the protein function. We also plan on looking into the interaction between protein S and protein C, its binding partner, and using protein modeling to help predict their activity. This modeling provides an important first step that offers invaluable insight into our protein structure, function, and molecular dynamics.
Mathematical modeling
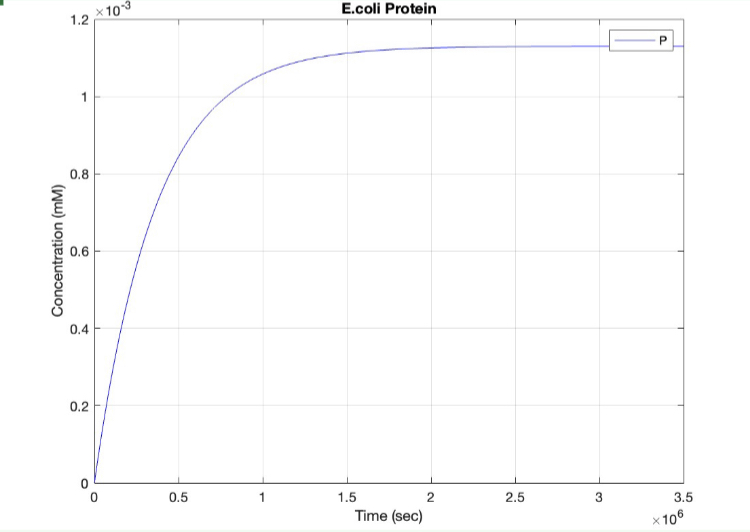
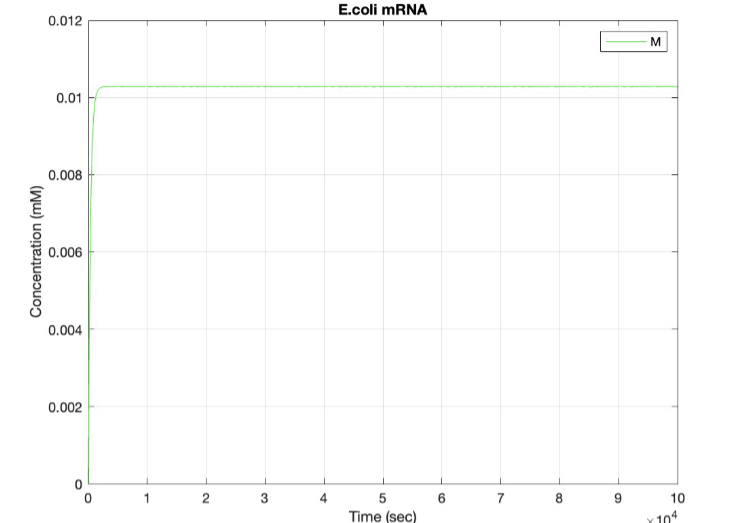
We used MATLAB simulations to model our genetic circuits. We used a system of ODEs derived for both constitutive and regulatory genetic circuits(IPTG inducible lac operon) for our E coli expression system. We were able to input our system of ODE’s into MATLAB to predict our steady state concentrations prior to starting wet lab in order to determine the process that would yield more favorable results. Those plots can be found below:
E coli constitutive gene circuit model:
(1.) Protein vs time:
(2.) mRNA vs time:
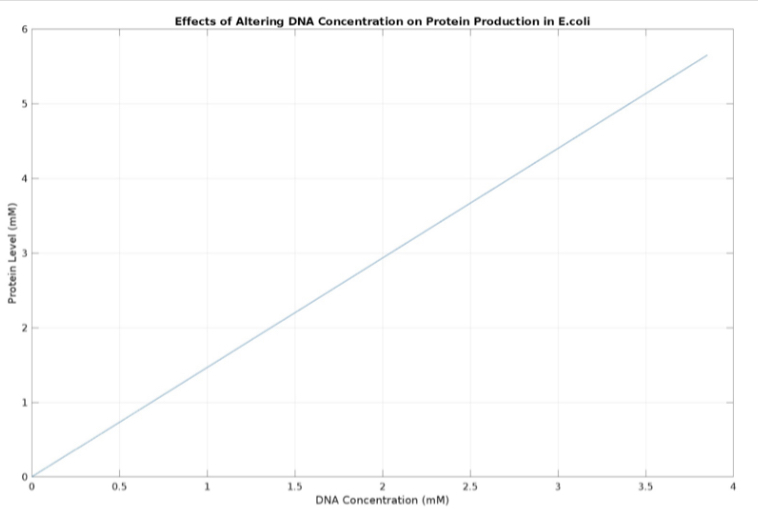
(3.) Effects of altering DNA concentration on protein production:


