Difference between revisions of "Part:BBa K1096001"
NJAU-Chappie (Talk | contribs) (→Contribution) |
NJAU-Chappie (Talk | contribs) (→Contribution) |
||
| Line 69: | Line 69: | ||
<html> | <html> | ||
| − | <img src="https://2020.igem.org/wiki/images/2/2f/T--NAU-CHINA--contributionCS%EF%BC%88A%EF%BC%89.png" style="width: | + | <img src="https://2020.igem.org/wiki/images/2/2f/T--NAU-CHINA--contributionCS%EF%BC%88A%EF%BC%89.png" style="width:45%"/> |
</html> | </html> | ||
<html> | <html> | ||
| − | <img src="https://2020.igem.org/wiki/images/c/c4/T--NAU-CHINA--contributionCS%EF%BC%88B%EF%BC%89.png" style="width: | + | <img src="https://2020.igem.org/wiki/images/c/c4/T--NAU-CHINA--contributionCS%EF%BC%88B%EF%BC%89.png" style="width:45%"/> |
</html> | </html> | ||
Revision as of 14:44, 27 October 2020
MazE protein (E. coli)
MazE-MazF is a toxin-antitoxin module found in bacteria. MazE is the antitoxin protein.
Contribution
Group: NAU-CHINA iGEM 2020
We checked the data of gene mazE, Part:BBa_K1096001, finding that there was no data about using CRISPRi technology to knock down the gene mazEF of E. coli Nissle1917 in situ and exploring the relevant data about its impact on biofilm and persistence. Thus, we checked the literature to supplement it.
1. Knock down the mazEF gene and hipA gene of E. coli Nissle1917 in situ
This part starts with EcN1917 bacteria and establishes a knockdown operation system that can be applied to toxin-antitoxin system research. The ppgRmA and ppgRhA recombinant plasmids were successfully constructed and transformed into EcN1917 simultaneously with the pdCas9 plasmid. The system of MazE and hipA was successfully knocked down through RT-PCR verification, and the expression of other gene clusters was not affected. In addition, double antibody screening combined with gene sequencing technology could quickly screen positive clones, avoiding the arduous tasks caused by colony PCR.
1.1.Detection on the knockdown of mazE and hipA in situ by RT-PCR
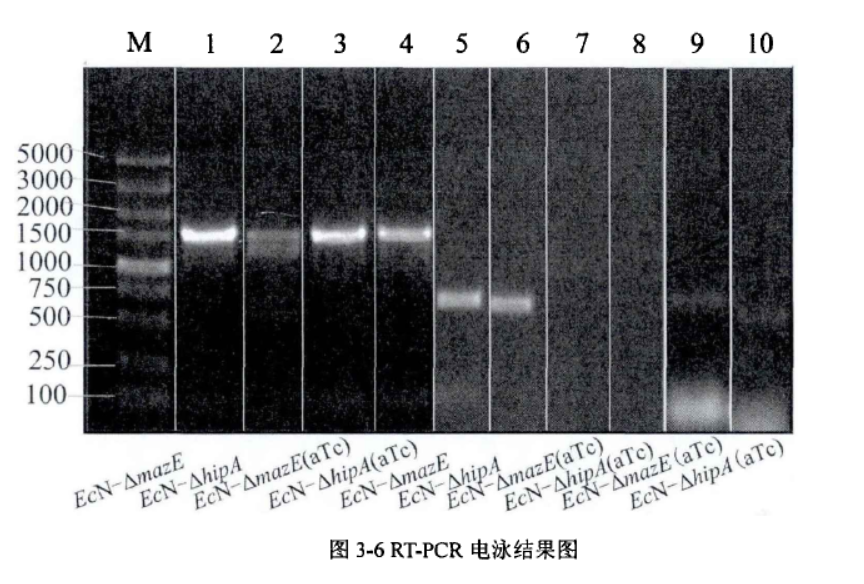
Fig.1. RT-PCR electrophoresis results(Li Pinyi. Zhejiang Gongshang University. 2014)
The system of mazE and hipA was successfully knocked down through RT-PCR verification, and the expression of other gene clusters was not affected.
2. Knock down mazEF gene and hipA gene in situ to explore its impact on persister bacteria and biofilm
This experiment used CRISPRi to knock down the mazEF gene and hipA gene in situ in EcN1917 to study the influence of mazEF gene and hipA gene on the formation of biofilm and persister bacteria.
2.1.Determination about the effect of mazE on biofilm
Experimental method: crystal violet staining method (quantitative)

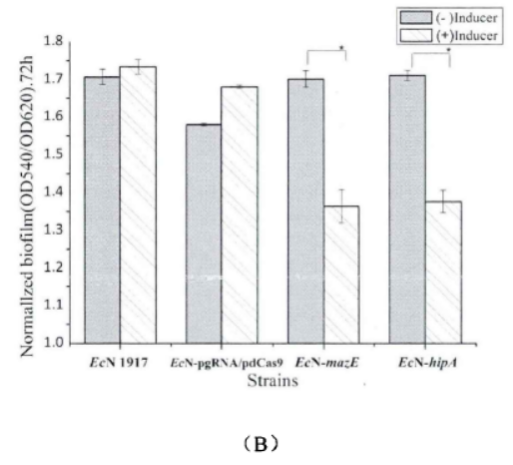
Fig.2. Comparison chart of relative biofilm of each strain(Li Pinyi. Zhejiang Gongshang University. 2014)
(A) The biofilm growth of EcN1917, EcN-pgRNA/pdCas9, EcN-▲mazE, EcN-▲hipA strains with or without inducers after 24h.
(B) The biofilm growth of EcN1917, EcN-pgRNA/pdCas9, EcN-▲mazE, EcN-▲hipA strains with or without an inducer after 72h.
The amount of biofilm formation in the wild strain EcN1917 and the EcN-pdCas9/pgRNA containing the original plasmid system increased slightly after induction, but there was no significant difference between them in statistical analysis, indicating that the original plasmid had no significant effect on growth. But after CRISPRi knockdown expression, the biofilm formation of EcN-▲mazE and EcN-▲hipA was significantly inhibited.
2.2.Determination about the effect of mazE on persister bacteria
The persistence test is usually measured by the antibiotic method. However, considering that the two plasmids of the knockdown system in this study had two kinds of resistance (ampicillin and chloramphenicol), they used a new method to test persistence—enzyme lysis method, which was used to determine the sterilization curve, to avoid resistance cross-interference. In order to further verify the validity of the enzymatic measurement results, they adopted the classic method of persistence formation determination, the antibiotic method, to repeat the sterilization curve determination for verifying TA expression’s influence on strain’s persistence.
2.2.1.Enzyme lysis method
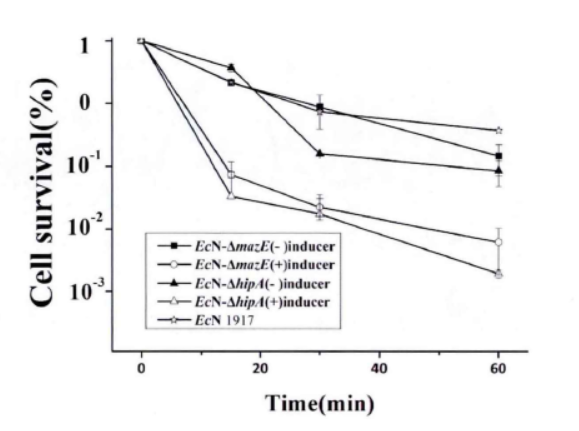
Fig.3. The killing curve on effect of mazEF and hipA on the formation of persiser cell(Li Pinyi. Zhejiang Gongshang University. 2014)
Note: All tested strains would reach a short-term stability for more than 60 minutes after we add lysozyme for 15 minutes in the stable period. (The error range represents the standard deviation (n=3).)
This figure shows that the knockdown of mazE and hipA genes inhibits the formation of persister bacteria.
2.2.2. Antibiotic method
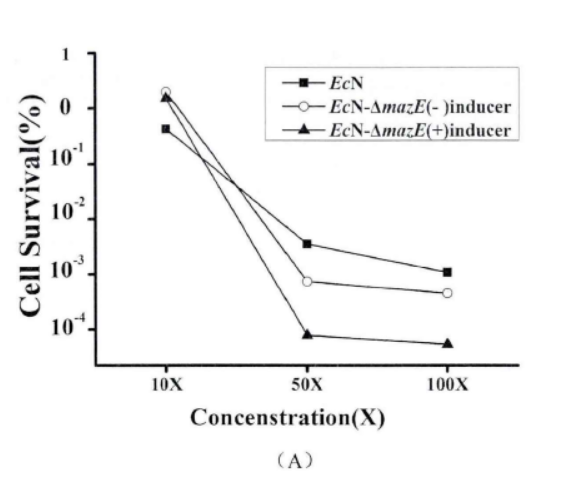
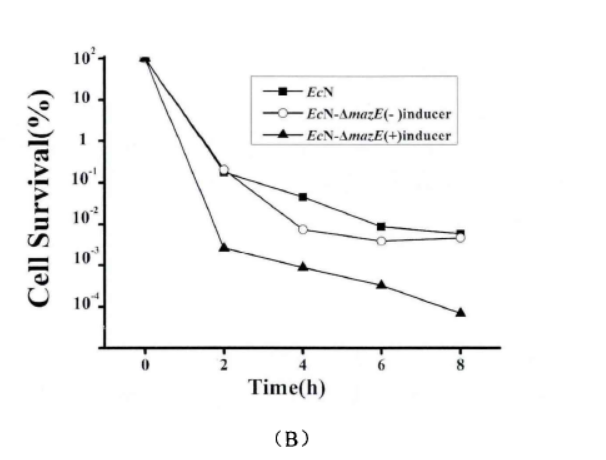
Fig.4. The effect of mazEF on the formation of persister cells(Li Pinyi. Zhejiang Gongshang University. 2014)
Note: (A) The survival rates of EcN1917 with inducer and EcN-▲mazE without inducer were determined by using 50mg/ml kana mother liquor to make different concentrations (adding 2uM aTc when T=0). (10X: 10 times of the MIC; 50X: 50 times of the MIC; 100X: 100 times of the MIC.) (B) EcN1917, EcN-▲mazE strains with and without inducers respectively were added 2uM aTc at (T=0) and measured the survival rate at OD600 around 1 after adding 50X MIC concentration of kana antibiotic, and measured the survival rate at 2, 4, 6, 8 h. The error bar represented the average error in A and B (n=3)
When mazEF was knocked down, it significantly interfered with the persistence formation of EcN1917. The survival curves of EcN1917 and EcN-▲mazE induced and non-induced strains measured by the antibiotic method were similar to the results of the enzymatic method, indicating that the enzymatic method could be used to measure persistent cells.
Summary:
Through antibiotics and enzymatic methods on the determination of persister cells, the knockdown of mazEF and hipA reduces the formation of persister cells. The enzymatic measurement has the same effect as the antibiotic method. The resistance of the strain to different antibiotics is different. The killing curve measured by the antibiotic method has an impact on the selected antibiotic type, and when the strain has more than one resistance, there are too many factors influencing the antibiotic method. At this time, the enzymatic method is a good choice.
Reference Li Pinyi. Crispri in situ investigates functions of toxin-antitoxin system in Escherichia Coli Nissle 1917[D]. Zhejiang Gongshang University,2019.
Characterization
Group: Tokyo Tech 2016
Author: Kazuki Fujisawa
We designed parts(BBa_K1949100, BBa_K1949101, BBa_K1949102, BBa_K1949103, BBa_K1949104) to characterize mazE(BBa_K1096001) and mazF(BBa_K1096002).
Characterize
We performed experiment to work our final genetic circuits and characterized mazE and mazF.
This experiment consists of the four parts below.
Ⅰ.Adjustment of mazF Expression
Ⅱ.mazEF System Assay ~Stop & GO~
Ⅲ.mazEF System Assay ~Go & Stop~
Ⅳ.mazEF System Assay on the LB Agar Plate (Queen's Caprice)
Ⅰ.Adjustment of mazF Expression
In order to control cell growth as we desire using the mazEF system, it is necessary to adjust the expression level of mazF. It has been reported that MazF has very strong ability to inhibit cell growth and that mazE expression can not recover it when mazF is expressed at high level[1]. Therefore, we here explored the relationship between concentration of the expression inducer for mazF (arabinose in this experiment) and expression level of it; such information is important for operating our final genetic circuits properly.
We constructed
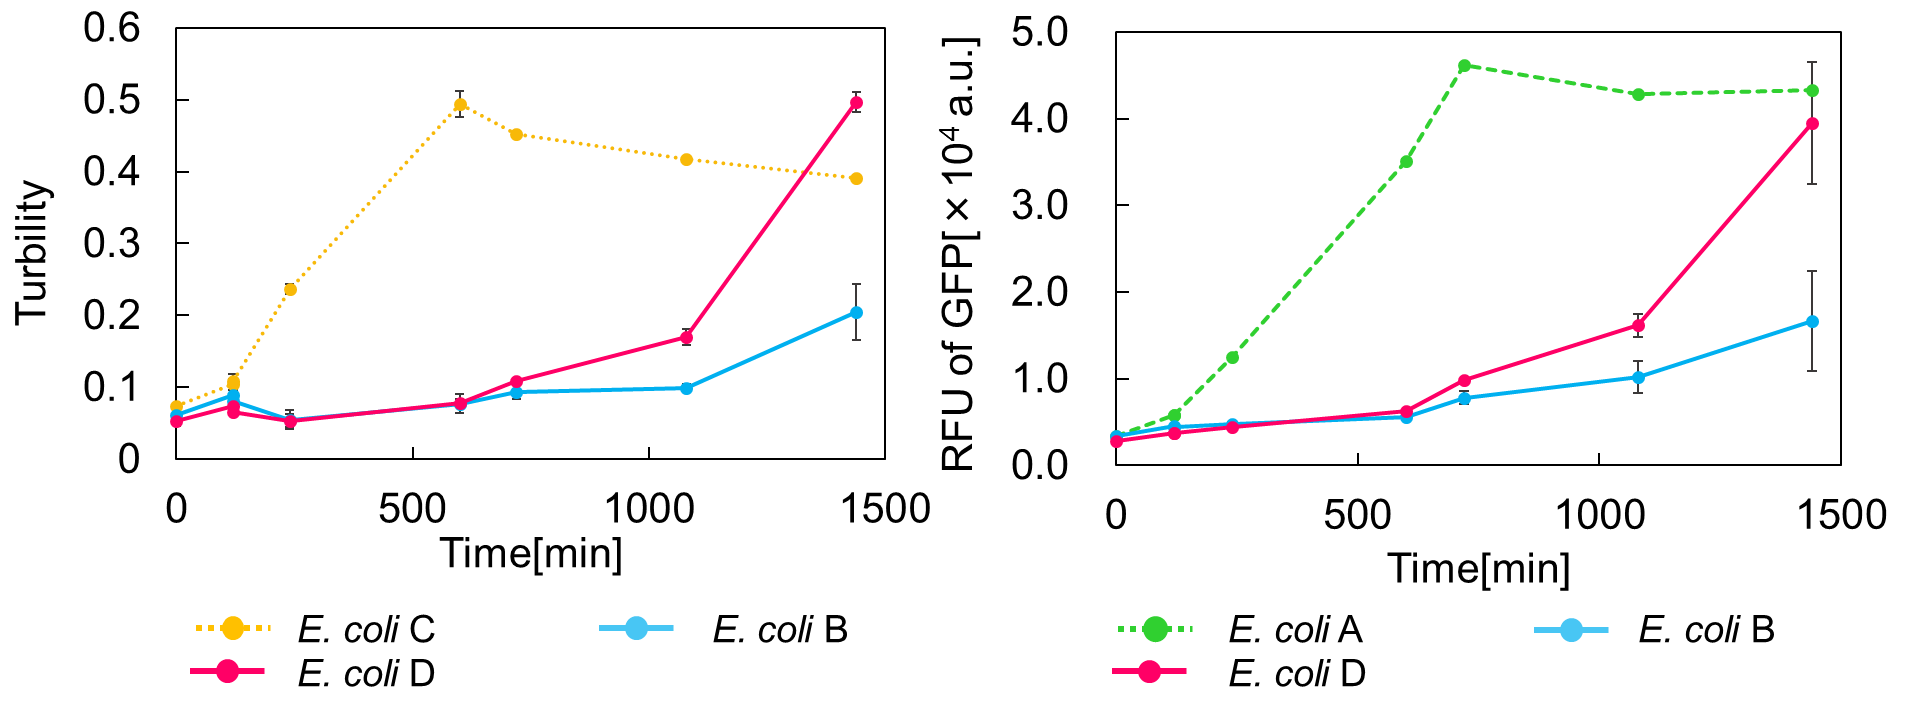
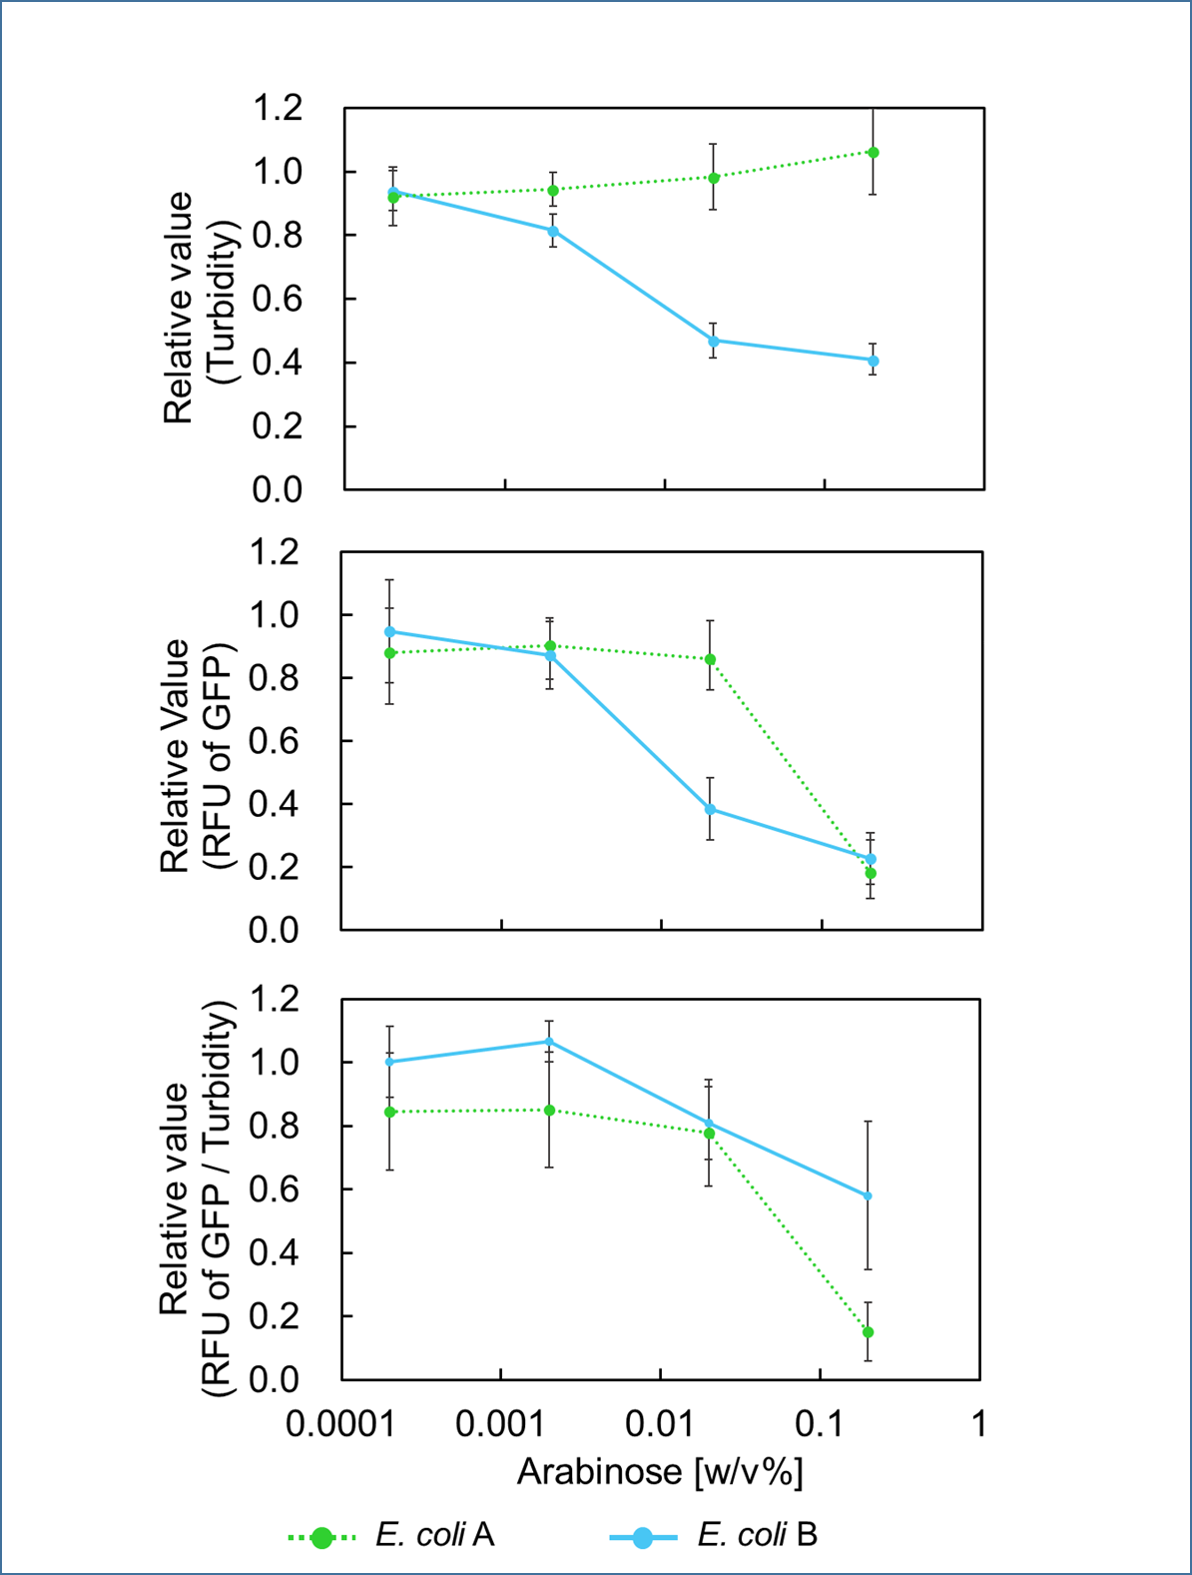
E. coli A: Pcon - rbs - gfp (pSB6A1), Plac - rbs (pSB3K3)
E. coli B: PBAD - rbs - mazF - tt - Pcon - rbs - gfp (pSB6A1), Plac - rbs (pSB3K3).
result
It was found that cell growth of E. coli B was inhibited under arabinose (inducer for mazF) concentrations of over 0.02% (Fig. 1). Interestingly, at arabinose concentration of 0.2%, GFP fluorescence intensity fell markedly, regardless of mazF expression, suggesting that high arabinose concentrations may inhibit gfp expression or prevent GFP from exerting fluorescence. Taken together, it is concluded that the concentration of arabinose should be 0.02%.
Ⅱ.mazEF System Assay ~Stop & GO~
The most attractive feature of the mazEF system is that cytotoxity of a toxin protein (MazF) is determined by the stoichiometric ratio of a toxin protein to a corresponding antitoxin protein (MazE) in cells. The story of Snow White involves sleep and resuscitate from sleep, and thus, we think that this feature is useful for our project.
We constructed
E. coli C: PBAD - rbs (pSB6A1), Plac - rbs (pSB3K3)
E. coli A: Pcon - rbs - gfp (pSB6A1), Plac - rbs (pSB3K3)
E. coli D: PBAD - rbs - mazF - tt - Pcon - rbs - gfp (pSB6A1), Plac - rbs - mazE (pSB3K3)
E. coli B: PBAD - rbs - mazF - tt - Pcon - rbs - gfp (pSB6A1), Plac - rbs (pSB3K3).
result
As shown in Fig. 2, when the mazE expression was induced 2 h after the mazF expression, cell growth resumed gradually. Similarly, the RFU of GFP also increased mazF expression, and about 8 h later, cell growth resumed. Similarly, the RFU of GFP was also resumed. Before starting the experiments, we anticipated that recovery from the growth inhibition by mazF would be observed immediately after the induction of mazE expression. However, it took 8 h for us to observe the recovery. The reason is unclear, but the prior expression of mazF might damage the cells and it might take time to repair. Alternatively, the mazF expression might lead cells to the dormant state from which cells can hardly escape. We assume that this feature is advantageous for our Snow White project, because we can prolong the sleeping time of Snow White and take sufficient time for Prince to find Snow White. As a conclusion, the “Stop and Go” experiment was successful.
Ⅲ.mazEF System Assay ~Go & Stop~
In experimentⅡ, a toxin inhibits cell growth, and an antitoxin resuscitates it. However, what will happen when a toxin is expressed after the constitutive expression of antitoxin? Therefore, in the experiments of this section, we conducted a reciprocal experiment and named this experiment "Go & Stop".
We constructed
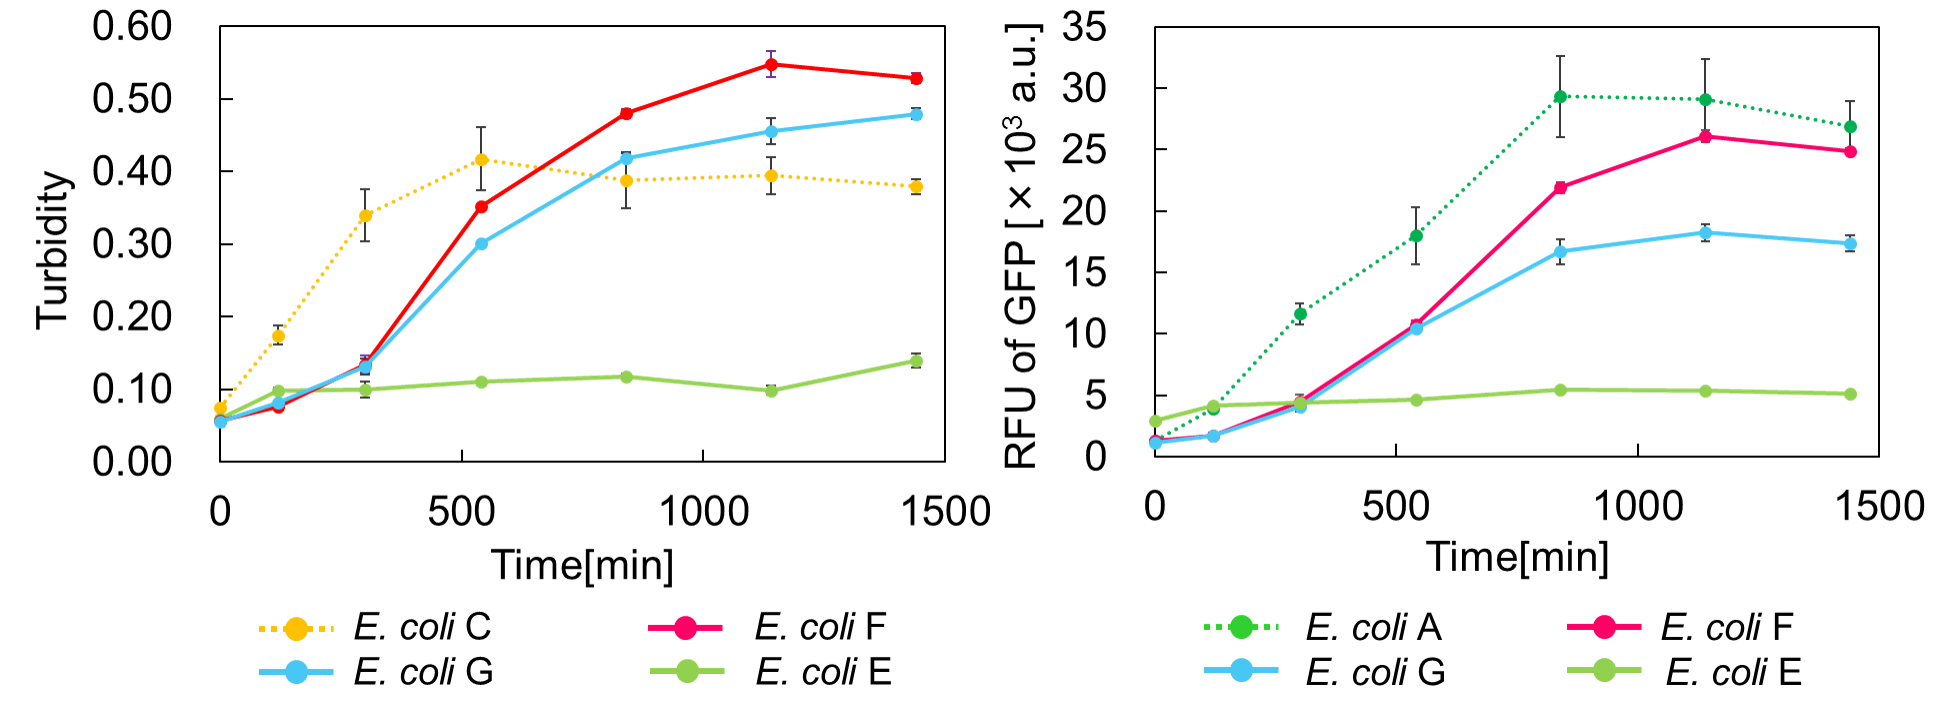
E. coli C: PBAD - rbs (pSB6A1), Plac - rbs (pSB3K3)
E. coli A: Pcon - rbs - gfp (pSB6A1), Plac - rbs (pSB3K3)
E. coli G: PBAD - rbs - mazF - tt - Pcon - rbs - gfp (pSB6A1), Pcon - rbs(weak) - mazE (pSB3K3)
E. coli F: PBAD - rbs - mazF - tt - Pcon - rbs - gfp (pSB6A1), Pcon - rbs - mazE (pSB3K3)
E. coli E: PBAD - rbs - mazF - tt - Pcon - rbs - gfp (pSB6A1), vector (pSB3K3).
result
Turbidity of E. coli G stopped earlier than that of E. coli F (Fig. 3), indicating that cellular mazE amount over MazF amount affects cytotoxity of MazF. In other words, the cytotoxity of MazF is determined stoichiometrically. Similarly, final RFU of E. coli G was lower than that of E. coli F. From the results of ExperimentⅠ and ExperimentⅡ, it is expected that mazEF can repeatedly control cell growth.
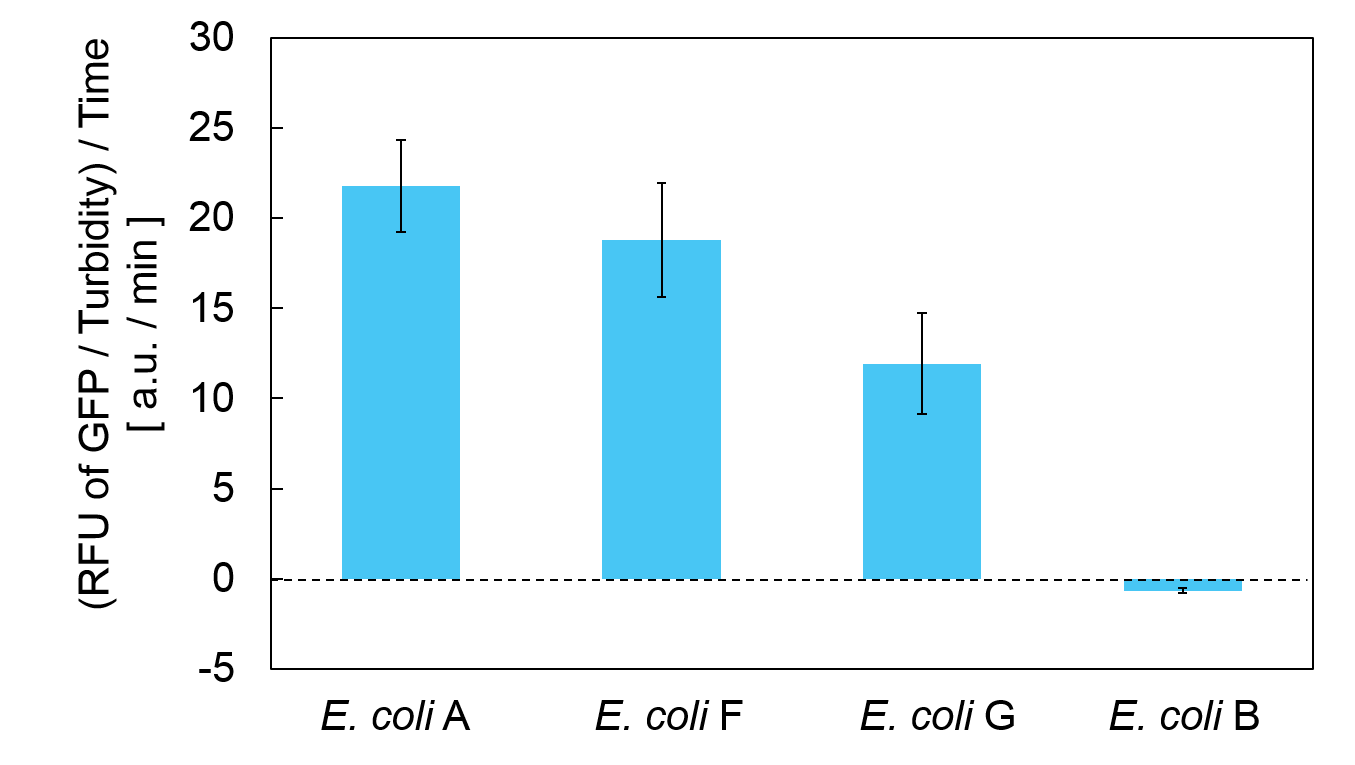
Calculation of the change of RFU of GFP / Turbidity per unit time (translation efficiency) indicates that the expression level of mazE correlated with the translation efficiency(Fig. 4).
Ⅳ.mazEF System Assay on the LB Agar Plate(Queen's Caprice)
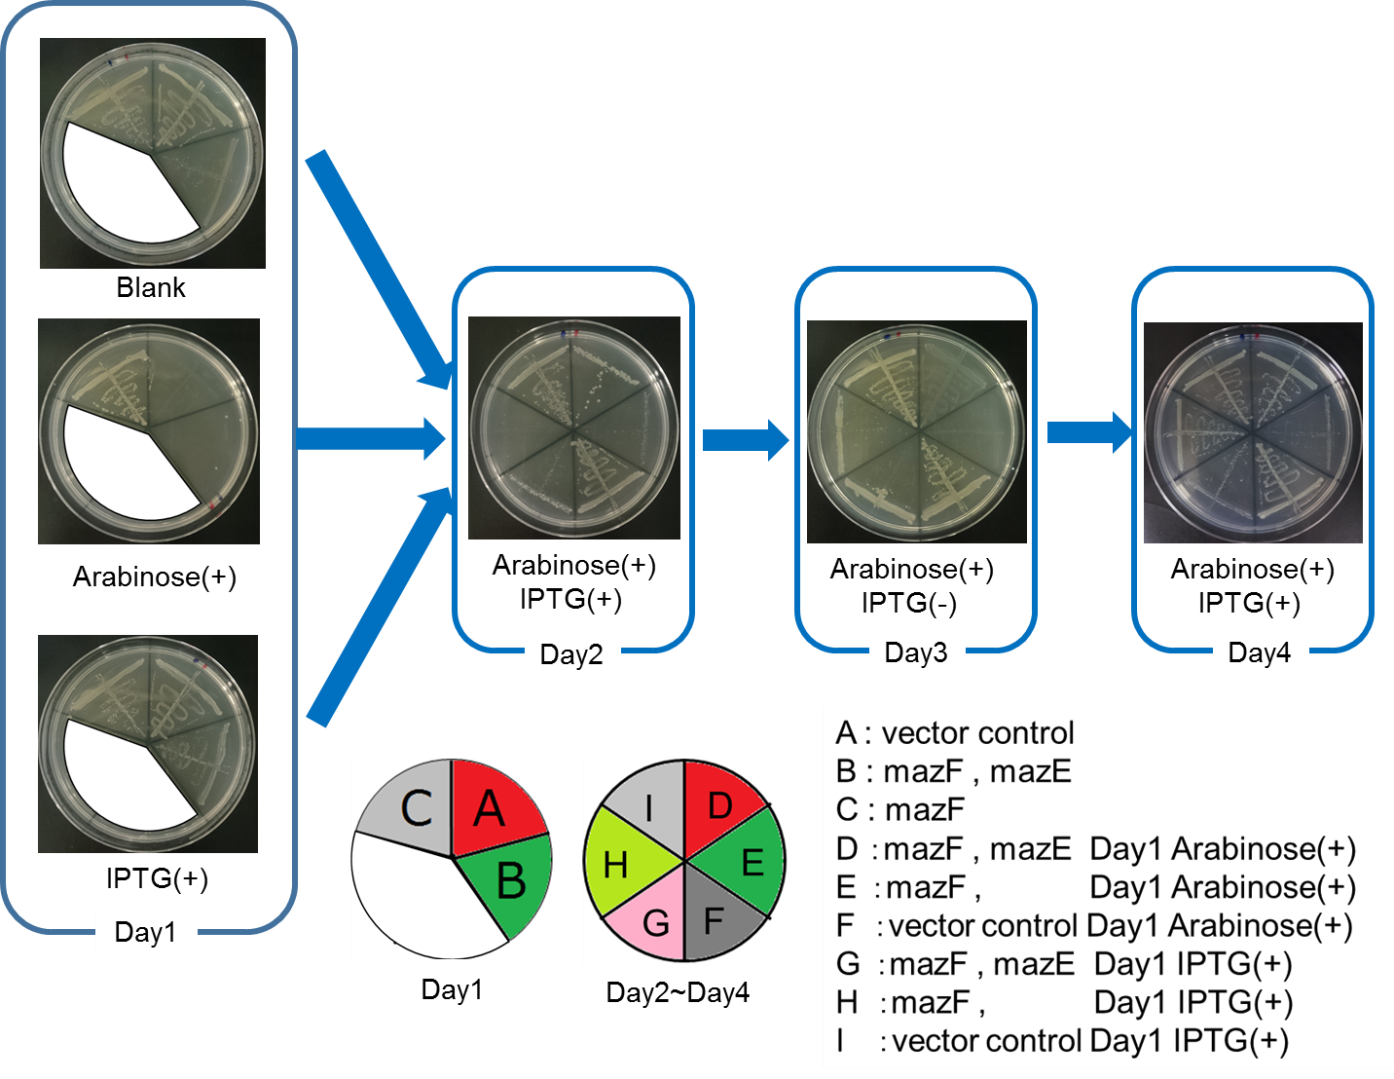
The control of cell growth by the mazEF system has been shown until the previous sections. In this section, we analyzed whether the “stop & go” experiment can be repeated many times. It seemed like that dormancy of Snow White was controled by Queen, we named this experiment "Queen's caprice".
We constructed
E. coli i: PBAD - rbs (pSB6A1), Plac - rbs (pSB3K3)
E. coli D: PBAD - rbs - mazF (pSB6A1), Plac - rbs - mazE (pSB3K3)
E. coli H: PBAD - rbs - mazF(pSB6A1), Plac - rbs (pSB3K3).
result
From the result, it was clarified that growth of E. coli cells was repeatedly controlled by expression of mazE (Fig. 5 and Fig. 6). We believe that the repeated control of cell growth is very useful for the future biotechnology; see http://2016.igem.org/Team:Tokyo_Tech/Human_Practices.
reference
[1] Hazan, R., B. Sat, and H. Engelberg-Kulka. E. coli mazEF mediated cell death is triggered by various stressful conditions. J. Bacteriol. 2004 Dec;186(24):8295-8300.
Sequence and Features
- 10COMPATIBLE WITH RFC[10]
- 12COMPATIBLE WITH RFC[12]
- 21INCOMPATIBLE WITH RFC[21]Illegal BamHI site found at 47
- 23COMPATIBLE WITH RFC[23]
- 25COMPATIBLE WITH RFC[25]
- 1000COMPATIBLE WITH RFC[1000]

