Difference between revisions of "Part:BBa K1131000"
(→SZU-China 2020 iGEM TEAM) |
(→SZU-China 2020 iGEM TEAM) |
||
| Line 21: | Line 21: | ||
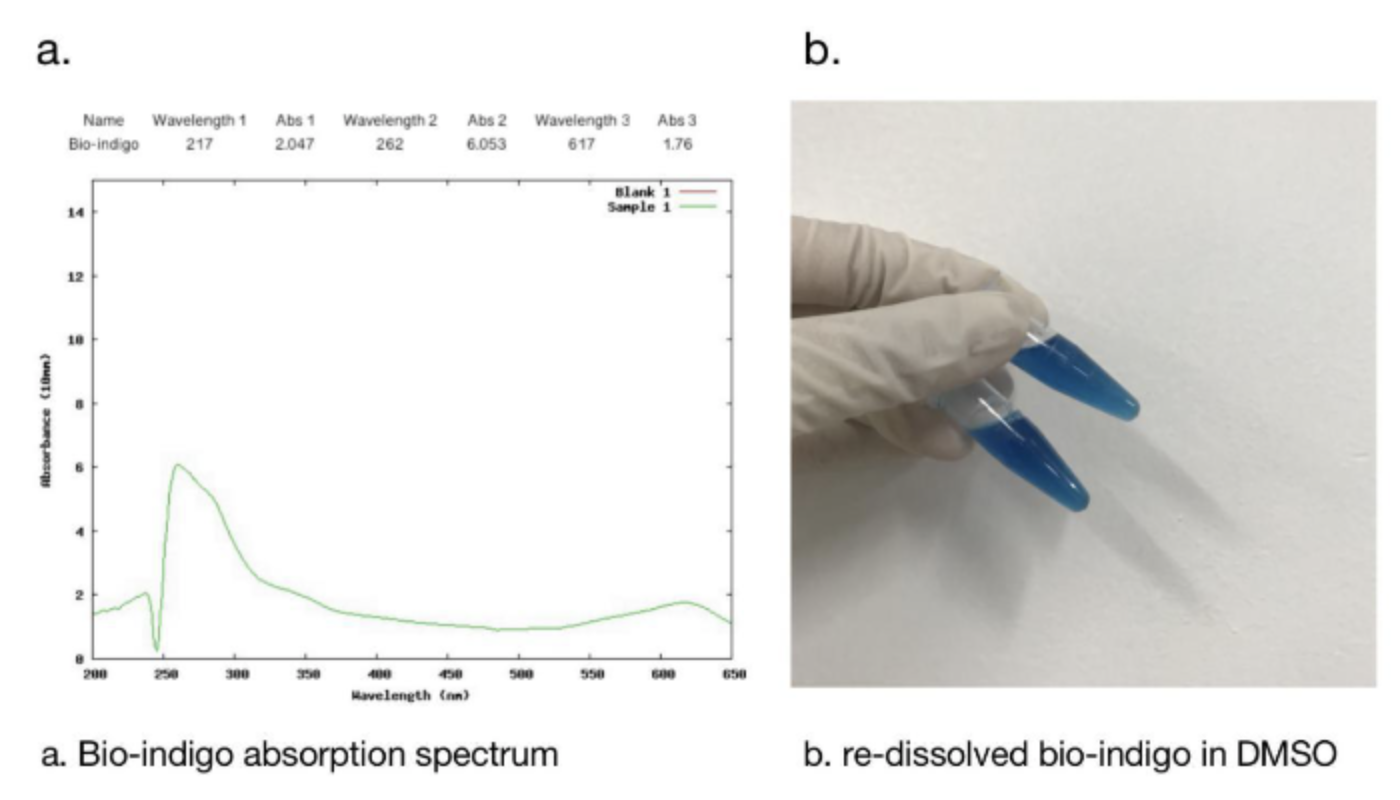
2.1 Bio-indingo Absorption Spectrum <br> | 2.1 Bio-indingo Absorption Spectrum <br> | ||
We used DMSO for resolubilization, and bio-indigo had an obvious absorption peak at 617nm, which was the same as that recorded in the literature. And the pigment is clearly blue in daylight. | We used DMSO for resolubilization, and bio-indigo had an obvious absorption peak at 617nm, which was the same as that recorded in the literature. And the pigment is clearly blue in daylight. | ||
| − | [[File: Bioidigo absorption spectrum.png|center| | + | [[File: Bioidigo absorption spectrum.png|center|500px]] |
2.2 Indigo Standard Curve<br> | 2.2 Indigo Standard Curve<br> | ||
Prepare indigo standard samples with sample concentrations of 0.8mg/ml, 0.72mg/ml, 0.64mg/ml, 0.48mg/ml, 0.4mg/ml 0.32mg/ml, 0.24mg/ml, 0.16mg/ml, 0.08mg /ml, 0mg/ml, measure the absorbance at 620 nm with an ultraviolet-visible spectrophotometer, and draw a standard curve.<br> | Prepare indigo standard samples with sample concentrations of 0.8mg/ml, 0.72mg/ml, 0.64mg/ml, 0.48mg/ml, 0.4mg/ml 0.32mg/ml, 0.24mg/ml, 0.16mg/ml, 0.08mg /ml, 0mg/ml, measure the absorbance at 620 nm with an ultraviolet-visible spectrophotometer, and draw a standard curve.<br> | ||
| − | [[File: Indigo standard curve.png|center| | + | [[File: Indigo standard curve.png|center|500px]] |
2.3 Determination of Bio-indigo <br> | 2.3 Determination of Bio-indigo <br> | ||
| Line 31: | Line 31: | ||
Then, the cell pellet was resuspended by dimethyl sulfoxide (DMSO), and tested by ultraviolet-visible spectrophotometer UV-2250 for optical density at 620 nm. <br> | Then, the cell pellet was resuspended by dimethyl sulfoxide (DMSO), and tested by ultraviolet-visible spectrophotometer UV-2250 for optical density at 620 nm. <br> | ||
Compare the data obtained in the experiment with the standard curve of the indigo sample to determine the indigo production. <br> | Compare the data obtained in the experiment with the standard curve of the indigo sample to determine the indigo production. <br> | ||
| + | [[File: Bio-indigo Production.png|center|500px]] | ||
| + | |||
| + | In addition, we got the unexpected orange-red dye in the fermentation product. After we contacted with SHANGHAI_SFLS_SPBS, we found that this phenomenon also happened in their experiments. After consulting the literature, we found that this may be due to the production of isatin, which is obtained by oxidation of indigo. It is preliminarily speculated that this is due to the overexpression of FMO, which caused the indigo to be further oxidized into isatin. | ||
Revision as of 19:23, 18 October 2020
Flavin-containing monooxygenase (FMO); M. aminisulfidivorans
This Flavin-containing monooxygenase (FMO) from M. aminisulfidivorans can be expressed in many strains of E. Coli to produce indigo dye. In the presence of indole and oxygen, FMO can catalyze the addition of a hydroxyl group to indole generating the intermediate indoxyl. Indoxyl then naturally oxidizes to generate indigo which, due to its hydrophobicity, crashes out of solution. The part submitted is the ORF of FMO only.
Sequence and Features
- 10COMPATIBLE WITH RFC[10]
- 12COMPATIBLE WITH RFC[12]
- 21INCOMPATIBLE WITH RFC[21]Illegal BamHI site found at 1369
- 23COMPATIBLE WITH RFC[23]
- 25COMPATIBLE WITH RFC[25]
- 1000COMPATIBLE WITH RFC[1000]
SZU-China 2020 iGEM TEAM
1.Species Source
In order to better characterize the bacterial flavin-containing monooxygenase (bFMO) documented by BBa_1131000, we found many literature about FMO that are also from M. aminisulfidivorans. The species’current name is Methylophaga aminisulfidivorans MP, and in some early literature it may be named as Methylophaga aminisulfidivorans SK1. Its taxonomy ID in NCBI is 1026882.
2.Experimental Characterization
2.1 Bio-indingo Absorption Spectrum
We used DMSO for resolubilization, and bio-indigo had an obvious absorption peak at 617nm, which was the same as that recorded in the literature. And the pigment is clearly blue in daylight.
2.2 Indigo Standard Curve
Prepare indigo standard samples with sample concentrations of 0.8mg/ml, 0.72mg/ml, 0.64mg/ml, 0.48mg/ml, 0.4mg/ml 0.32mg/ml, 0.24mg/ml, 0.16mg/ml, 0.08mg /ml, 0mg/ml, measure the absorbance at 620 nm with an ultraviolet-visible spectrophotometer, and draw a standard curve.
2.3 Determination of Bio-indigo
ProductionThe cells were harvested by centrifugation at 110,000 rpm for 5 mins, after which the supernatant was removed and the precipitation was rinsed by distilled water twice.
Then, the cell pellet was resuspended by dimethyl sulfoxide (DMSO), and tested by ultraviolet-visible spectrophotometer UV-2250 for optical density at 620 nm.
Compare the data obtained in the experiment with the standard curve of the indigo sample to determine the indigo production.
In addition, we got the unexpected orange-red dye in the fermentation product. After we contacted with SHANGHAI_SFLS_SPBS, we found that this phenomenon also happened in their experiments. After consulting the literature, we found that this may be due to the production of isatin, which is obtained by oxidation of indigo. It is preliminarily speculated that this is due to the overexpression of FMO, which caused the indigo to be further oxidized into isatin.


