
Difference between revisions of "Part:BBa K3292001"
| Line 12: | Line 12: | ||
The other characterization assay was a fluorescence measurement, where bacteria were growth at 30ºC for 3 hrs. Then 100µl of the grown bacteria were induced with IPTG at 0, 40, 200 and 400 mMm microtiter florescent measures were taken every half an hour for a period of 3 hours. Absorption and emission values were 395/509 nm. | The other characterization assay was a fluorescence measurement, where bacteria were growth at 30ºC for 3 hrs. Then 100µl of the grown bacteria were induced with IPTG at 0, 40, 200 and 400 mMm microtiter florescent measures were taken every half an hour for a period of 3 hours. Absorption and emission values were 395/509 nm. | ||
| − | |||
| − | |||
| − | |||
| − | |||
<div class = "left"> | <div class = "left"> | ||
https://2019.igem.org/wiki/images/thumb/3/38/T--Tec-Monterrey--part-bradford-sial-.png/800px-T--Tec-Monterrey--part-bradford-sial-.png | https://2019.igem.org/wiki/images/thumb/3/38/T--Tec-Monterrey--part-bradford-sial-.png/800px-T--Tec-Monterrey--part-bradford-sial-.png | ||
</div> | </div> | ||
| − | Figure | + | Figure 1. Bradfford calibration curve |
<div class = "left"> | <div class = "left"> | ||
https://2019.igem.org/wiki/images/thumb/7/75/T--Tec-Monterrey--part-bradford-sial2-.png/800px-T--Tec-Monterrey--part-bradford-sial2-.png | https://2019.igem.org/wiki/images/thumb/7/75/T--Tec-Monterrey--part-bradford-sial2-.png/800px-T--Tec-Monterrey--part-bradford-sial2-.png | ||
</div> | </div> | ||
| − | Figure | + | Figure 2. Bradford assay for the proteins |
| Line 31: | Line 27: | ||
https://2019.igem.org/wiki/images/thumb/3/30/T--Tec-Monterrey--demostrate-grafica.png/800px-T--Tec-Monterrey--demostrate-grafica.png | https://2019.igem.org/wiki/images/thumb/3/30/T--Tec-Monterrey--demostrate-grafica.png/800px-T--Tec-Monterrey--demostrate-grafica.png | ||
</div> | </div> | ||
| − | Figure | + | Figure 3. sfGFP grpah, fluorescence vs time induced at different concentrations. |
<div class = "left"> | <div class = "left"> | ||
https://2019.igem.org/wiki/images/thumb/3/32/T--Tec-Monterrey--part-sfGFP-sial-.png/800px-T--Tec-Monterrey--part-sfGFP-sial-.png | https://2019.igem.org/wiki/images/thumb/3/32/T--Tec-Monterrey--part-sfGFP-sial-.png/800px-T--Tec-Monterrey--part-sfGFP-sial-.png | ||
</div> | </div> | ||
| − | Figure | + | Figure 4. sial+sfGFP grpah, fluorescence vs time induced at different concentrations. |
Latest revision as of 02:17, 22 October 2019
T7-LacO Promoter + strong RBS + sialidase + sfGFP + 6x his-tag + double terminator
This device uses Bba_K2406020, Bba_J34801 and Bba_0010 to regulate the expression of a super folding GFP (Bba_I746916). The main objective of creating this device is to facilitate the secretion and characterization of any protein intracellularly produced after adding its nucleotide sequence next to the sfGFP.
Characterization
The characterization of this part included a Bradford assay to quantify the amount of protein present in the medium for each of the proposed constructs. The conditions for the assay are listed below.
The other characterization assay was a fluorescence measurement, where bacteria were growth at 30ºC for 3 hrs. Then 100µl of the grown bacteria were induced with IPTG at 0, 40, 200 and 400 mMm microtiter florescent measures were taken every half an hour for a period of 3 hours. Absorption and emission values were 395/509 nm.

Figure 1. Bradfford calibration curve

Figure 2. Bradford assay for the proteins
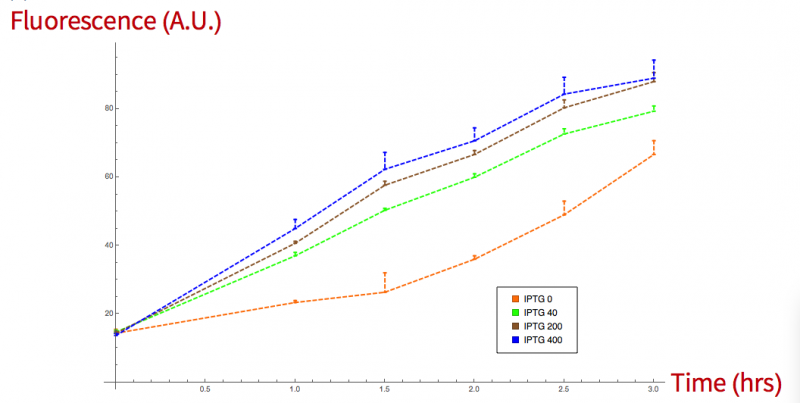
Figure 3. sfGFP grpah, fluorescence vs time induced at different concentrations.

Figure 4. sial+sfGFP grpah, fluorescence vs time induced at different concentrations.
Sequence and Features
- 10COMPATIBLE WITH RFC[10]
- 12COMPATIBLE WITH RFC[12]
- 21INCOMPATIBLE WITH RFC[21]Illegal BamHI site found at 721
- 23COMPATIBLE WITH RFC[23]
- 25INCOMPATIBLE WITH RFC[25]Illegal AgeI site found at 1986
- 1000INCOMPATIBLE WITH RFC[1000]Illegal BsaI site found at 646
Illegal BsaI.rc site found at 510
Illegal BsaI.rc site found at 1647
Illegal SapI.rc site found at 2055