
Difference between revisions of "Part:BBa K861173"
| Line 84: | Line 84: | ||
</p> | </p> | ||
| − | + | https://2019.igem.org/wiki/images/c/cc/T--IISER_Kolkata--glu_rep_1.png | |
OD at 600 nm for E coli transformed with BBa_I13522 grown in range of concentrations (10 mM, 20mM, 30mM and 40mM) of glucose and its analogues | OD at 600 nm for E coli transformed with BBa_I13522 grown in range of concentrations (10 mM, 20mM, 30mM and 40mM) of glucose and its analogues | ||
Revision as of 11:12, 20 October 2019
mRFP generator controlled by PcstA (glucose-repressible promoter)
RFP is controlled by promoter PcstA, which can be activated by CRP-cAMP complex. Therefore RFP will be expressed at low glucose concentration.
Sequence and Features
- 10COMPATIBLE WITH RFC[10]
- 12COMPATIBLE WITH RFC[12]
- 21COMPATIBLE WITH RFC[21]
- 23COMPATIBLE WITH RFC[23]
- 25INCOMPATIBLE WITH RFC[25]Illegal AgeI site found at 712
Illegal AgeI site found at 824 - 1000COMPATIBLE WITH RFC[1000]
Contents
Vilnius-Lithuania 2019 iGEM team contribution
Vilnius-Lithuania 2019 iGEM team measured measured growth kinetics with varying glucose (5%, 2%, 1% 0.4%, 0.1%, 0.01%, 0.001%) and glycerol (0.4%) concentrations. The measurements were done in a microplate reader, points were taken every 30 minutes for 14 hours and were able then to plot mRFP fluorescence divided by OD 600 against time. In the case of this part characterization, knowing the change in output by varying the glucose concentration allows the part to be used in controlling the protein of interest level in the cell. Full protocol and description can be found here.

IISER Kolkata 2019
The Characterization of BBa_K381001
BBa_K861173 has a mRFP controlled by PcstA which is a Glucose repressible promoter. It has been shown by previous teams that with the increased concentration of glucose there is a decrease in the activity of PcstA. Team iGEM IISER Kolkata is trying to characterize what is the effect of increasing concentration of other glucose analogues on the same system.
Aim
BBa_K861173 was used to characterize the promoter activity of PcstA in a range of concentration of glucose and its analogues in the growth media.
Method
E. coli DH5α were transformed using re-suspended BBa_K861173 pSB1C3 plasmids from iGEM 2019 distribution kit and selected using Chloramphenicol LB agar plates.
- Single positive colony of BBa_I13522 was added to 10ml of LB media and left overnight at 37° C on 150 rpm in an incubator. Along with this, a positive control with non-transformed E coli cells was also kept in liquid culture in the similar conditions.
- 200 µL of overnight culture was added to 10ml of M9 minimal media with different concentrations of sugars in individual test tubes. One control was kept in LB media.
- It was kept in incubated for 8 hours at 37°C at 150 rpm.
- At the end of 8 hours of incubation in the incubator, 100uL of the culture was added to each well of 96 well plate. The culture in LB was pelleted down and resuspended in equivalent amount of M9 media.
- Varioskan LUX multimode reader was used to measure the GFP fluorescence: Excitation at 494 nm and emission at 525 nm.
- Additionally, Shimazadu UV1900 was used to measure the OD at 600 nm to quantify the bacterial growth.
Result
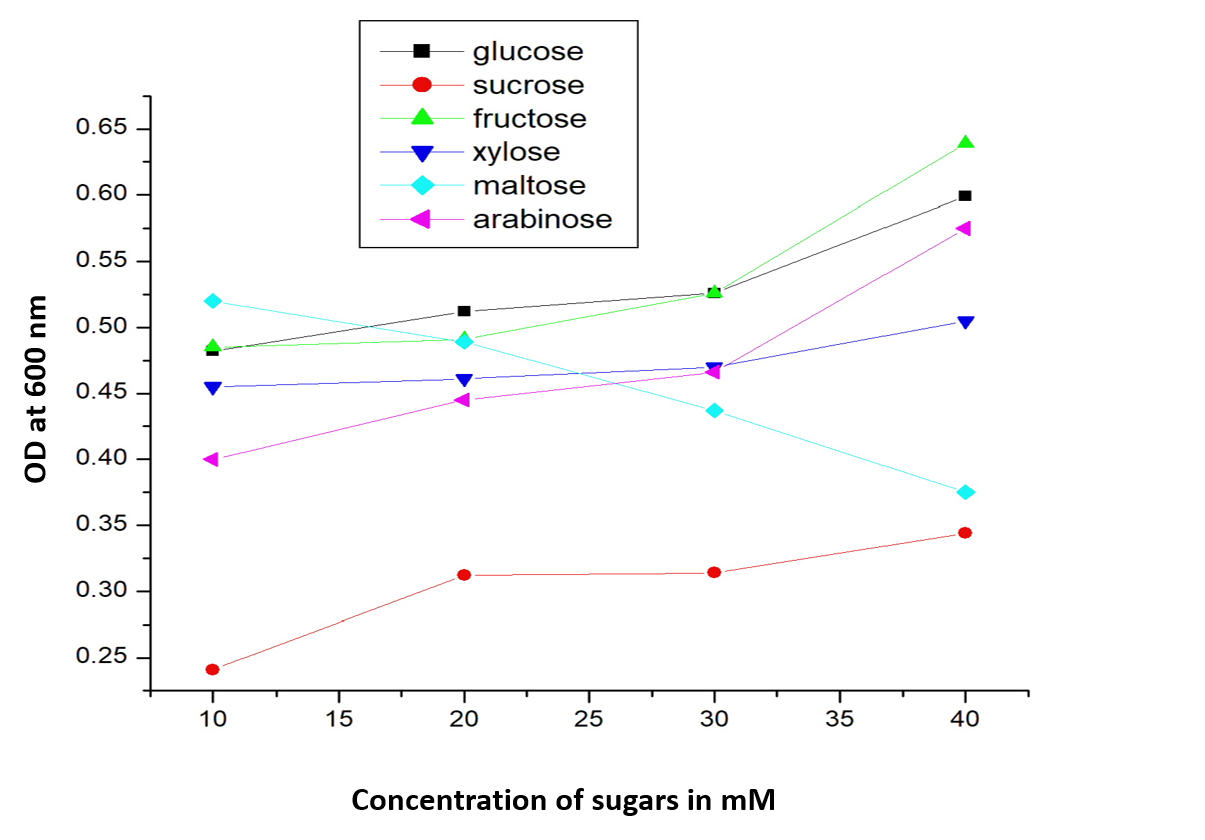 OD at 600 nm for E coli transformed with BBa_I13522 grown in range of concentrations (10 mM, 20mM, 30mM and 40mM) of glucose and its analogues

Decrease in mRFP fluorescence with increase in concentration of glucose, fructose and xylose. The data for rest three sugars viz. sucrose, maltose and arabinose has not been shown as they show no clear co-relation of mRFP production and sugar concentration
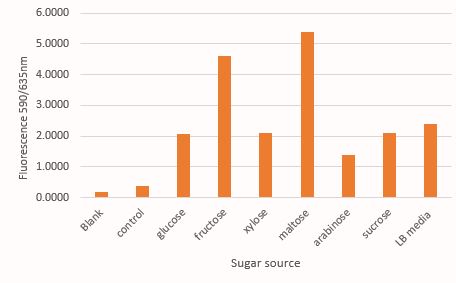
Comparison of mRFP fluorescence in M9 media supplemented with different sugar source at 30mM concentration. Here the control contains untransformed DH5α grown in LB media under a similar condition like that of test samples
Conclusion
As expected, there is a linear increase in the OD600 of the bacterial culture with the increase in the concentration of sugar (except maltose) as seen in figure 1. Moreover, we could also show a clear co-relation that with the increase in concentration of glucose, fructose and xylose there is a decrease in mRFP fluorescence. This signifies the fact that the PcstA promoter activity decreases with the increase in concentration of glucose, fructose and xylose.