Difference between revisions of "Part:BBa K1033926"
Nathalievw (Talk | contribs) |
Nathalievw (Talk | contribs) |
||
| Line 5: | Line 5: | ||
===Characterisation=== | ===Characterisation=== | ||
| − | The iGEM team of Rotterdam 2019 characterized this part more, as part of the bronze medal criteria. Two characterization experiments have been performed. First, full-spectrum analysis has been performed which not only tells us what the maximum absorbance is at which wavelength, but also what the absorbance is at all the other wavelengths. In figure 2 and 3 we can see the graph in which the absorbance maximum matches the 572 nm, but we can now also see what the absorbance is at the other wavelengths. The proteins have been lysed in | + | The iGEM team of Rotterdam 2019 characterized this part more, as part of the bronze medal criteria. Two characterization experiments have been performed. First, full-spectrum analysis has been performed which not only tells us what the maximum absorbance is at which wavelength, but also what the absorbance is at all the other wavelengths. In figure 2 and 3 we can see the graph in which the absorbance maximum matches the 572 nm, but we can now also see what the absorbance is at the other wavelengths. The proteins have been lysed in saline, so the blank also is saline(figure 1). |
| − | The second characterization experiment was performed by tweaking the environment in which the protein exists. The team wanted to see if there would be any changes in absorbance when the proteins are in an acidic (pH0.3) or basic environment (pH 13.3). More pH-points have been tested, and there clearly is a shift in absorbance as seen in the chart when the pH goes up or down from its natural pH point: pH7.3. The proteins have been lysed in | + | The second characterization experiment was performed by tweaking the environment in which the protein exists. The team wanted to see if there would be any changes in absorbance when the proteins are in an acidic (pH0.3) or basic environment (pH 13.3). More pH-points have been tested, and there clearly is a shift in absorbance as seen in the chart when the pH goes up or down from its natural pH point: pH7.3. The proteins have been lysed in saline, so the blank also is saline. The tests have been performed twice in different wells of a 96-wells plate (figure 4 and 5). |
https://2019.igem.org/wiki/images/thumb/1/18/T--Rotterdam_HR--result10.jpg/800px-T--Rotterdam_HR--result10.jpg | https://2019.igem.org/wiki/images/thumb/1/18/T--Rotterdam_HR--result10.jpg/800px-T--Rotterdam_HR--result10.jpg | ||
| − | Figure 1: Negative control with | + | Figure 1: Negative control with saline. |
https://2019.igem.org/wiki/images/thumb/9/9c/T--Rotterdam_HR--result11.jpg/800px-T--Rotterdam_HR--result11.jpg | https://2019.igem.org/wiki/images/thumb/9/9c/T--Rotterdam_HR--result11.jpg/800px-T--Rotterdam_HR--result11.jpg | ||
| − | Figure 2: | + | Figure 2: Pink chromoprotein full spectrum analysis. |
https://2019.igem.org/wiki/images/thumb/5/52/T--Rotterdam_HR--result12.jpg/800px-T--Rotterdam_HR--result12.jpg | https://2019.igem.org/wiki/images/thumb/5/52/T--Rotterdam_HR--result12.jpg/800px-T--Rotterdam_HR--result12.jpg | ||
| − | Figure 3: | + | Figure 3: Duplicate of the pink chromoprotein full spectrum analysis. |
https://2019.igem.org/wiki/images/4/45/T--Rotterdam_HR--result15.jpg | https://2019.igem.org/wiki/images/4/45/T--Rotterdam_HR--result15.jpg | ||
| − | Figure 4: | + | Figure 4: Full spectrum pH-analysis. |
https://2019.igem.org/wiki/images/7/7e/T--Rotterdam_HR--result16.jpg | https://2019.igem.org/wiki/images/7/7e/T--Rotterdam_HR--result16.jpg | ||
| + | |||
| + | Figure 5: Duplicate of the full spectrum pH-analysis. | ||
| + | |||
===Usage and Biology=== | ===Usage and Biology=== | ||
This part is useful as a reporter. | This part is useful as a reporter. | ||
| Line 32: | Line 35: | ||
| − | + | ||
[[Image:AsPink.jpg|700px]] | [[Image:AsPink.jpg|700px]] | ||
Revision as of 18:24, 16 October 2019
asPink, pink chromoprotein (incl RBS, J23110)
This chromoprotein from the coral Anemonia sulcata, asPink (also known as asCP or asFP595), naturally exhibits strong color when expressed. The protein has an absorption maximum at 572 nm giving it a pink/purple color visible to the naked eye. The strong color is readily observed in both LB or on agar plates after less than 24 hours of incubation. The protein asPink has significant sequence homologies with proteins in the GFP family.
Characterisation
The iGEM team of Rotterdam 2019 characterized this part more, as part of the bronze medal criteria. Two characterization experiments have been performed. First, full-spectrum analysis has been performed which not only tells us what the maximum absorbance is at which wavelength, but also what the absorbance is at all the other wavelengths. In figure 2 and 3 we can see the graph in which the absorbance maximum matches the 572 nm, but we can now also see what the absorbance is at the other wavelengths. The proteins have been lysed in saline, so the blank also is saline(figure 1).
The second characterization experiment was performed by tweaking the environment in which the protein exists. The team wanted to see if there would be any changes in absorbance when the proteins are in an acidic (pH0.3) or basic environment (pH 13.3). More pH-points have been tested, and there clearly is a shift in absorbance as seen in the chart when the pH goes up or down from its natural pH point: pH7.3. The proteins have been lysed in saline, so the blank also is saline. The tests have been performed twice in different wells of a 96-wells plate (figure 4 and 5).
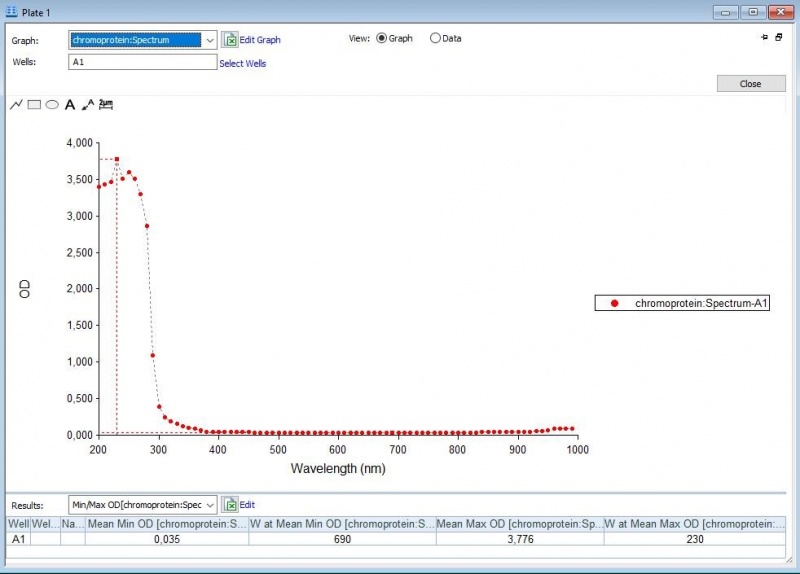
Figure 1: Negative control with saline.
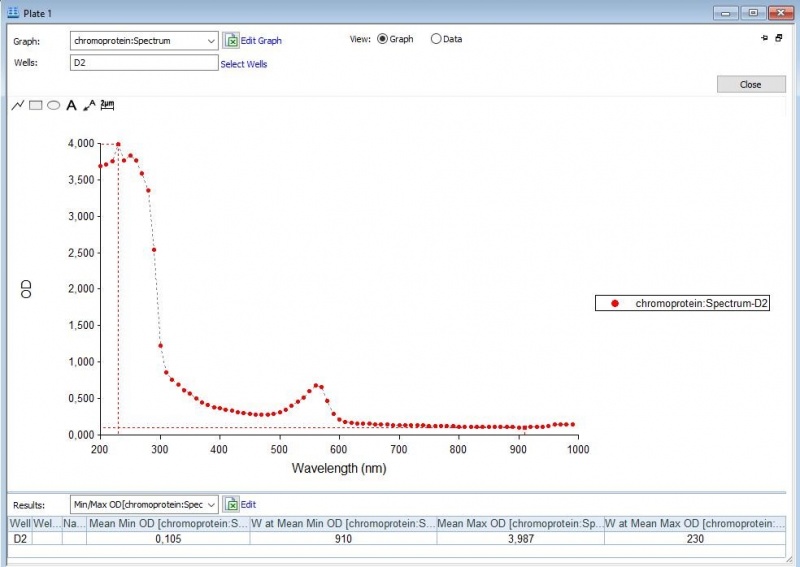
Figure 2: Pink chromoprotein full spectrum analysis.
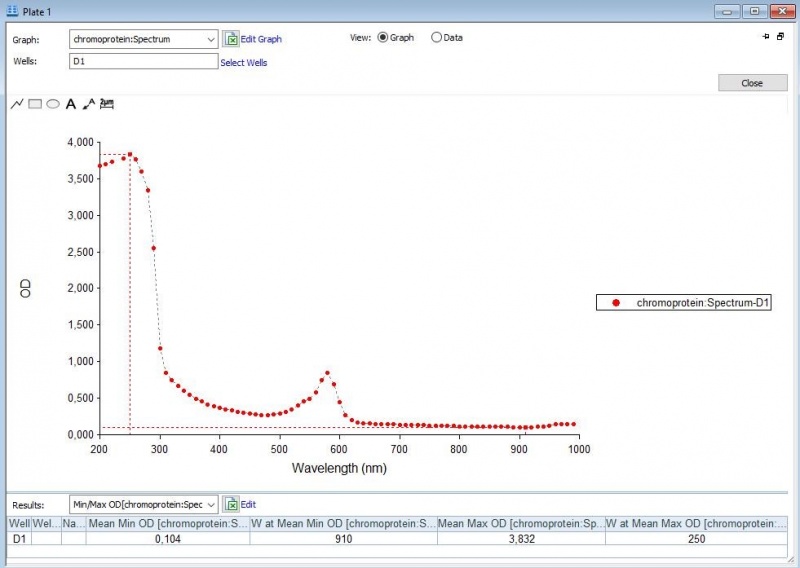
Figure 3: Duplicate of the pink chromoprotein full spectrum analysis.
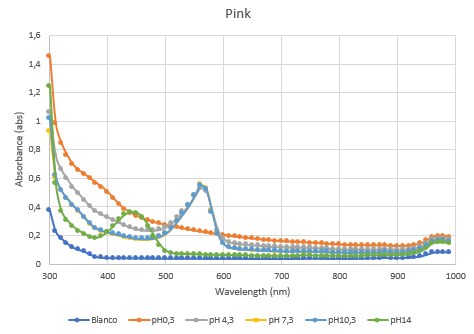
Figure 4: Full spectrum pH-analysis.
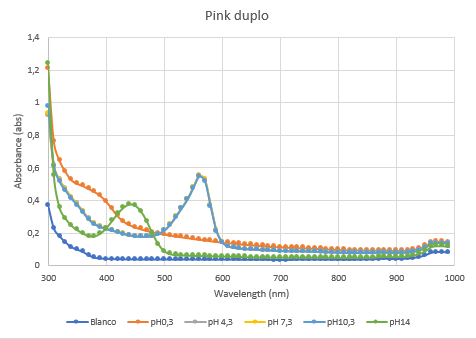
Figure 5: Duplicate of the full spectrum pH-analysis.
Usage and Biology
This part is useful as a reporter.
iGEM2013 Uppsala: Expression of asPink in E. coli DH5alpha by promoter J23110 from medium copy plasmid pSB3K3 (left) or high copy plasmid pSB1K3 (right).
Source
The protein was first extracted and characterized by Lukyanov et. al. 2000 under the name asFP595 (GenBank: AAG02385.1). This version is codon optimized for E coli by Genscript.
References
[http://www.jbc.org/content/275/34/25879.short]Lukyanov, Konstantin A., et al. "Natural animal coloration can be determined by a nonfluorescent green fluorescent protein homolog." Journal of Biological Chemistry 275.34 (2000): 25879-25882.
[http://www.jbc.org/content/280/4/2401.short]Wilmann, Pascal G., et al. "Variations on the GFP Chromophore - A Polypeptide Fragmentation Within The Chromophore Revealed In The 2.1-Å Crystal Structure Of A Nonfluorescent Chromoprotein From Anemonia Sulcata." Journal of Biological Chemistry 280.4 (2005): 2401-2404.
Sequence and Features
- 10COMPATIBLE WITH RFC[10]
- 12INCOMPATIBLE WITH RFC[12]Illegal NheI site found at 7
Illegal NheI site found at 30 - 21COMPATIBLE WITH RFC[21]
- 23COMPATIBLE WITH RFC[23]
- 25COMPATIBLE WITH RFC[25]
- 1000COMPATIBLE WITH RFC[1000]
