Difference between revisions of "Part:BBa K2601004"
LebronJames (Talk | contribs) |
LebronJames (Talk | contribs) |
||
| Line 49: | Line 49: | ||
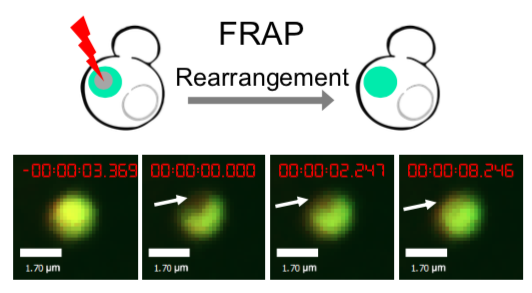
<table border="0" align="center"><tr><td>[[file:T--Peking--SUMO-SIM-FRAP.gif]]</td> <td>[[file:T--Peking--SUMO-SIM-FRAP-graph.png]]</td> </tr><tr><td colspan="2"><b>Figure 10. </b> The quantitation of FRAP was determined. The intensity of the fluorescence recovered to <br/>approximately 60 percent of the original state.</td></tr></table> | <table border="0" align="center"><tr><td>[[file:T--Peking--SUMO-SIM-FRAP.gif]]</td> <td>[[file:T--Peking--SUMO-SIM-FRAP-graph.png]]</td> </tr><tr><td colspan="2"><b>Figure 10. </b> The quantitation of FRAP was determined. The intensity of the fluorescence recovered to <br/>approximately 60 percent of the original state.</td></tr></table> | ||
| + | |||
<h2>FKBP-HOTag3 / Frb-HOTag6</h2> | <h2>FKBP-HOTag3 / Frb-HOTag6</h2> | ||
Our results confirmed that FKBP/Frb module fused with HOTags can drive phase separation in yeast. | Our results confirmed that FKBP/Frb module fused with HOTags can drive phase separation in yeast. | ||
| − | [[file:T--Peking--FKBP-Frb-image.png|500px|thumb|center|<b>Figure | + | [[file:T--Peking--FKBP-Frb-image.png|500px|thumb|center|<b>Figure 11. </b>The diagram of FKBP/Frb fusing with HOTags and fluorescent reporters.]] |
| − | [[file:T--Peking--FKBP-Frb-image2.png|500px|thumb|center|<b>Figure | + | [[file:T--Peking--FKBP-Frb-image2.png|500px|thumb|center|<b>Figure 12. </b>Colocalization of red and green puncta could be captured under fluorescence microscope.]] |
We set up a thermodynamic model characterizing our system. Phase separation is easy to take place in the green area, where the system is unstable, while it can also happen in the blue area, where the system is metastable. Phi 1, phi 2 and phi 3 represent the volume fraction of FKBP, Frb and water, respectively. The parameter chi represents the interaction energy. Chi one three can be roughly interpreted by the interaction strength between FKBP and water, while chi two three indicates the interaction strength between Frb and water. Similarly, chi one two denotes the interaction between FKBP and Frb. Whether chi one three is equal to chi two three decides whether the diagram is symmetric. This is a useful instruction for our experiments. To some extends it can save us from some unnecessary trials. In our experiment, we chose promoters with different strength to adjust volume fraction of FKBP and Frb. Phase separation could be observed only when FKBP-HoTag3 had a low level expression while Frb-HoTag6 had a high level expression. The experimental results was consistent with the model. | We set up a thermodynamic model characterizing our system. Phase separation is easy to take place in the green area, where the system is unstable, while it can also happen in the blue area, where the system is metastable. Phi 1, phi 2 and phi 3 represent the volume fraction of FKBP, Frb and water, respectively. The parameter chi represents the interaction energy. Chi one three can be roughly interpreted by the interaction strength between FKBP and water, while chi two three indicates the interaction strength between Frb and water. Similarly, chi one two denotes the interaction between FKBP and Frb. Whether chi one three is equal to chi two three decides whether the diagram is symmetric. This is a useful instruction for our experiments. To some extends it can save us from some unnecessary trials. In our experiment, we chose promoters with different strength to adjust volume fraction of FKBP and Frb. Phase separation could be observed only when FKBP-HoTag3 had a low level expression while Frb-HoTag6 had a high level expression. The experimental results was consistent with the model. | ||
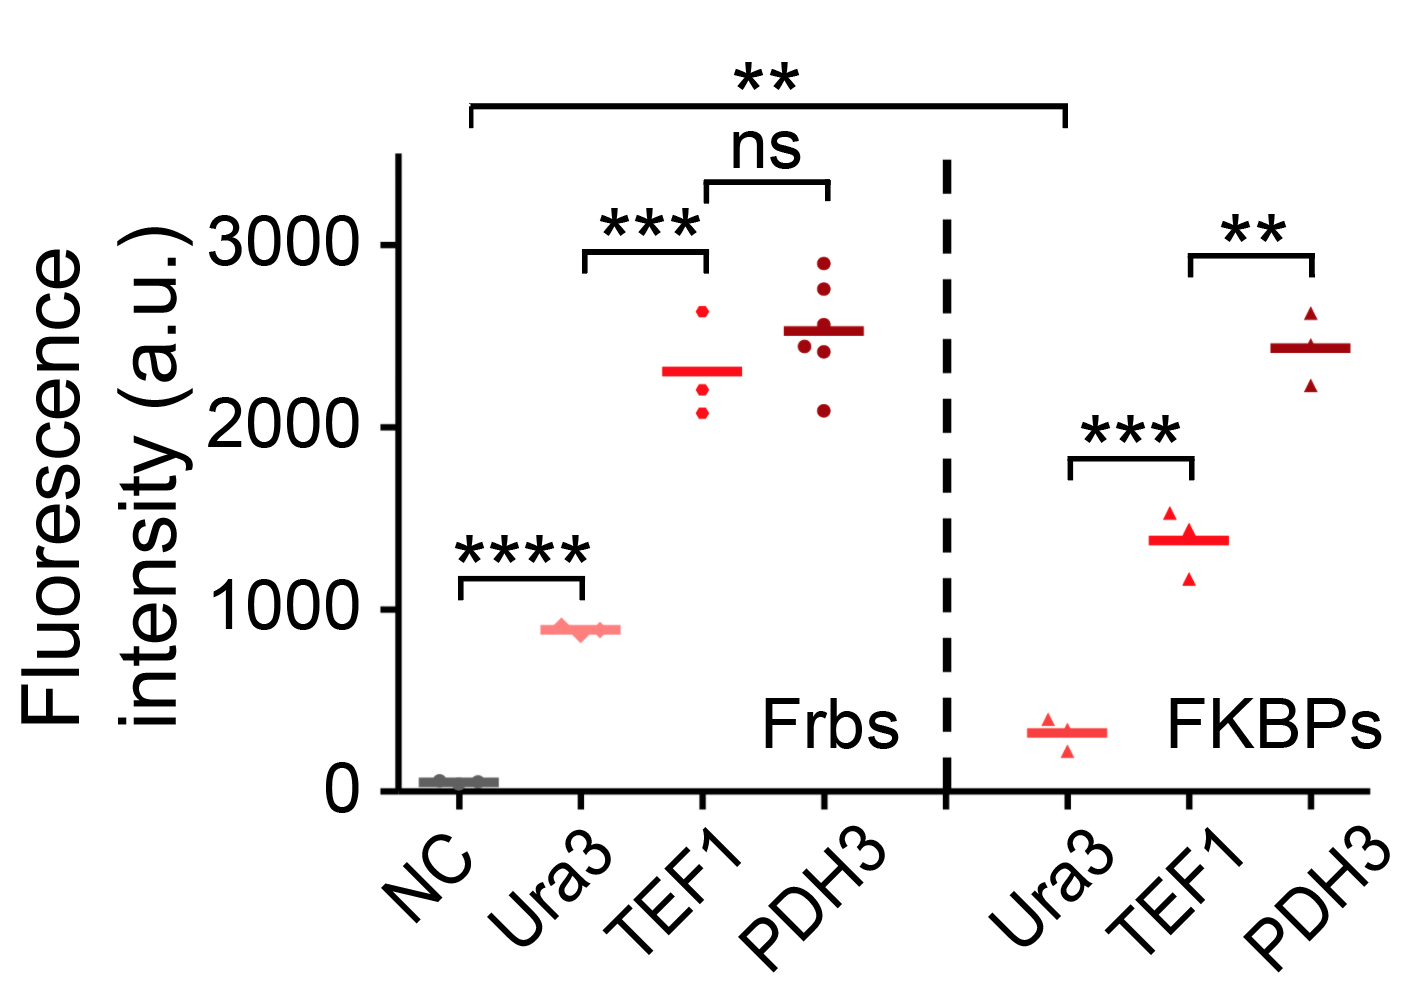
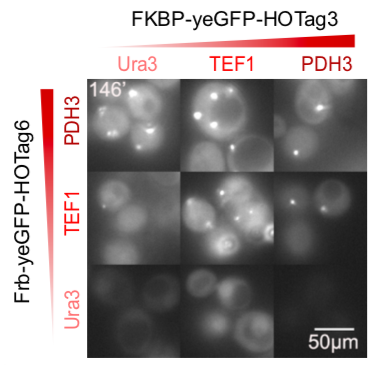
| − | <table border="0" align="center"><tr><td>[[file:T--Peking--promoter-strength-new.png|300px|thumb|center|<b>Figure | + | <table border="0" align="center"><tr><td>[[file:T--Peking--promoter-strength-new.png|300px|thumb|center|<b>Figure 13. </b>The strength of three different yeast promoters tested by flow cytometry.]]</td> <td>[[file:T--Peking--FKBP-Frb-promoter.png|300px|thumb|center|<b>Figure 14. </b>A screenshot taken from the GIFs. FKBP-HOTag3 and Frb-HOTag6 were under the control of promoters with different strength.]]</td> <td>[[file:T--Peking--thermo-model.png|280px|thumb|center|<b>Figure 15. </b>The thermodynamic model of our system. Phi represents the volume fraction of different components while chi represents the interaction energy between different components.]]</td></tr></table> |
Here are the kinetic simulation results. The larger chi is, the sooner the system relaxes into equilibrium state, which means the faster the phase separation appears. In our experiment, we changed the interaction energy between FKBP and Frb by changing the concentration of rapamycin. Higher concentration of rapamycin led to faster SPOT formation, which was also consistent with the model. | Here are the kinetic simulation results. The larger chi is, the sooner the system relaxes into equilibrium state, which means the faster the phase separation appears. In our experiment, we changed the interaction energy between FKBP and Frb by changing the concentration of rapamycin. Higher concentration of rapamycin led to faster SPOT formation, which was also consistent with the model. | ||
| − | <table border="0" align="center"> <tr><td colspan="4">[[file:T--Peking--rapamycin-gradient.png|500px|right]]</td></tr><tr><td>[[file:T--Peking--rap0.gif|200px]]</td> <td>[[file:T--Peking--rap100.gif|200px]]</td> <td>[[file:T--Peking--rap1000.gif|200px]]</td> <td>[[file:T--Peking--rap1000.gif|200px]]</td></tr><tr><td colspan="4"><b>Figure | + | <table border="0" align="center"> <tr><td colspan="4">[[file:T--Peking--rapamycin-gradient.png|500px|right]]</td></tr><tr><td>[[file:T--Peking--rap0.gif|200px]]</td> <td>[[file:T--Peking--rap100.gif|200px]]</td> <td>[[file:T--Peking--rap1000.gif|200px]]</td> <td>[[file:T--Peking--rap1000.gif|200px]]</td></tr><tr><td colspan="4"><b>Figure 16. </b>Yeasts with FKBP-HOTag3 and Frb-HOTag6 were induced by different concentrations of rapamycin.</td></tr> </table> |
| − | [[file:T--Peking--kinetics-video.gif|800px|thumb|center|<b>Figure | + | [[file:T--Peking--kinetics-video.gif|800px|thumb|center|<b>Figure 17. </b>The kinetic model of our system.]] |
FKBP-Frb based phase separation system could alleviate the inhibitory effect of rapamycin. It could sequester rapamycin in the granule and rescue the yeast from the toxicity of the rapamycin. From the yeast growth curve we could see that there was a significant difference between cells with and without phase separation. | FKBP-Frb based phase separation system could alleviate the inhibitory effect of rapamycin. It could sequester rapamycin in the granule and rescue the yeast from the toxicity of the rapamycin. From the yeast growth curve we could see that there was a significant difference between cells with and without phase separation. | ||
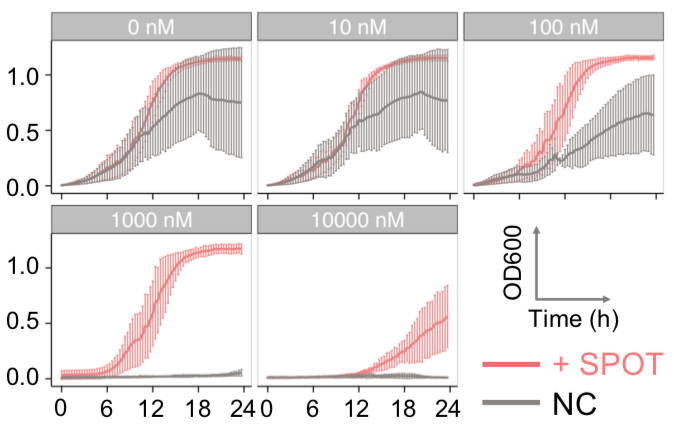
| − | [[file:T--Peking--growth-curve.png|500px|thumb|center|<b>Figure | + | [[file:T--Peking--growth-curve.png|500px|thumb|center|<b>Figure 18. </b>The growth curve of yeasts with and without SPOT. The groups with SPOT show stronger resistance to rapamycin.]] |
| − | + | ||
| + | Looking at the system from another perspective, we concluded that rapamycin could be detected by SPOT. Therefore, we considered whether SPOT could act as a sensor. We changed the interaction module into bipartite binding domains of Abscisic acid (ABA). ABA is an important phytohormone that regulates plant stress responses. Proteins from the PYR-PYL-PCAR family were identified as ABA receptors. Upon binding to ABA, a PYL protein associates with type 2C protein phosphatases (PP2Cs) such as ABI1 and ABI2, inhibiting their activity. We used PYL1/ABI1 as the interaction module. We could observe SPOT formation in cells after adding ABA. | ||
| + | [[file:T--Peking--ABA-demo.png|500px|thumb|center|<b>Figure 19. </b>Design of a ABA sensor. ABA is a kind of plant hormone. By specific interaction module, SPOT can sense the presence of ABA. | ||
| − | [[file:T--Peking--ABA.png|500px|thumb|center|<b>Figure</b>]] | + | [[file:T--Peking--ABA.png|500px|thumb|center|<b>Figure 20. </b>The function test of ABA sensor. In the presence of ABA, granules can be observed in both fluorescence channels.]] |
<!-- --> | <!-- --> | ||
Revision as of 12:05, 17 October 2018
HOTag3 (Homo-Oligomeric Tag3)
Introduction
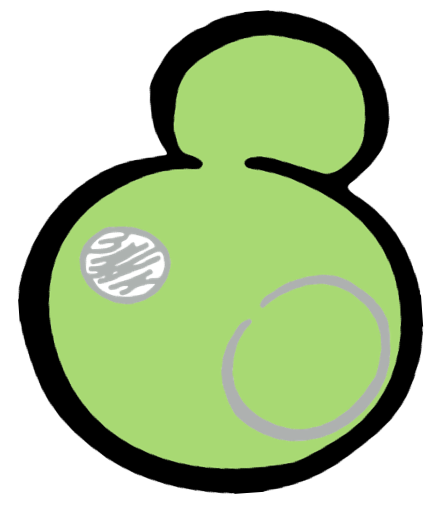
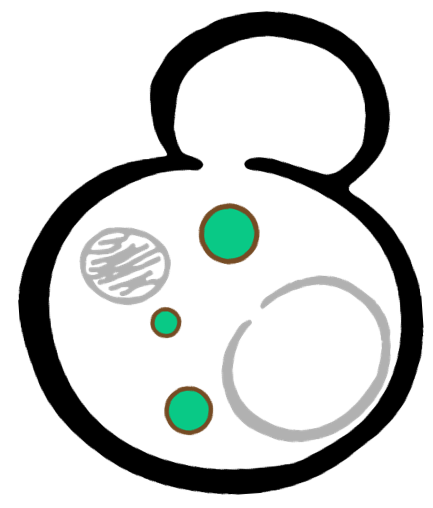
Some membrane-less organelles, such as stress granules and P bodies, have been discovered in recent years. Proteins condense into droplets and assemble these organelles through a process called phase separation. Physically, phase separation is the transformation of a one-phase thermodynamic system to a multi phase system, much like how oil and water demix from each other. According to thermodynamics, molecules will diffuse down the gradient of chemical potential instead of concentration. This is exactly why proteins will self organize into granules, diffusing from regions of low concentration to regions of high concentration. Here is an illustration of phase separation in cells.
 |  |  |
Design
When we wanted to rationally design a synthetic organelle based on phase separation and used it as a platform to achieve multi-functions, some design principles had to be followed. Interaction can bind the parts together while multivalence can make larger assemblies. In order to drive protein phase separation, we needed a multivalent module and a protein-protein interaction module. HOTag is the biobrick that we used to introduce multivalence. In natural process, such as phase separation occurred during T cell signal transduction, multivalency depends on multiple repeats protein domains. But it was not ideal to use multiple repeat domains in our design, because it would not only make the scaffold extremely large but also be problematic for molecular cloning and making transgenic yeasts. Thus, instead of using multiple repeats, we turned to de novo-designed homo-oligomeric short peptides. These short peptides are called HO-Tag (homo-oligomeric tag). HOTags contain approximately 30 amino acids. HOTag3 has high stoichiometry, forming hexamer spontaneously.
As for the protein-protein interaction part, we chose two sets of dimerization modules. The first pair was SUMO and SIM, which can dimerize spontaneously. The second one was chemically inducible FKBP and Frb. Rapamycin was the inducer of dimerization. We chose different modules according to the different functions we wanted to achieve. The hexameric HOTag3, together with another tetrameric HOTag (HOTag6), could robustly drive protein phase separation upon protein interaction (achieved by the protein-protein interaction module). Thus, HOTag3/6 pair is a useful tool to investigate protein phase separation and design a synthetic organelle. To verify the feasibility of the system, we fused two fluorescence proteins with the two components of synthetic organelles. We could observe the self-organization of components and the formation of organelles under fluorescence microscope. We named our system SPOT (Synthetic Phase separation-based Organelle Platform) because it could form granules (fluorescent spots) in yeast. Here is a demonstration of our overall design.
Properties
SUMO-HOTag3 / SIM-HOTag6
Our results confirmed that SUMO/SIM module fused with HOTags can drive phase separation in yeast.
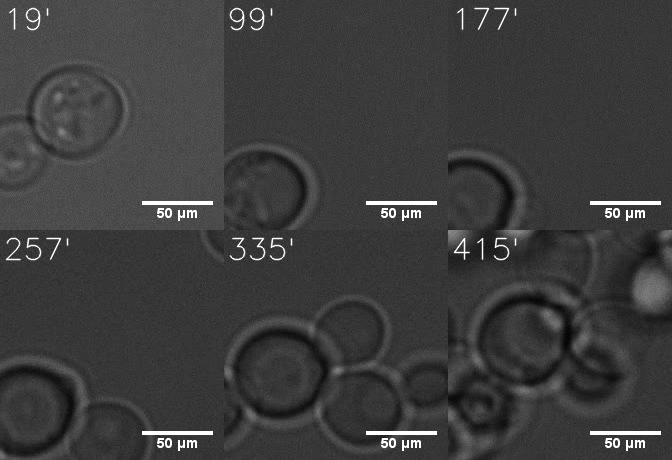
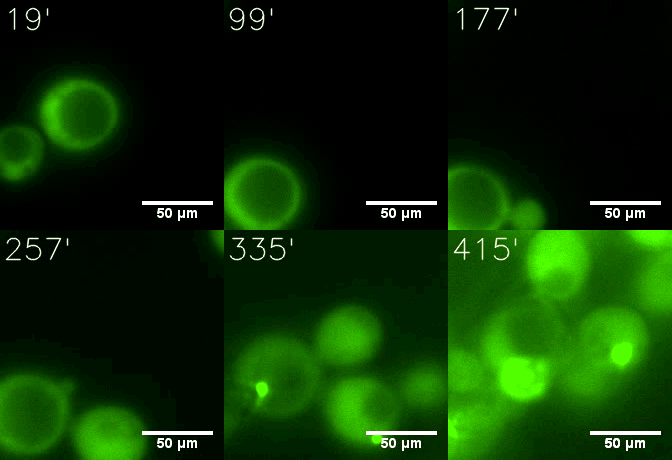
Furthermore, we used Tet07, an inducible promoter, to control the expression of the SIM component. Doxycycline is the inducer of the promoter. SIM fused with HOTag6 couldn’t express in the absence of doxycycline. Before we added doxycycline, SUMO-HOtag3 was evenly distributed in the cells and can’t phase separate. But after we added it, phase separation gradually appears. Therefore, we confirmed that the dimerization modules was essential for phase separation and HOTags alone couldn’t induce the process.
 |  |
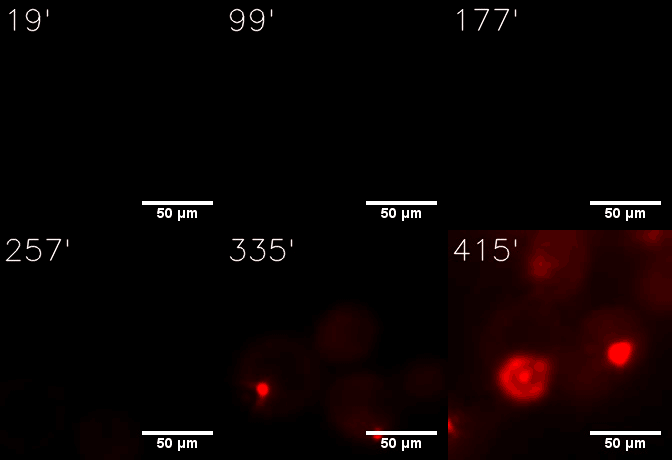 | 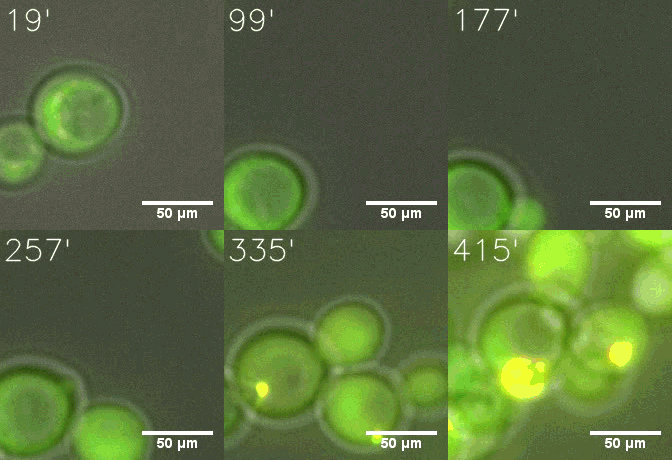 |
| Figure 6. GIF images of different channels. | |
As for the biophysical properties of the system, we assumed the granules were liquid-like. A liquid-like granule is a dynamic system, exchanging mass with cytoplasm rapidly. There are three characteristics which define a liquid-like compartment. First, the compartments should be roughly spherical due to surface tension. It was proved by the 3D-rendered shape of the granules, taken by confocal microscope. Second, two droplets should fuse and coalesce into one droplet spontaneously. Third, the components should undergo rapid internal rearrangement. We used FRAP to verify this criteria. After photobleaching, the fluorescence of granules quickly recovered, which indicated that the granules had rapid mass exchange with cytoplasm.
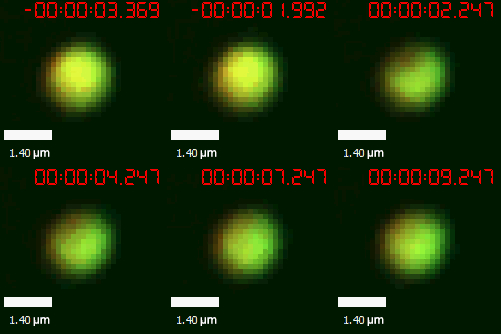 | 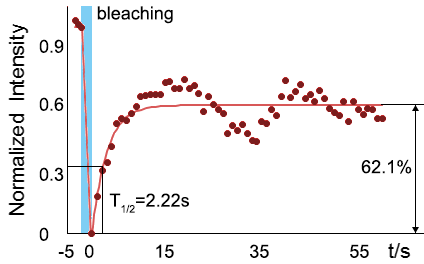 |
| Figure 10. The quantitation of FRAP was determined. The intensity of the fluorescence recovered to approximately 60 percent of the original state. | |
FKBP-HOTag3 / Frb-HOTag6
Our results confirmed that FKBP/Frb module fused with HOTags can drive phase separation in yeast.
We set up a thermodynamic model characterizing our system. Phase separation is easy to take place in the green area, where the system is unstable, while it can also happen in the blue area, where the system is metastable. Phi 1, phi 2 and phi 3 represent the volume fraction of FKBP, Frb and water, respectively. The parameter chi represents the interaction energy. Chi one three can be roughly interpreted by the interaction strength between FKBP and water, while chi two three indicates the interaction strength between Frb and water. Similarly, chi one two denotes the interaction between FKBP and Frb. Whether chi one three is equal to chi two three decides whether the diagram is symmetric. This is a useful instruction for our experiments. To some extends it can save us from some unnecessary trials. In our experiment, we chose promoters with different strength to adjust volume fraction of FKBP and Frb. Phase separation could be observed only when FKBP-HoTag3 had a low level expression while Frb-HoTag6 had a high level expression. The experimental results was consistent with the model.
| | |
Here are the kinetic simulation results. The larger chi is, the sooner the system relaxes into equilibrium state, which means the faster the phase separation appears. In our experiment, we changed the interaction energy between FKBP and Frb by changing the concentration of rapamycin. Higher concentration of rapamycin led to faster SPOT formation, which was also consistent with the model.
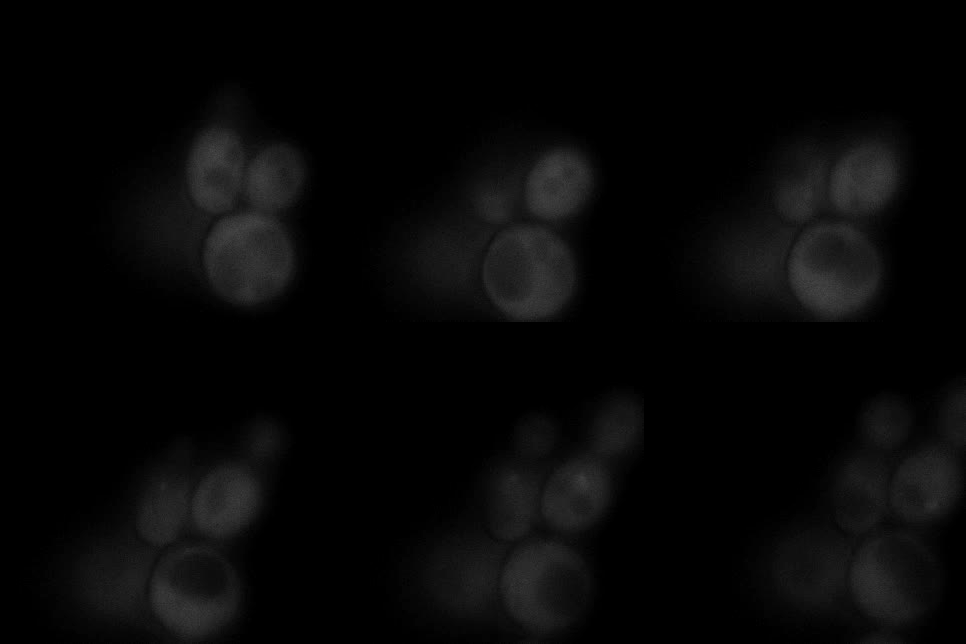 | 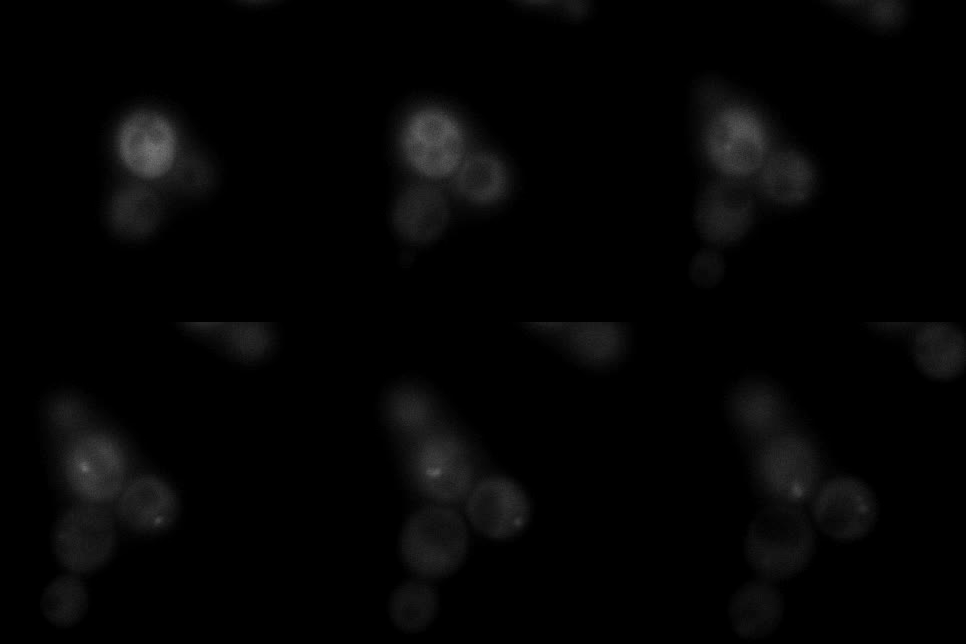 | 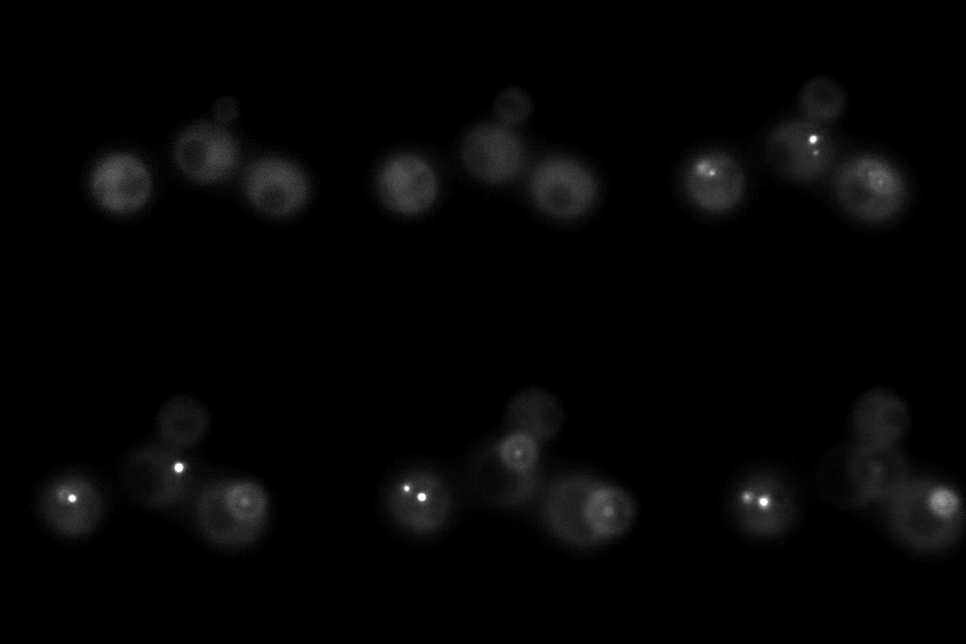 |  |
| Figure 16. Yeasts with FKBP-HOTag3 and Frb-HOTag6 were induced by different concentrations of rapamycin. | |||
FKBP-Frb based phase separation system could alleviate the inhibitory effect of rapamycin. It could sequester rapamycin in the granule and rescue the yeast from the toxicity of the rapamycin. From the yeast growth curve we could see that there was a significant difference between cells with and without phase separation.
Looking at the system from another perspective, we concluded that rapamycin could be detected by SPOT. Therefore, we considered whether SPOT could act as a sensor. We changed the interaction module into bipartite binding domains of Abscisic acid (ABA). ABA is an important phytohormone that regulates plant stress responses. Proteins from the PYR-PYL-PCAR family were identified as ABA receptors. Upon binding to ABA, a PYL protein associates with type 2C protein phosphatases (PP2Cs) such as ABI1 and ABI2, inhibiting their activity. We used PYL1/ABI1 as the interaction module. We could observe SPOT formation in cells after adding ABA.
[[file:T--Peking--ABA-demo.png|500px|thumb|center|Figure 19. Design of a ABA sensor. ABA is a kind of plant hormone. By specific interaction module, SPOT can sense the presence of ABA.
Sequence and Features
- 10COMPATIBLE WITH RFC[10]
- 12COMPATIBLE WITH RFC[12]
- 21COMPATIBLE WITH RFC[21]
- 23COMPATIBLE WITH RFC[23]
- 25COMPATIBLE WITH RFC[25]
- 1000COMPATIBLE WITH RFC[1000]


