Difference between revisions of "Part:BBa J04450:Experience"
Djcamenares (Talk | contribs) (→Team Kingsborough NY 2017) |
Djcamenares (Talk | contribs) (→Team Kingsborough NY 2017) |
||
| Line 7: | Line 7: | ||
Part of our project involved assessing the risk of escape posed by a genetically modified organism (GMO), especially one being employed in a wastewater treatment facility. Towards this end, we grew <i>E. coli</i> harboring this part (BBa_J04450) as an example GMO in different conditions, some of which mimic the salinity of seawater (typically 3-5% NaCl w/v). Surprisingly, we noticed that while the bacteria could grow on the higher salt media, the expression of RFP was decreased. This was unexpected, as the promoter in this part that drives RFP expression is not characterized as being salt responsive. We further confirmed this result by directly streaking <i>E. coli</i> with this part on different media. | Part of our project involved assessing the risk of escape posed by a genetically modified organism (GMO), especially one being employed in a wastewater treatment facility. Towards this end, we grew <i>E. coli</i> harboring this part (BBa_J04450) as an example GMO in different conditions, some of which mimic the salinity of seawater (typically 3-5% NaCl w/v). Surprisingly, we noticed that while the bacteria could grow on the higher salt media, the expression of RFP was decreased. This was unexpected, as the promoter in this part that drives RFP expression is not characterized as being salt responsive. We further confirmed this result by directly streaking <i>E. coli</i> with this part on different media. | ||
| − | [[File:T--Kingsborough_NY--J04450_fig1.png]] | + | [[File:T--Kingsborough_NY--J04450_fig1.png|800px]] |
<i>Fig 1: E. coli with BBa_J04450 streaked onto LB + Chloramphenicol plates supplemented with 1mM IPTG and/or 3% NaCl. Since LB Miller already contains 1% NaCl w/v, when preparing 500mL of LB Agar another 10g of NaCl was added to the mixture before sterilization. The bacteria was streaked using a sterile toothpick and a parent colony grown under normal conditions. The plates shown are representative of multiple experiments, and display bacteria after 1 day of growth at 37C.</i> | <i>Fig 1: E. coli with BBa_J04450 streaked onto LB + Chloramphenicol plates supplemented with 1mM IPTG and/or 3% NaCl. Since LB Miller already contains 1% NaCl w/v, when preparing 500mL of LB Agar another 10g of NaCl was added to the mixture before sterilization. The bacteria was streaked using a sterile toothpick and a parent colony grown under normal conditions. The plates shown are representative of multiple experiments, and display bacteria after 1 day of growth at 37C.</i> | ||
| − | [[File:T--Kingsborough_NY--J04450_fig2.png]] | + | [[File:T--Kingsborough_NY--J04450_fig2.png|800px]] |
<i>Fig 2: Quantified levels of RFP expression for E. coli with BBa_J04450 grown for 1 day on LB + Chloramphenicol plates supplemented with 1mM IPTG and/or 3% NaCl. Images of the plates were taken and the Grayscale, Red, Green, and Blue levels in each image were determined using ImageJ. RFP expression per cell is approximated by the amount of Red color over a set of pixels divided by the level of Green color. This difference is normalized to the maximum value obtained in all experiments. Graph shown is an average of at least 3 separate experiments, error bars represent standard deviation. Differences between LB Miller and 3% NaCl media were shown to be statistically significant using Student's T-Test (p < 0.05). | <i>Fig 2: Quantified levels of RFP expression for E. coli with BBa_J04450 grown for 1 day on LB + Chloramphenicol plates supplemented with 1mM IPTG and/or 3% NaCl. Images of the plates were taken and the Grayscale, Red, Green, and Blue levels in each image were determined using ImageJ. RFP expression per cell is approximated by the amount of Red color over a set of pixels divided by the level of Green color. This difference is normalized to the maximum value obtained in all experiments. Graph shown is an average of at least 3 separate experiments, error bars represent standard deviation. Differences between LB Miller and 3% NaCl media were shown to be statistically significant using Student's T-Test (p < 0.05). | ||
| Line 17: | Line 17: | ||
Bacteria harboring this part not only display decreased RFP expression in high salt, but also appear to grow slower. This was true for media containing 3% NaCl, but even more severe for media with 5% NaCl. However, allowing additional time for growth at high salt does not allow the bacteria to recover the levels of RFP expression seen after 1 day of growth in normal media. | Bacteria harboring this part not only display decreased RFP expression in high salt, but also appear to grow slower. This was true for media containing 3% NaCl, but even more severe for media with 5% NaCl. However, allowing additional time for growth at high salt does not allow the bacteria to recover the levels of RFP expression seen after 1 day of growth in normal media. | ||
| − | [[File:T--Kingsborough_NY--J04450_fig3.png]] | + | [[File:T--Kingsborough_NY--J04450_fig3.png|800px]] |
<i>Fig 3: Quantified levels of RFP expression for E. coli with BBa_J04450 grown for 1 day on LB + Chloramphenicol plates supplemented with 1mM IPTG and/or 3% to 5% NaCl. Plates were allowed to grow overnight at 37C for either 1 or 4 days, and photographed against a dark background. | <i>Fig 3: Quantified levels of RFP expression for E. coli with BBa_J04450 grown for 1 day on LB + Chloramphenicol plates supplemented with 1mM IPTG and/or 3% to 5% NaCl. Plates were allowed to grow overnight at 37C for either 1 or 4 days, and photographed against a dark background. | ||
Revision as of 19:02, 19 November 2017
This experience page is provided so that any user may enter their experience using this part.
Please enter
how you used this part and how it worked out.
Team Kingsborough NY 2017
Part of our project involved assessing the risk of escape posed by a genetically modified organism (GMO), especially one being employed in a wastewater treatment facility. Towards this end, we grew E. coli harboring this part (BBa_J04450) as an example GMO in different conditions, some of which mimic the salinity of seawater (typically 3-5% NaCl w/v). Surprisingly, we noticed that while the bacteria could grow on the higher salt media, the expression of RFP was decreased. This was unexpected, as the promoter in this part that drives RFP expression is not characterized as being salt responsive. We further confirmed this result by directly streaking E. coli with this part on different media.
Fig 1: E. coli with BBa_J04450 streaked onto LB + Chloramphenicol plates supplemented with 1mM IPTG and/or 3% NaCl. Since LB Miller already contains 1% NaCl w/v, when preparing 500mL of LB Agar another 10g of NaCl was added to the mixture before sterilization. The bacteria was streaked using a sterile toothpick and a parent colony grown under normal conditions. The plates shown are representative of multiple experiments, and display bacteria after 1 day of growth at 37C.
Fig 2: Quantified levels of RFP expression for E. coli with BBa_J04450 grown for 1 day on LB + Chloramphenicol plates supplemented with 1mM IPTG and/or 3% NaCl. Images of the plates were taken and the Grayscale, Red, Green, and Blue levels in each image were determined using ImageJ. RFP expression per cell is approximated by the amount of Red color over a set of pixels divided by the level of Green color. This difference is normalized to the maximum value obtained in all experiments. Graph shown is an average of at least 3 separate experiments, error bars represent standard deviation. Differences between LB Miller and 3% NaCl media were shown to be statistically significant using Student's T-Test (p < 0.05).
Bacteria harboring this part not only display decreased RFP expression in high salt, but also appear to grow slower. This was true for media containing 3% NaCl, but even more severe for media with 5% NaCl. However, allowing additional time for growth at high salt does not allow the bacteria to recover the levels of RFP expression seen after 1 day of growth in normal media.
<i>Fig 3: Quantified levels of RFP expression for E. coli with BBa_J04450 grown for 1 day on LB + Chloramphenicol plates supplemented with 1mM IPTG and/or 3% to 5% NaCl. Plates were allowed to grow overnight at 37C for either 1 or 4 days, and photographed against a dark background.
Team TecCEM 2017
The objective of this characterization was to evaluate the moment of maximum expression of the protein and its behavior with the induction with IPTG taking into account the previous characterizations that RFP is optimally expressed with 20 mM IPTG. The complete protocol can be consulted in: http://2017.igem.org/Team:TecCEM/Improve

Figure 1. Basic steps for RFP characterization followed by team TecCEM
We measured biomass and fluorescence for 8 hours and made the corresponding curves.

Figure 2. Graph of the biomass growth of the induced and non induced cultures of DH5α + BBa_J04450

Figure 3. Statistical analysis of the measures of RFP obtained through 8 hours of induction.
We performed also two different 10% SDS PAGE for visualizing the 26 kDa band corresponding to the Red Fluorescent Protein. Each gel was loaded with the non-induced sample and its induced counterpart. However, during the previous treatment, we did not incubate the samples at 100ºC in the water bath, while we did for the samples of the other gel. By not performing this step, the protein was not denaturalized and was seen under the transilluminator.


Figures 4 and 5. Comparison between RFP expression in DH5𝑎 induced and no induced with IPTG.
In these figures, we can also see that by each hour the expression of this protein and the fluorescence intensity increased over time until the eighth hour, where it is maximum. After the eighth hour, both biomass and fluorescence intensity start de decay, so any other team that wants to use this BioBrick to induce the expression of any interest protein in liquid medium will have the highest yield after eight hours.
Team Grenoble-Alpes 2017
The colonies of bacteria transformed with this plasmid are clearly red under natural light after about 18 hours. Smaller colonies are visibly red under UV. The RFP part does not contain a degradation tag and the RBS is strong. This part is commonly used, but can fail if the system contains LacI or CAP protein. (Informations from iGEM website, "Parts" section, see here http://2017.igem.org/Team:Grenoble-Alpes/Parts).
The promoter of mRFP1 gene in each plasmid is supposed to be inducible (with IPTG) but a strong leak of RFP production could be observed. (fig 1)

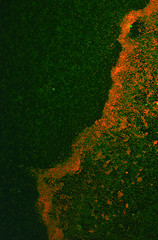
Figure 1: Observation of the leak of the promoter. A : Bacteria transformed or not with BBa_J04450 sequence, naked eye, white light. B. Bacteria without mRFP1 gene, excited at 546nm. C. Bacteria with mRFP1 gene, excited at 546nm. Red fluorescence is notable.
Photos of the fluorescence are taken thanks to SnapLab, the biodetection kit of iGEM Grenoble 2017 (fig 2).
 Figure 2: SnapLab, the detection kit made by Grenoble-Alpes iGEM Team
-> Does IPTG induction bring forward and/or increase RFP production ?
A difference of fluorescence was evaluated, either on the intensity either on the time of apparition of the fluorescence. The following experiment has been designed in this aim.


Results showed IPTG had an importance in RFP production. Indeed, we can see that IPTG allows a shorter rise of fluorescence. It could be interesting to repeat this experience with different IPTG concentrations, to see whether the delay of apparition of the red fluorescence would decrease with a higher amount of inducer.
Team Warwick 2016
This year, our team demonstrated that this part can be triple transformed into the same competent cell while retaining the functionality of all the plasmids. This was demonstrated using pSB1C3, pSB3T5, and pSB4A5.
pSB4A5 is a BioBrick standard vector with a pSC101 replication origin, whilst pSB3T5 has a p15A replication origin. As both of these origins rely on iterons as the negative copy number control, the competition between the plasmids may render them incompatible when in the same cell[1], potentially limiting triple transformation efficiency. However through our experiment we show that the replication origins do not interfere with each other.
To illustrate this, we transferred the triple transformed cells onto plates containing chloramphenicol, tetracycline, and ampicillin, as shown in Figure 1 below. From this plate, we inoculated a single colony into water and streaked this water onto one half of three different plates containing one each of chloramphenicol, tetracycline, and ampicillin. On the other half of the plates, we streaked a colony of top10 cells that had been grown on a streptomycin plate. The results can be seen below in figures 2 and 3. Figure 3 shows the four plates under UV light, clearly showing where colonies have grown. As the triple transformed cells have grown on every single plates and no colonies have grown from the untransformed cells, this shows that plasmid functionality is retained.

Figure 1: Visible light image of triple transformation plated on Chlor-Amp-Tet plate

Figure 2: Visible light image of triple transformation plated on Chlor, Amp, and Tet plates alongside untransformed Top10 cells

Figure 3: UV light image of triple transformation plated on Chlor, Amp, and Tet plates alongside untransformed Top10 clearly showing differences in growth
Team Warwick 2015
Our team considered using this part as part of a system of binding different coloured cells together in order to demonstrate specific cell placement. We characterised this part is order to determine the optimal amount of IPTG required for inducing the gene, and the copy number necessary to express the fluorescence brightly. The results for this can be seen below.
We cloned J04450 into three plasmid with varying copy numbers, in order from highest to lowest copy number they are: pSB1K3, pSB3K3, and pSB4K5. These plasmids were then transformed into electrocompetent MG1655 Z1 cells and grown overnight. THe next morning the cells were refreshed, and different concentrations of IPTG (0uM, 250uM, and 500uM) were added to induce them. For each of the three plasmids in each IPTG concentrations, three biological replicates were made, and when OD600 and RFP absorbance were measured, three technical replicates were made, for a total of 81 copies of the gene grown. The RFP absorbance and OD600 of these cells were measured over 20 hours. The OD600 over time was used to determine at what OD the cells were in steady state. This was then compared to the RFP measured at that time and graphed to show RFP expression per cell.

The graph shows that RFP expression was highest in the pSB1K3 and pSB4K5 plasmids, and that there was little difference in expression between the 250uM and 500uM concentration of IPTG. 0uM IPTG universally showed almost no expression. pSB1K3 should have the highest copy number and pSB4K5 should have the lowest copy number, so it's curious that they both expressed RFP very well. This could be due to a mutation in the pSB4K5 causing it to have a much higher copy number than usual. It is documented here (http://www.ncbi.nlm.nih.gov/pubmed/1283002) that a single point mutation can increase the copy number of a plasmid. The pSB4K5 plasmid we tested has been sent for sequencing in order to determine whether this is the case.
The raw data for this characterisation can be found here:
https://static.igem.org/mediawiki/2015/7/70/Warwick_J04450_raw_data.txt
https://static.igem.org/mediawiki/2015/b/bc/Warwick_J04450_in_pSB1K3_analysed_results.txt
https://static.igem.org/mediawiki/2015/8/8f/Warwick_J04450_in_pSB3K3_analysed_results.txt
https://static.igem.org/mediawiki/2015/5/54/Warwick_J04450_in_pSB4K5_analysed_results.txt
https://static.igem.org/mediawiki/2015/6/64/Warwick_J04450_RFP_OD_analysed_results.txt
Team NRP-UEA_Norwich 2014
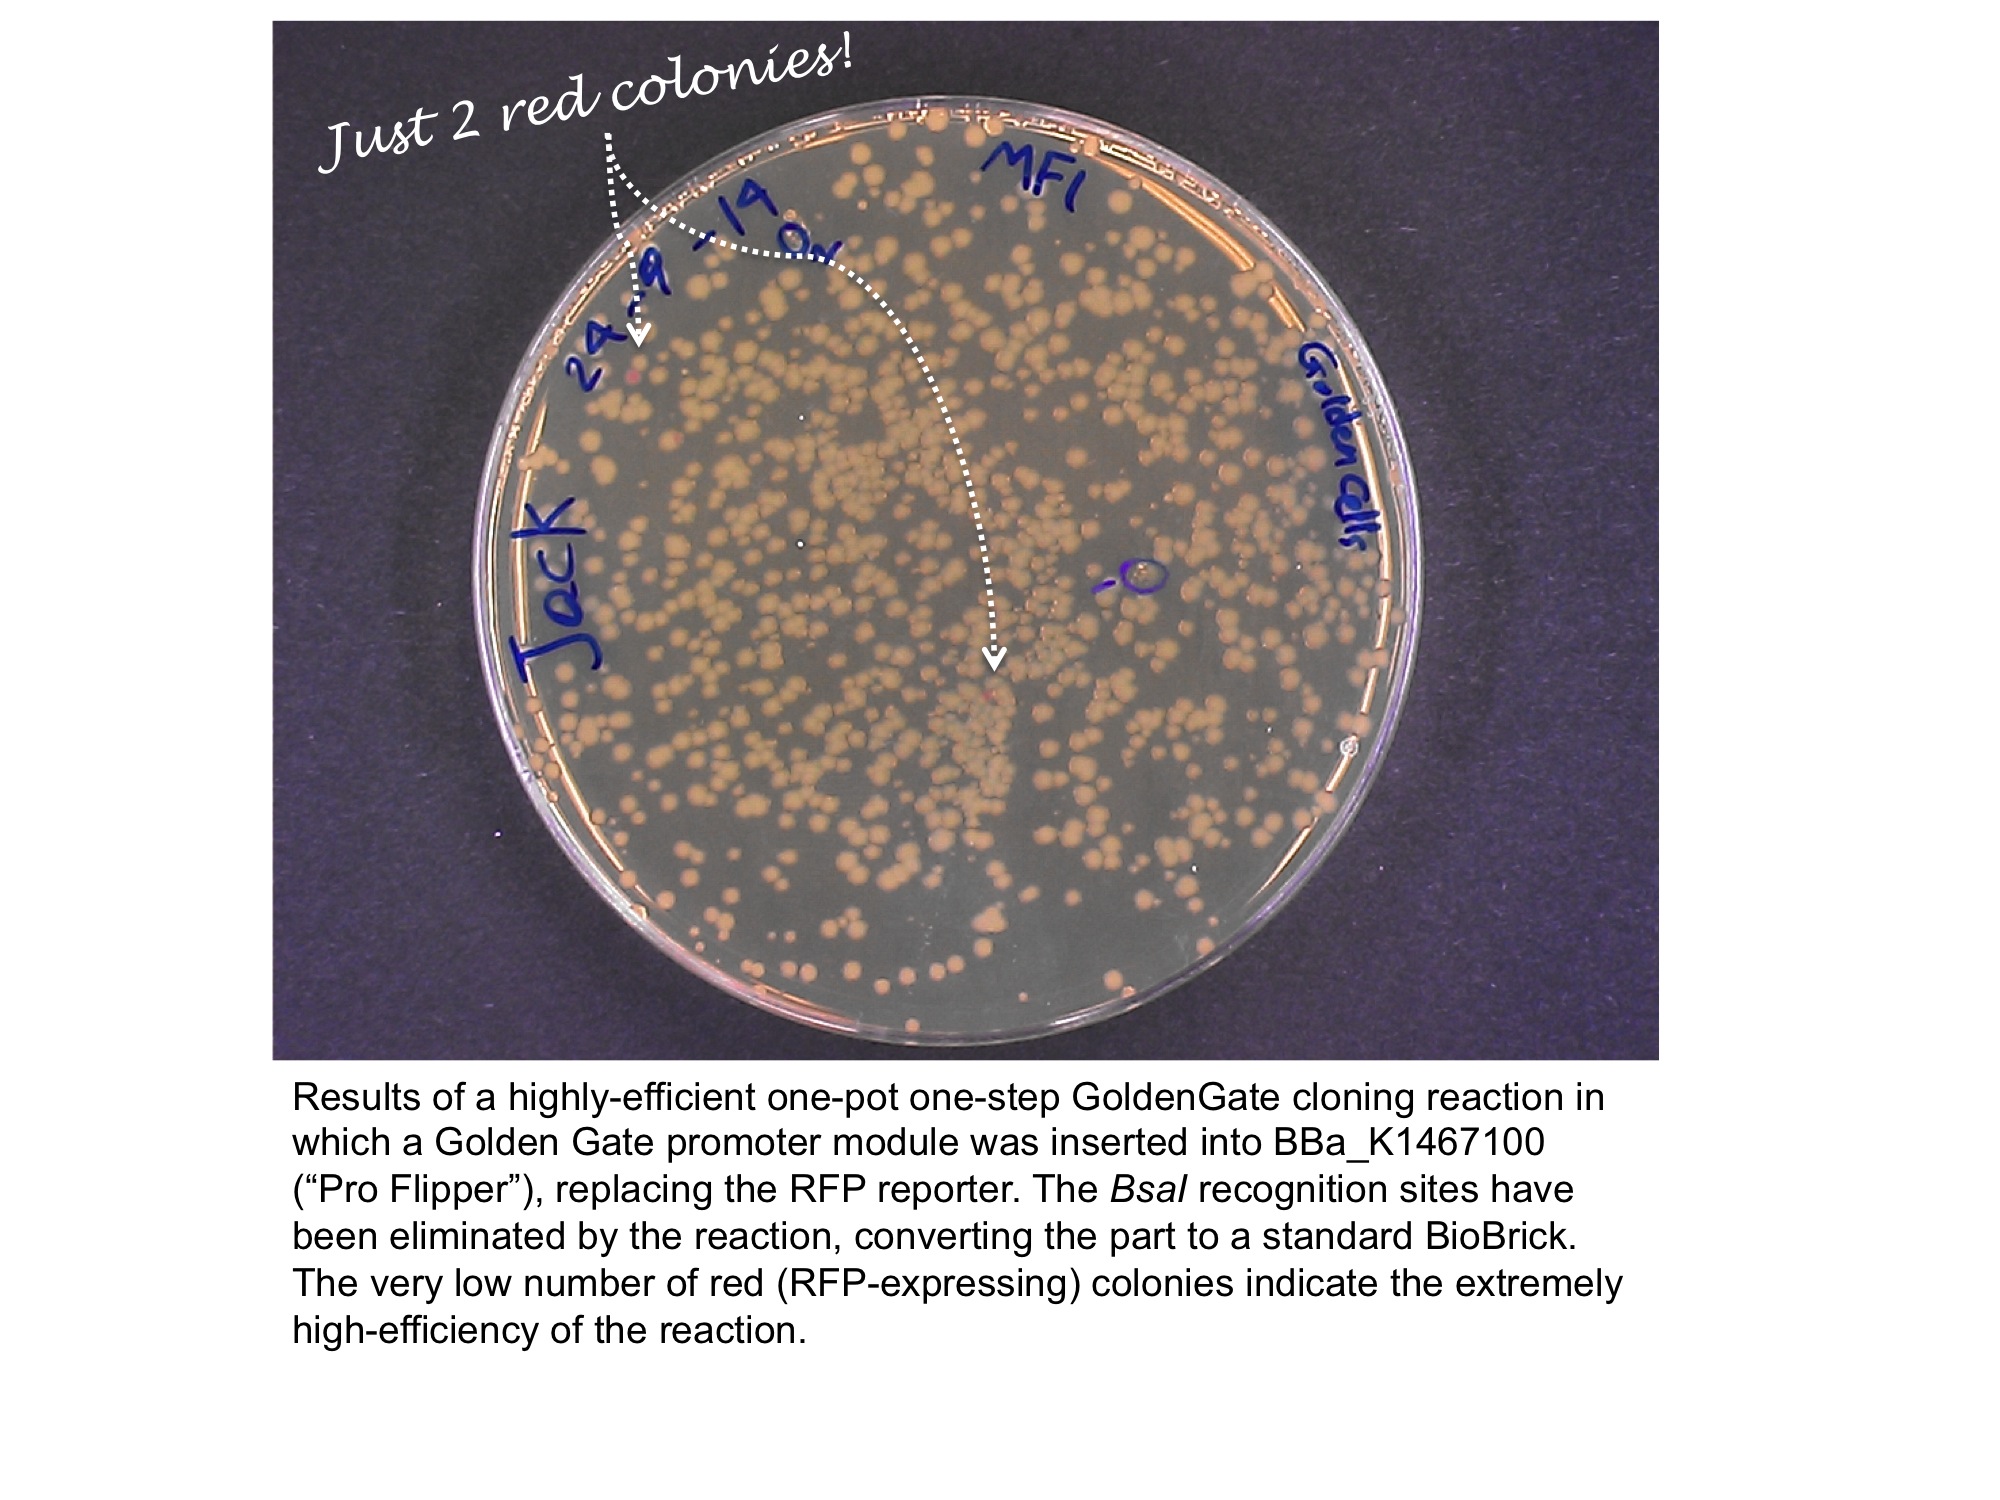
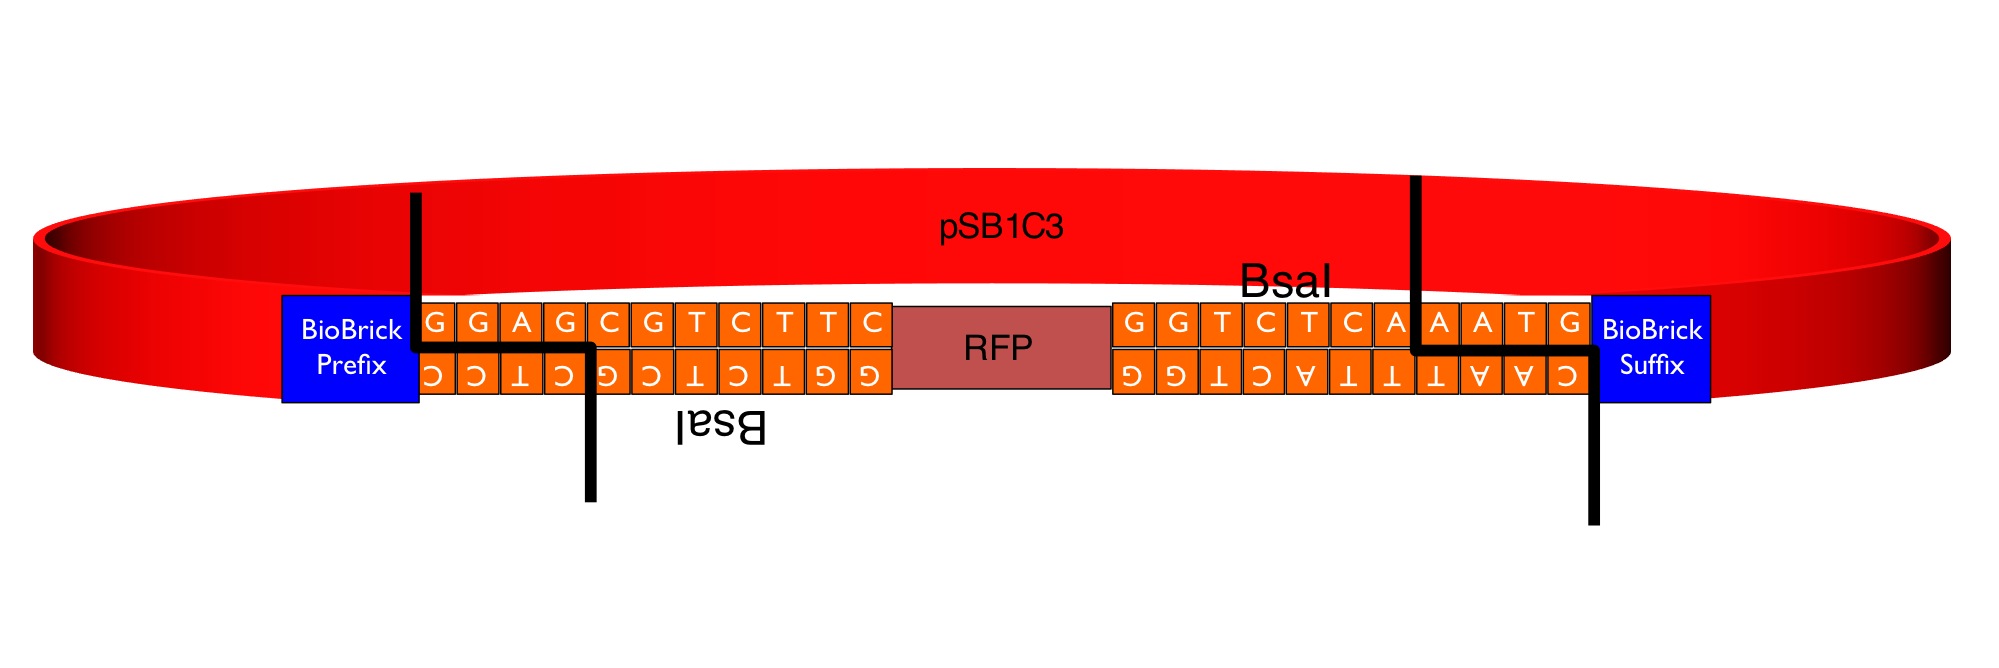
Our team has converted this part into a series of four "GoldenGate Flipper modules" that can be used to convert four types of standard part defined in the GoldenGate MoClo Assembly Standard into standard BioBricks. This was done by inserting an inverted pair of BsaI recognition sequences either side of the original RFP reporter part. The flipper reaction is a one-pot, one-step, digestion-ligation GoldenGate cloning reaction. When cloning is successful the colonies become white as the RFP sequence is replaced by the new part. After the reaction is complete, no part of the BsaI recognition sequence will remain between the BioBrick suffix and the part.
Four types of Golden Gate Parts can be converted. The four new parts differ by the identity of the 4 base-pair 5' overhangs produced by digestion with BsaI.
Bba_K1467100 Pro + 5U MoClo Flipper (GGAG-AATG)
Bba_K1467200 CDS1 MoClo Flipper (AATG-GCTT)
Bba_K1467300 3U + Ter MoClo Flipper (GCTT-CGCT)
Bba_K1467400 Transcriptional Unit MoClo Flipper (GGAG-CGCT)
The image below shows the sequences inserted (in orange) between the RFP and the BioBrick prefix and suffix that enable the flipper to accept MoClo Pro+5U parts (which begin GGAG and end AATG) in a one-step digestion-ligation Golden Gate cloning reaction.
Below is an example of a Golden Gate one-step, one-pot cloning reaction with the improved BioBrick BBa_K1467100, where the restriction enzyme, ligase and (intact, uncut) donating and recipient plasmids were all incubated together in a single reaction before transformation into competent E.coli cells. Cloning was very successful as the vast majority of the colonies are white as the RFP sequence was replaced by the new part.
Team OUC-China 2014
This year our team use this part as a reporter gene link with BBa_k1439000. In order to mark our function plasmid. we find some problem about this part. The result shows Part BBa_J04450 didn’t work well as the reporter gene of the plasmid. The expression quantity of RPF is low or even next to zero under the condition of no resistance screening.

Figure1.
Figure1. Top10 strain containing BBa_J04450(pSB1C3).Culture medium contains no chloramphenicol to the left, to the right contains chloramphenicol. Under the same condition,37℃ 12h,RFP didn’t express in the culture medium without chloramphenicol.
Team NRP-UEA_Norwich 2013
Our team improved this part by adding an NdeI restriction site in front of the promoter region, upstream of the RFP gene. This means a restriction digest can be performed and the promoter or RFP gene exchanged to a allow further cloning. Please see part BBa_K1041000
Our aim was to evaluate RFP expression quantity of E. coli. In order to obtain this information, we agreed that the measurement of fluorescence intensity in certain OD values is the best approach. However, fluorescence quenching was a setback which we must overcome for accurate and reliable results. Because, as a result of quenching, fluorescence intensity counts do not give the actual amount of fluorescence expected from a certain OD value. Therefore we employed a curve fitting method suggested by Zhang et. al (2010) which is claimed to take the quenching problem into consideration

Where If is the fluorescence intensity; OD is the cell density; y0 is the offset; A1 is the amplitude; and t1 is the decay constant.
We chose BBa_J04450 for this experiment. And our negative control was again BBa_B0034.
There were nine bacterial concentrations prepared for one to five hours of IPTG induction. (All concentrations were prepared as triplicates.) Then a complete graph of all the induction durations was plotted with the help of the function shown above:

As seen in the graph, fluorescence behaves exactly as expected and does not increase linearly with the increased bacterial concentration. However, IPTG induction effect is clear on fluorescence intensity. (Error bars were too small to be visible.)

Finally, the variables A1 and t1 of the fittings of each induction duration were used to obtain a mean fluorescence intensity (MFI) value:


By conducting this experiment, we were able to characterize RFP expression pattern of the part BBa_J04450 in the host Top Ten. Theoretical mean fluorescence intensity reflects the fluorescence quantum efficiency of the fluorophore RFP, and was found to be unrelated to the cell concentration. Since it is obvious from the results we have obtained that change in the OD does not correlate linearly with the change in the fluorescence intensity. Therefore this model proposes a solution to the unpredictability of the fluorescence amount coming from a certain bacterial population.
The characterization was performed by METU-TURKEY 2010 IGEM TEAM.
Applications of BBa_J04450
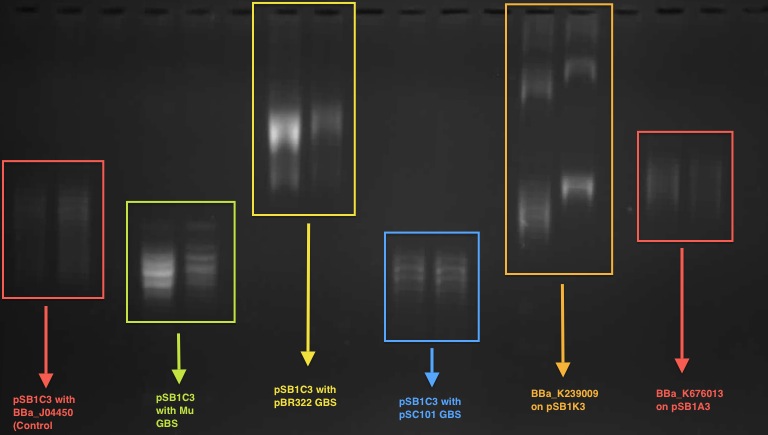
According to our result in the 1D chloroquine gel electrophoresis (at 2.5 μg/mL), the plasmid with the BBa_J04450 (on pSB1C3 backbone) migrated further compared to a plasmid with a known GBS (from pBR322 plasmid - BBa_K676012) on pSB1C£. At the chloroquine concentration which we used, the more negatively supercoiled plasmid will migrate further while the more relaxed molecules will travel slower through the gel.
So this indicates that the device BBa J04450 might have a potential gyrase binding site which facilitates the introduction of negative supercoils into plasmid compared to pBR322 GBS.
This characterisation was carried out by the UCL iGEM team 2011.
Tianjin iGEM 2012
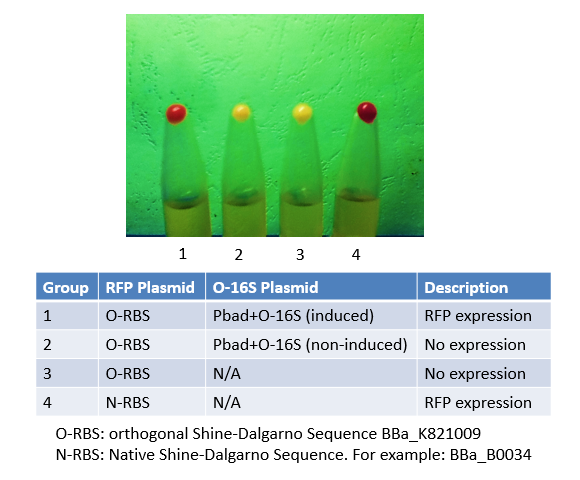
Originally, we used this BioBrick to express RFP in Group 4. We mutated the Shine-Dalgarno sequence of this BioBrick to make an orthogonal counterpart, BBa_K821001. As shown in the image, No. 4 is the product of this BioBrick, and No.1 is the product of its orthogonal counterpart. The results justified both this BioBrick and our BBa_K821001 worked very well, and expressed considerable amount of protein.
Glasgow iGEM 2011
It was found that the Red fluorescence of this protein was not consistently apparent when expressed in biofilm - although some results were observed. Numerous attempts to transform this construct into E. coli Nissle 1917 cells in a biofilm forming assay were unsuccessful, however, the RPF expressed readily into E. coli Nissle 1917 cells when grown on an agar plate.
The antibiotic resistance was still carried across when the culture was inoculated into the biofilm assay indicating that the plasmid was still present. The cultures were shaken at room temperature overnight.
It was thought that the lack of fluorescence was caused by the anoxic conditions generated by the biofilm assay, which may have resulted in poor folding of the chromophore. These results show that RFP is not the most efficient reporter molecule for biofilm, we would recommend something like iLOV, a new biobrick submitted by the Glasgow iGEM team this year [1].
Glasgow iGEM team 2011
Haynes Lab, 2012
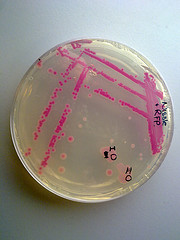
I used BBa_J04450 to demonstrate the expression of RFP in E. coli for a biomedical engineering course at Arizona State University.
- Cells: NEB10B
- Medium: LB Lennox agar, 100 ug/mL ampicillin
- The yellow/green area contains bacteria expressing GFP from BBa_I13522
User Reviews
UNIQ988db2ddab4b9e42-partinfo-00000007-QINU
|
•••••
<I>Antiquity |
This review comes from the old result system and indicates that this part worked in some test. |
|
•••••
|
We've used this part as an alternative to the suicide part p1010 (ccdB) for selecting against cells that have been transformed with a [http://ginkgobioworks.com/support/BioBrick_Assembly_Manual.pdf destination plasmid]. It worked perfectly, and if i might say, it looks smashingly in LB medium ;). |
|
•••••
|
We obtained this part from the Spring 2011 distribution plate. It expresses wonderfully in NEB10B cells from New England Biolabs. It does not express well in the fast-growing strain DH5-alpha Turbo, which we've found doesn't express transgenes very well in general. |
Team Westminster_UOW 2016
During our iGEM project we aimed to characterise two parts, BBa_J04450 which is a pSB1C3 plasmid present within the iGEM 2016 kit. We did a series of experiments testing the different expression rates it grows at in XL1-Blue and TOP10. We found that in XL1-blue it showed some but very little expression rate without IPTG in experiment 2.4. This may indicate that there is “leaky” expression of the RFP taking place. It was also found to grow better with the addition of 0.1mM IPTG (experiment 2.5) the RFP expression was much higher in XL1-Blue which was expected as XL1-Blue contains a LacI inhibitor encoded in its genomic DNA. However this raises the question as to why it showed a low level protein expression when un-induced by IPGT. It was found to grow extremely well in a TOP10 strain with or without IPTG which is expected as TOP10 does not contain the inhibitor molecule that is present within XL1-Blue. We grew the plasmid pSB3T5 (BBa_I52001) containing an RFP insert with a p15A replication origin and a tetracycline resistance gene, It showed protein expression at a low rate when un-induced and grown in TOP10 strain providing evidence for it being a low-medium copy number plasmid. We also determined that pSB1C3 (BBa_J04450) cannot grow in a co-culture of both XL1-blue and TOP10, the co-culture results showed little/no expression of the RFP therefore is ineffective at expressing in a co-culture.


Team iTesla-SoundBio 2017
We used BBa_J04450, a popular biobrick among other iGEM teams as a vector to house our inserts. Encountering an abnormally high false positive rate with our transformations, we found this aspect of the plasmid worth investigating. Each step in the process (digesting, ligating, and transforming) compounds inefficiency, reducing the probability of a successful transformation. The false positive rate does not pose a problem for highly efficient events; however, for rare events where ligation efficiency is diminished, the chances of selecting a false positive increase dramatically. To characterize the false positive rate, we sequenced 8 colonies and determined the main causes of false positives.
In this context, we define a false positive result as a white colony that did not contain the desired insert based on sequencing data. Expanding on that, a negative result appeared as a red colony on the plate, and a ‘true positive’ was a white colony that, after sequencing, we learned contained the expected insert. Of the eight colonies we sequenced from two experiments, three were in fact true positives and five were false positives. Three of the false positives had a problem with their backbones and still had RFP (either undigested or religated BBa_J04450). Interestingly, two of the sequences only contained a fragment of the RFP gene.
The 3’ terminal deletion appears similar to a PstI cut site (one of our biobricking restriction enzymes), leading us to consider two hypotheses. First, the backbone plasmid had a mutation adding a PstI cut site in the middle of the RFP coding region. Second, the conditions of our digestion reaction may have elicited star activity allowing PstI to cut incorrectly.
There are solutions for these specific cases of false positives. One option is to run a more exhaustive purification gel. A longer run time and lower voltage would form tighter bands and would help differentiate between completely and partially digested backbones, decreasing inefficiency at this step in the cloning process. Another solution is to apply a silent mutation at base pair 1654, decreasing the odds of this sequence being recognized as a cut site.
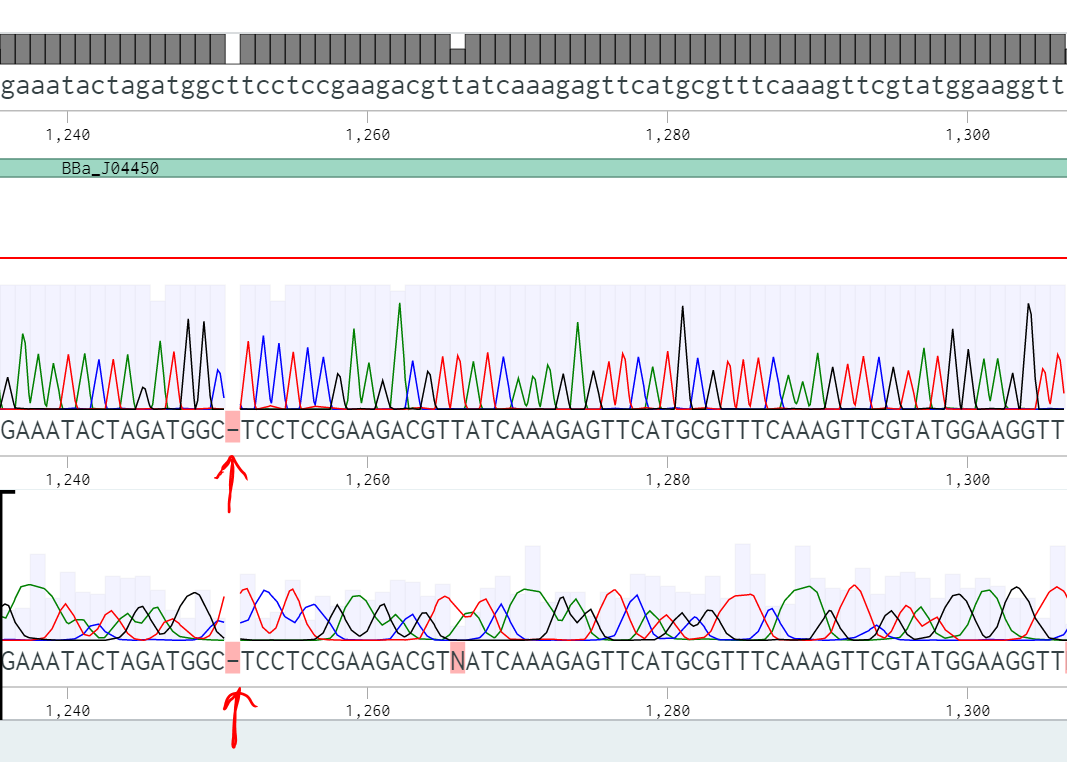
Another false positive attributed to the backbone was caused by a frameshift mutation (Figure 2). These are unavoidable as the error occurred during PCR, so the only option would be to sequence minipreps after transformation, a precaution we already take.
We determined that the final source for false positives was insert related. There was a large-scale truncated inversion of the gene present in our backbone, and its placement infers such a large error in the process that we didn’t see value in investigating further.
Over all two rounds of our transformations and eight sequenced white colonies,three were true positives and five were false positives. Of those false positives, we determined that two plasmids suffered from pstI enzyme promiscuity (on the backbone), one plasmid incurred a frameshift mutation (also on the backbone), and one plasmid experienced an unprecedented truncated inversion with its insert. We determined a few ways to optimize efficiency, and decrease chances of backbone errors specifically; to run purification gels longer and at a lower voltage, therefore decreasing inefficiency during the digestion step, and to apply a silent mutation at base pair 1654, therefore eliminating the chances of a natural cut site being recognized there.
UNIQ988db2ddab4b9e42-partinfo-0000000B-QINU


