Difference between revisions of "Cell-free chassis/Commercial E. coli T7 S30"
(→Commercial ''E. coli'' T7 S30) |
(→Commercial ''E. coli'' T7 S30) |
||
| Line 14: | Line 14: | ||
|<center>[https://parts.igem.org/wiki/index.php/Chassis/Cell-Free_Systems/Commercial_E.coli_T7_S30/Expression_Lifespan <font face=georgia color=#000066 size=4>Expression lifespan</font>]</center> || [[Image:T7_Expression_Lifespan.JPG|thumb|200px|center|]] '''Graph 3. Graph of rate of GFP synthesis (mol per min) against time (minutes) at 4oC (blue), 25oC (red) and 37oC (green).''' The simple constitutive gene expression device [https://parts.igem.org/wiki/index.php/Part:BBa_E7104 BBa_E7104] has been used. Each of the three coloured lines show average measurements based on three replicates of the experiment. The error bars represent the standard deviation of the measurements. | |<center>[https://parts.igem.org/wiki/index.php/Chassis/Cell-Free_Systems/Commercial_E.coli_T7_S30/Expression_Lifespan <font face=georgia color=#000066 size=4>Expression lifespan</font>]</center> || [[Image:T7_Expression_Lifespan.JPG|thumb|200px|center|]] '''Graph 3. Graph of rate of GFP synthesis (mol per min) against time (minutes) at 4oC (blue), 25oC (red) and 37oC (green).''' The simple constitutive gene expression device [https://parts.igem.org/wiki/index.php/Part:BBa_E7104 BBa_E7104] has been used. Each of the three coloured lines show average measurements based on three replicates of the experiment. The error bars represent the standard deviation of the measurements. | ||
|- | |- | ||
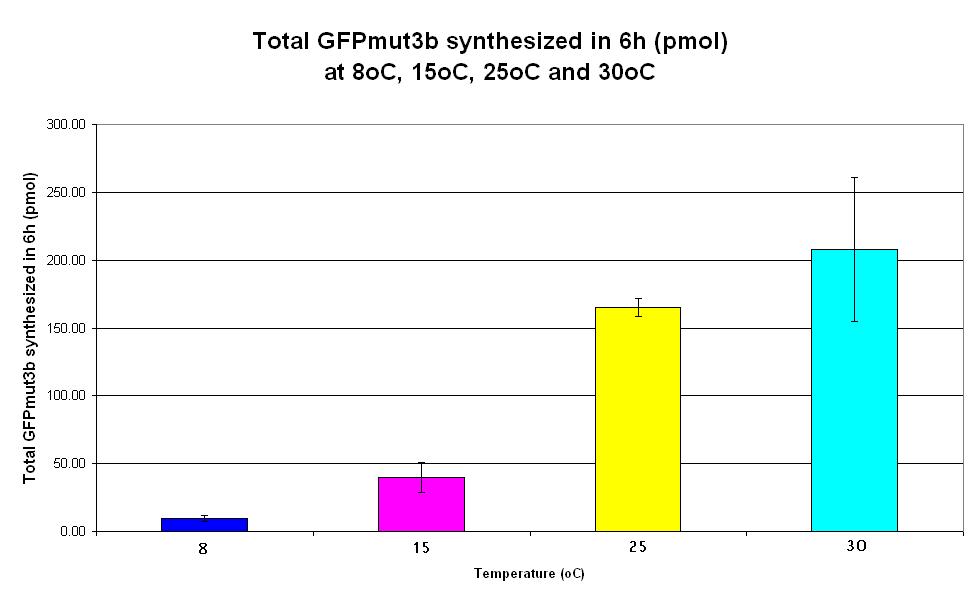
| − | |<center>[https://parts.igem.org/wiki/index.php/Chassis/Cell-Free_Systems/Commercial_E.coli_T7_S30/Expression_Capacity <font face=georgia color=#000066 size=4>Expression capacity</font>]</center> || [[Image:S30_Expression_Capacity.JPG|thumb|200px|center|]] '''Graph | + | |<center>[https://parts.igem.org/wiki/index.php/Chassis/Cell-Free_Systems/Commercial_E.coli_T7_S30/Expression_Capacity <font face=georgia color=#000066 size=4>Expression capacity</font>]</center> || [[Image:S30_Expression_Capacity.JPG|thumb|200px|center|]] '''Graph 4. Bar chart showing total GFPmut3b synthesized in 6 hours (pmol) at 4oC (dark blue), 25oC (pink) and 37oC (yellow).''' The simple constitutive gene expression device [https://parts.igem.org/wiki/index.php/Part:BBa_E7104 BBa_E7104] has been used. Each of the three coloured bars show average measurements based on three replicates of the experiment. The error bars represent the standard deviation of the measurements. |
|} | |} | ||
==References== | ==References== | ||
Please refer to the [http://www.promega.com/tbs/tb219/tb219.pdf Promega cell extract user guide] for detailed information about the Commercial ''E. coli'' T7 S30 extract. | Please refer to the [http://www.promega.com/tbs/tb219/tb219.pdf Promega cell extract user guide] for detailed information about the Commercial ''E. coli'' T7 S30 extract. | ||
Revision as of 21:27, 25 October 2007
Commercial E. coli T7 S30
| Cell-Free Systems (back to Intro) | Introduction |
| The Commercial E. coli T7 S30 extract was purchased from Promega. It was prepared by modifications of the method described by Zubay et al (1980). E. coli strain B deficient in OmpT endoproteinase and lon protease activity was used.
The simple constitutive gene expression device BBa_E7104 has been used to characterize this cell-free chassis | |
| Graph 1. Graph of GFPmut3b synthesized (pmol) against time (minutes) at 4oC (dark blue), 25oC (pink) and 37oC. The simple constitutive gene expression device BBa_E7104 has been used. Each of the three coloured lines show average measurements based on three replicates of the experiment. The error bars represent the standard deviation of the measurements. | |
| Graph 2. Graph of rate of GFPmut3b synthesis (pmol per min) against time (minutes) at 4oC (dark blue), 25oC (pink) and 37oC (yellow). The simple constitutive gene expression device BBa_E7104 has been used. Each of the three coloured lines show average measurements based on three replicates of the experiment. The error bars represent the standard deviation of the measurements. | |
| Graph 3. Graph of rate of GFP synthesis (mol per min) against time (minutes) at 4oC (blue), 25oC (red) and 37oC (green). The simple constitutive gene expression device BBa_E7104 has been used. Each of the three coloured lines show average measurements based on three replicates of the experiment. The error bars represent the standard deviation of the measurements. | |
| Graph 4. Bar chart showing total GFPmut3b synthesized in 6 hours (pmol) at 4oC (dark blue), 25oC (pink) and 37oC (yellow). The simple constitutive gene expression device BBa_E7104 has been used. Each of the three coloured bars show average measurements based on three replicates of the experiment. The error bars represent the standard deviation of the measurements. |
References
Please refer to the [http://www.promega.com/tbs/tb219/tb219.pdf Promega cell extract user guide] for detailed information about the Commercial E. coli T7 S30 extract.


