
Difference between revisions of "Part:BBa K1758320"
| Line 79: | Line 79: | ||
<p>Taking the influence of different chromium concentrations under consideration measured fluorescence can be normalized on chromium’s influence on the cell extract (figure 8). Normalized data suggest, that higher concentrations of chromium induce fluorescence in relevance to chromium’s influence on the cell extract. </p> | <p>Taking the influence of different chromium concentrations under consideration measured fluorescence can be normalized on chromium’s influence on the cell extract (figure 8). Normalized data suggest, that higher concentrations of chromium induce fluorescence in relevance to chromium’s influence on the cell extract. </p> | ||
| − | |||
| − | |||
| − | |||
| − | |||
| − | |||
| − | |||
| − | |||
| − | |||
| − | |||
| − | |||
| − | |||
</html> | </html> | ||
Revision as of 10:32, 20 September 2015
copper activator under control constitutive promoter and strong RBS
Activator for copper induceble promoter copAP under the control of constitutive promoter (K608002)
Usage and Biology
cueR is a merR like regulator, which stimulates the transcription of copAP, a P-type ATPase pump (Outten et al. 2000). CopAP is the central component in obtaining copper homeostasis, it exports free copper from cytoplasm to the periplasm. This is enabled by copper induced activation of the operon transcription via CueR. The CueR-Cu+ is the DNA-binding transcriptional dual regulator which activates transcription (Yamamoto, Ishihama 2005). This part was used for our in vivo and in vitro characterisation. The CueR serve in our systems as activator and regulate the discription of sfGFP.
Results
in vivo characterisation
Our sensor for copper detection consists of CueR a MerR like activator and the copper specific promoter copAP. The promoter is regulated by CueR, which binds Cu 2+ ions. We also used a sfGFP downstream the promoter for detection through a fluorescence signal.
For our copper sensor we used the native operator of cooper homeostasis from E.coli K12. We constructed a part (BBa_K1758324) using the basic genetic structur shown in our biosensors.The operator sequence, which includes the promoter (copAP), is regulated by the activator CueR. In BBa_K1758324 we combined a codon optimized version of cueR (BBa_K1758320) under the control of a constitutive promoter with sfGFP under the control of the corresponding promoter copAP (BBa_K1758321)(figure 1). Through the addition of a 5’ UTR upstream of the sfGFP we optimized the expression of sfGFP and increased fluorescence.


In vivo we could show that the adding different concentrations of copper has effects on the transcription levels of sfGFP.
in vitro characterisation
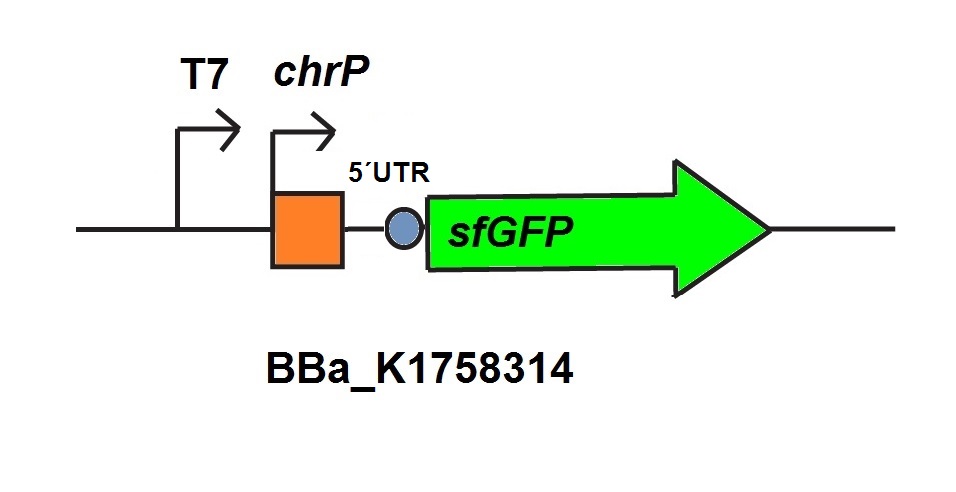
For the characterization of the chromium sensor with CFPS we used parts differing from that we used in vivo characterization. For the in vitro characterization we used a cell extract produced from cells which contain the plasmid (BBa_K1758310). The plasmid contains the gene chrB under the control of a constitutive promoter, so that the cell extract is enriched with repressor molecules. In addition to that we added plasmid-DNA of the chromium specific promoter chrP with 5’UTR-sfGFP under the control of T7-promoter (BBa_K1758314 (figure 5))to the cell extract. The T7-promoter is needed to get a better fluorescence expression.


Chromium’s influence on the cell extract as shown in figure 6 is minimal for low concentrations. Higher chromium concentrations have a measurable impact on the viability of the cell extract, which is visible at concentrations of 120 µg/L and obvious at concentrations of 240 µg/L chromium.

The decrease of fluorescence for higher chromium concentrations in chromium specific cell extract is shown in figure 8. An increase of fluorescence at higher chromium concentrations would have been expected resulting out of the induction of the chromium sensor. A factor which should be considered is the influence of high chromium concentrations to the cell extract. The test for influence of chromium on the specific cell extract, illustrated in figure 6 showed that the influence of chromium at low concentrations is not significant. But the graphic shows that high concentrations of chromium induce fatal damages to the cell extract.

Taking the influence of different chromium concentrations under consideration measured fluorescence can be normalized on chromium’s influence on the cell extract (figure 8). Normalized data suggest, that higher concentrations of chromium induce fluorescence in relevance to chromium’s influence on the cell extract.