
Difference between revisions of "Part:BBa K1758312"
(→Sequence and Features) |
|||
| Line 1: | Line 1: | ||
===Usage and Biology=== | ===Usage and Biology=== | ||
<html> | <html> | ||
| + | |||
<p align="justifiy"> | <p align="justifiy"> | ||
| − | + | Our sensor for chromium detection consists of <i>chrB</i> the repressor and the chromate specific promoter <i>chrP</i>. The promoter is regulated by the <i>chrP</i>, used for <i>in vivo</i> characterization </figcaption> | |
| + | </figure>, which binds Cr-ions. Behind the promoter is a <i>sfGFP</i> for detection of a fluorescence signal.</p> | ||
| + | <i>In vivo</i> we could show that the addition of different concentrations of chromium have different effects to transcription of <i>sfGFP</i>.</p> | ||
</html> | </html> | ||
===Sequence and Features=== | ===Sequence and Features=== | ||
| + | <!-- --> | ||
| − | + | <partinfo>BBa_K1758313 SequenceAndFeatures</partinfo> | |
| − | <partinfo> | + | |
===Results=== | ===Results=== | ||
<html> | <html> | ||
<p align="justify"> | <p align="justify"> | ||
| − | </p> | + | <h2><i>in vivo</i> characterisation</h2> |
| + | |||
| + | <body style="width:600px;"> | ||
| + | <p align="justify"> | ||
| + | Our sensors were cultivated in the BioLector. Due to the accuracy of this device we could measure our sample in duplicates.</br></br> | ||
| + | <figure> | ||
| + | <img src="https://static.igem.org/mediawiki/2015/8/82/Bielefeld-CeBiTec_Biolector_chromium.jpg" width="90%" alt="Adjusting the detection limit"> | ||
| + | <figcaption>Time course of the induction of a chromium biosensor with sfGFP for different chromium concentrations in vivo. The data are measured with BioLector and normalized on OD600. Error bars represent the standard deviation of two biological replicates.</figcaption> | ||
| + | </figure> | ||
| + | |||
| + | <figure> | ||
| + | <a href="https://static.igem.org/mediawiki/2015/7/73/Bielefeld-CeBiTec_Biolector_chromium_Balkendiagramm.jpg" data-lightbox="heavymetals" data-title="Fluorescence levels at three different stages of cultivation. Shown are levels after 60 minutes, 150 minutes and 650 minutes. Error bars represent the standard deviation of three biological replicates."><img src="https://static.igem.org/mediawiki/2015/7/73/Bielefeld-CeBiTec_Biolector_chromium_Balkendiagramm.jpg" width="90%" alt="Adjusting the detection limit"></a> | ||
| + | <figcaption>Fluorescence levels at three different stages of cultivation. Shown are levels after 60 minutes, 150 minutes and 650 minutes. Error bars represent the standard deviation of three biological replicates.</figcaption> | ||
| + | </figure> | ||
| + | </br><p>Our data lead to the conclusion that in a cell based system it is possible to detect chromium. | ||
| + | In contrast to our expectations with higher chromium concentrations we got lower fluorescence levels. These observations needed further investigation. </p> | ||
| + | |||
| + | <h2><i>in vitro</i> characterisation</h2> | ||
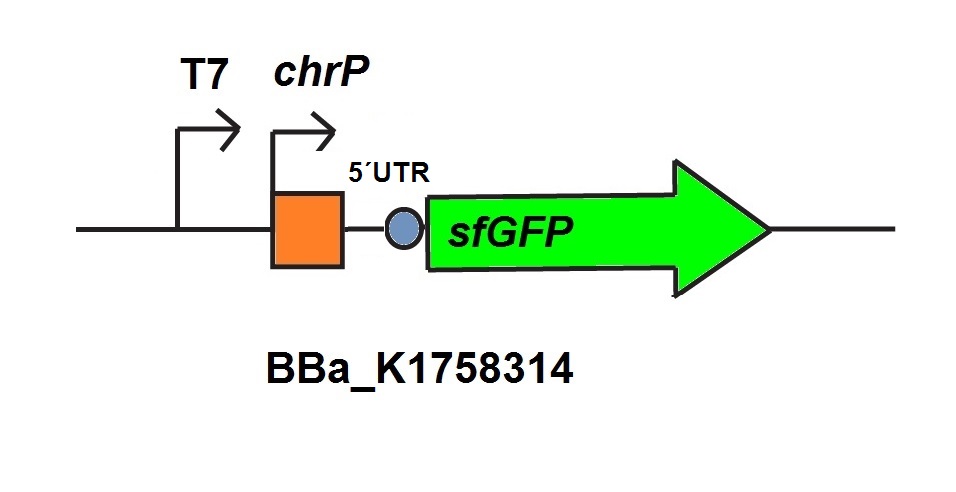
| + | <p>For the characterization of the chromium sensor with CFPS we used parts differing from that we used in vivo characterization. For the in vitro characterization we used a cell extract produced from cells which contain the plasmid (<a href="https://parts.igem.org/Part:BBa_K1758310" target="_blank">BBa_K1758310</a>). The plasmid contains the gene <i>chrB</i> under the control of a constitutive promoter, so that the cell extract is enriched with repressor molecules. In addition to that we added plasmid-DNA of the chromium specific promoter <i>chrP</i> with 5’UTR-sfGFP under the control of T7-promoter (<a href="https://parts.igem.org/Part:BBa_K1758314" target="_blank">BBa_K1758314</a> (figure 6))to the cell extract. The T7-promoter is needed to get a better fluorescence expression. </p> | ||
| + | |||
| + | |||
| + | <div class="row"> | ||
| + | <figure> | ||
| + | <a><img src=" https://static.igem.org/mediawiki/2015/e/e4/Bielefeld-CeBiTec_in_vitro_ChrB-part.jpeg" alt="repressor construct used for in vivo characterisation" width="500px"></a> <figcaption> Figure 5: To produce the cell extract for <i>in vitro</i> characterization a construct (<a href="https://parts.igem.org/Part:BBa_K1758310" target="_blank">BBa_K1758310</a> ) with chromium repressor under the control of a constitutive promoter and strong RBS (BBa_K608002) is needed.</figcaption> | ||
| + | </figure> | ||
| + | |||
| + | <figure> | ||
| + | <a><img src=" https://static.igem.org/mediawiki/2015/1/1f/Bielefeld-CebiTec_in_vitro_T7-chrP-UTR-sfGFP.jpeg" alt="promoter construct used for in vivo characterisation" width= "500px"></a> <figcaption> T7-chrP-UTR-sfGFP <a href="https://parts.igem.org/Part:BBa_K1758314" target="_blank">BBa_K1758314</a> used for <i>in vitro</i> characterization.</figcaption> | ||
| + | </figure> | ||
| + | </div> | ||
| + | |||
| + | |||
| + | |||
| + | <figure > | ||
| + | <a><img src="https://static.igem.org/mediawiki/2015/9/99/Bielefeld-CeBiTec_Influence_of_chromium_on_the_cell_extract.jpeg" alt="Adjusting the detection limit" width= "800px"></a> | ||
| + | <figcaption>Figure 7: Influence of different chromium concentrations on our crude cell extract. Error bars represent the standard deviation of three biological replicates. </figcaption> | ||
| + | </figure> | ||
| + | |||
| + | <p>Chromium’s influence on the cell extract as shown in figure 7 is minimal for low concentrations. Higher chromium concentrations have a measurable impact on the viability of the cell extract, which is visible at concentrations of 120 µg/L and obvious at concentrations of 240 µg/L chromium.</p> | ||
| + | |||
| + | |||
| + | <div class="row"> | ||
| + | <figure > | ||
| + | <a><img src="https://static.igem.org/mediawiki/2015/f/fb/Bielefeld-CeBiTec_induction_chromium_in_chrB_cell_extract.jpg" alt="Adjusting the detection limit" width=" 800px"></a> | ||
| + | <figcaption>Figure 8: Chromium specific cell extract made from <i>E. coli</i> cells which already expressed the repressor before cell extract production. Induction with different chromium concentrations. Error bars represent the standard deviation of three biological replicates. </figcaption> | ||
| + | </figure> | ||
| + | |||
| + | <p>The decrease of fluorescence for higher chromium concentrations in chromium specific cell extract is shown in figure 8. An increase of fluorescence at higher chromium concentrations would have been expected resulting out of the induction of the chromium sensor. | ||
| + | |||
| + | A factor which should be considered is the influence of high chromium concentrations to the cell extract. The test for influence of chromium on the specific cell extract, illustrated in figure 7 showed that the influence of chromium at low concentrations is not significant. But the graphic shows that high concentrations of chromium induce fatal damages to the cell extract. </p> | ||
| + | |||
| + | |||
| + | |||
| + | </body> | ||
</html> | </html> | ||
Revision as of 06:05, 19 September 2015
Usage and Biology
Our sensor for chromium detection consists of chrB the repressor and the chromate specific promoter chrP. The promoter is regulated by the chrP, used for in vivo characterization , which binds Cr-ions. Behind the promoter is a sfGFP for detection of a fluorescence signal.
In vivo we could show that the addition of different concentrations of chromium have different effects to transcription of sfGFP.Sequence and Features
- 10COMPATIBLE WITH RFC[10]
- 12INCOMPATIBLE WITH RFC[12]Illegal NheI site found at 55
Illegal NheI site found at 966
Illegal NheI site found at 989 - 21INCOMPATIBLE WITH RFC[21]Illegal BglII site found at 1144
- 23COMPATIBLE WITH RFC[23]
- 25INCOMPATIBLE WITH RFC[25]Illegal AgeI site found at 124
- 1000INCOMPATIBLE WITH RFC[1000]Illegal SapI.rc site found at 1237
Results
in vivo characterisation
Our sensors were cultivated in the BioLector. Due to the accuracy of this device we could measure our sample in duplicates.


Our data lead to the conclusion that in a cell based system it is possible to detect chromium. In contrast to our expectations with higher chromium concentrations we got lower fluorescence levels. These observations needed further investigation.
in vitro characterisation
For the characterization of the chromium sensor with CFPS we used parts differing from that we used in vivo characterization. For the in vitro characterization we used a cell extract produced from cells which contain the plasmid (BBa_K1758310). The plasmid contains the gene chrB under the control of a constitutive promoter, so that the cell extract is enriched with repressor molecules. In addition to that we added plasmid-DNA of the chromium specific promoter chrP with 5’UTR-sfGFP under the control of T7-promoter (BBa_K1758314 (figure 6))to the cell extract. The T7-promoter is needed to get a better fluorescence expression.


Chromium’s influence on the cell extract as shown in figure 7 is minimal for low concentrations. Higher chromium concentrations have a measurable impact on the viability of the cell extract, which is visible at concentrations of 120 µg/L and obvious at concentrations of 240 µg/L chromium.

The decrease of fluorescence for higher chromium concentrations in chromium specific cell extract is shown in figure 8. An increase of fluorescence at higher chromium concentrations would have been expected resulting out of the induction of the chromium sensor. A factor which should be considered is the influence of high chromium concentrations to the cell extract. The test for influence of chromium on the specific cell extract, illustrated in figure 7 showed that the influence of chromium at low concentrations is not significant. But the graphic shows that high concentrations of chromium induce fatal damages to the cell extract.