
Difference between revisions of "Part:BBa K1758340"
| Line 1: | Line 1: | ||
| − | |||
__NOTOC__ | __NOTOC__ | ||
<partinfo>BBa_K1758340 short</partinfo> | <partinfo>BBa_K1758340 short</partinfo> | ||
| Line 17: | Line 16: | ||
<partinfo>BBa_K1758340 parameters</partinfo> | <partinfo>BBa_K1758340 parameters</partinfo> | ||
<!-- --> | <!-- --> | ||
| + | |||
| + | |||
| + | <h2><i>in vitro</i></h2> | ||
| + | <p>For the characterization of the mercury sensor with CFPS we used parts differing from that we used in the <i>in vivo</i> characterization. For the <i>in vitro</i> characterization we used a cell extract out of cells, which contained the plasmid (<a href="https://parts.igem.org/Part:BBa_K1758340" target="_blank"> BBa_K1758340</a>)(figure 5). In addition, we added plasmid DNA to the cell extract. This plasmid consisted of the mercury specific promoter <i>pmerT</i> with 5’-UTR-sfGFP. The entire sequence was placed under the control of of T7-promoter (<a href="https://parts.igem.org/Part:BBa_K1758344" target="_blank"> BBa_K1758344</a>)(figure 6). The T7-promoter is needed to get a better fluorescence expression.</p> | ||
| + | |||
| + | <div class="row"> | ||
| + | <div class="col-md-6 text-center" style="margin-bottom: 50px"> <figure style="width: 400px"> | ||
| + | <a href=" https://static.igem.org/mediawiki/2015/3/3c/Bielefeld-CeBiTec_in_vitro_merR-part.jpeg" data-lightbox="heavymetals" data-title=" Figure 5: To produce the cell extract for <i>in vitro</i> characterization a construct (BBa_K1758340 ) with chromium repressor under the control of a constitutive promoter and strong RBS. " alt="repressor construct used for in vivo characterization."><img src=" https://static.igem.org/mediawiki/2015/3/3c/Bielefeld-CeBiTec_in_vitro_merR-part.jpeg" alt="repressor construct used for in vitro characterisation"></a> <figcaption>Figure 5: To produce the cell extract for <i>in vitro</i> characterization a construct (<a href="https://parts.igem.org/Part:BBa_K175840" target="_blank">BBa_K175840</a>) with chromium repressor under the control of a constitutive promoter and strong RBS (BBa_K608002) is needed. </figcaption> | ||
| + | </figure> | ||
| + | </div> | ||
| + | <div class="col-md-6 text-center" style="margin-bottom: 50px"> <figure style="width: 400px"> | ||
| + | <a href=" https://static.igem.org/mediawiki/2015/e/e2/Bielefeld-CebiTec_in_vitro_T7-merT-UTR-sfGFP.jpeg " data-lightbox="heavymetals" data-title="T7-PmerT-UTR-sfGFP used for<i>in vitro</i> characterization." https://static.igem.org/mediawiki/2015/e/e2/Bielefeld-CebiTec_in_vitro_T7-merT-UTR-sfGFP.jpeg " alt="promoter construct used for in vivo characterization."><img src=" https://static.igem.org/mediawiki/2015/e/e2/Bielefeld-CebiTec_in_vitro_T7-merT-UTR-sfGFP.jpeg" alt="promoter construct used for in vivo characterisation "></a> <figcaption>T7-<i>PmerT</i>-UTR-sfGFP <a href="https://parts.igem.org/Part:BBa_K1758344" target="_blank"> BBa_K175844</a> used for<i>in vitro</i> characterization.</figcaption> | ||
| + | </figure> | ||
| + | </div> | ||
| + | </div> | ||
| + | |||
| + | |||
| + | |||
| + | |||
| + | |||
| + | |||
| + | |||
| + | <figure style="width: 600px"> | ||
| + | <a href="https://static.igem.org/mediawiki/2015/b/b9/Bielefeld-CeBiTec_Influence_of_mercury_on_the_cell_extract.jpeg" data-lightbox="heavymetals" data-title="Figure 7: Influence of different mercury concentrations on our crude cell extract. Error bars represent the standard deviation of three biological replicates. "><img src="https://static.igem.org/mediawiki/2015/b/b9/Bielefeld-CeBiTec_Influence_of_mercury_on_the_cell_extract.jpeg" alt="Adjusting the detection limit"></a> | ||
| + | <figcaption>Figure 7: Influence of different mercury concentrations on our crude cell extract. Error bars represent the standard deviation of three biological replicates.</figcaption> | ||
| + | </figure> | ||
| + | |||
| + | <!--<figure style="width: 600px"> | ||
| + | <a href="https://static.igem.org/mediawiki/2015/1/1e/Bielefeld-CeBiTec_Abnahme_unter_Hg.jpeg" data-lightbox="heavymetals" data-title="TEXT Error bars represent the standard deviation of three biological replicates."><img src="https://static.igem.org/mediawiki/2015/1/1e/Bielefeld-CeBiTec_Abnahme_unter_Hg.jpeg" alt="Adjusting the detection limit"></a> | ||
| + | <figcaption>Influence of different mercury concentrations on our crude cell extract. Error bars represent the standard deviation of three biological replicates.</figcaption> | ||
| + | </figure>--> | ||
| + | |||
| + | |||
| + | |||
| + | |||
| + | <div class="row"> | ||
| + | <div class="col-md-6 text-center" style="margin-bottom: 50px"> | ||
| + | <figure style="width: 600px"> | ||
| + | <a href="https://static.igem.org/mediawiki/2015/7/7f/Bielefeld-CeBiTec_induction_mercury_in_merR_cell-extract.jpeg" data-lightbox="heavymetals" data-title="Figure 8: Mercury specific cell extract made from E. coli cells, which have already expressed the activator before cell extract production. Induction of mercury inducible promoter without T7 in front of the operator site with different mercury concentrations. Error bars represent the standard deviation of three biological replicates. "><img src="https://static.igem.org/mediawiki/2015/7/7f/Bielefeld-CeBiTec_induction_mercury_in_merR_cell-extract.jpeg" alt="Adjusting the detection limit"></a> | ||
| + | <figcaption>Figure 8: Mercury specific cell extract made from E. coli cells, which have already expressed the activator before cell extract production. Induction of mercury inducible promoter without T7 in front of the operator site with different mercury concentrations. Error bars represent the standard deviation of three biological replicates. </figcaption> | ||
| + | </figure> | ||
| + | </div> | ||
| + | <div class="col-md-6 text-center" style="margin-bottom: 50px"> | ||
| + | <figure style="width: 600px"> | ||
| + | <a href="https://static.igem.org/mediawiki/2015/f/f9/Bielefeld-CeBiTec_correction_induction_mercury_in_merR_cell-extract.jpeg" data-lightbox="heavymetals" data-title="TEXT Error bars represent the standard deviation of three biological replicates."><img src="https://static.igem.org/mediawiki/2015/f/f9/Bielefeld-CeBiTec_correction_induction_mercury_in_merR_cell-extract.jpeg" alt="Adjusting the detection limit"></a> | ||
| + | <figcaption>Figure 9: Mercury specific cell extract made from <i>E. coli</i> cells, which have already expressed the activator before cell extract production. Induction of mercury inducible promoter without T7 in front of the operator site with different mercury concentrations. Error bars represent the standard deviation of three biological replicates. </figcaption> | ||
| + | </figure> | ||
| + | </div> | ||
| + | </div> | ||
| + | |||
| + | <p><i>In vitro</i> this sensor showed good results. The fluorescence level was high at low concentrations. Additionally, it showed that the expression level at 6 µg/L (Guideline of WHO for Mercury) reached the maximal signal. This result indicated the potential for measurement of concentrations under 6 µg/L.To confirm this hypothesis, it takes more experiments and tests with lower concentrations. Due to the high expression of sfGFP at low concentrations and the same expression level at different concentrations, it is not possible to quantify mercury with CFPS analyses . , Our model predicted this observation. During the measurement we noticed that the heavy metals have negative influences on the cell extract. Because of this fact, we used a correction factor, which resulted from the heavy metals influence on the CFPS system. This already optimized sensor showed the high potential of optimized sensors in CFPS.</p> | ||
Revision as of 03:37, 19 September 2015
Mercury repressor under control of constitutive promoter and strong RBS
Repressor of the mercurry responsive promoter MerT under the control of konstitutive Promoter (K608002)
Sequence and Features
- 10COMPATIBLE WITH RFC[10]
- 12INCOMPATIBLE WITH RFC[12]Illegal NheI site found at 462
Illegal NheI site found at 485 - 21COMPATIBLE WITH RFC[21]
- 23COMPATIBLE WITH RFC[23]
- 25COMPATIBLE WITH RFC[25]
- 1000COMPATIBLE WITH RFC[1000]
in vitro
For the characterization of the mercury sensor with CFPS we used parts differing from that we used in the in vivo characterization. For the in vitro characterization we used a cell extract out of cells, which contained the plasmid (<a href="https://parts.igem.org/Part:BBa_K1758340" target="_blank"> BBa_K1758340</a>)(figure 5). In addition, we added plasmid DNA to the cell extract. This plasmid consisted of the mercury specific promoter pmerT with 5’-UTR-sfGFP. The entire sequence was placed under the control of of T7-promoter (<a href="https://parts.igem.org/Part:BBa_K1758344" target="_blank"> BBa_K1758344</a>)(figure 6). The T7-promoter is needed to get a better fluorescence expression.
<a href="" data-lightbox="heavymetals" data-title=" Figure 5: To produce the cell extract for in vitro characterization a construct (BBa_K1758340 ) with chromium repressor under the control of a constitutive promoter and strong RBS. " alt="repressor construct used for in vivo characterization."><img src="
</figure>
<a href="" data-lightbox="heavymetals" data-title="T7-PmerT-UTR-sfGFP used forin vitro characterization."
</figure>
<figure style="width: 600px">
<a href=" " data-lightbox="heavymetals" data-title="Figure 7: Influence of different mercury concentrations on our crude cell extract. Error bars represent the standard deviation of three biological replicates. "><img src="" alt="Adjusting the detection limit"></a>
<figcaption>Figure 7: Influence of different mercury concentrations on our crude cell extract. Error bars represent the standard deviation of three biological replicates.</figcaption>
</figure>
" data-lightbox="heavymetals" data-title="Figure 7: Influence of different mercury concentrations on our crude cell extract. Error bars represent the standard deviation of three biological replicates. "><img src="" alt="Adjusting the detection limit"></a>
<figcaption>Figure 7: Influence of different mercury concentrations on our crude cell extract. Error bars represent the standard deviation of three biological replicates.</figcaption>
</figure>
<figure style="width: 600px">
<a href=" " data-lightbox="heavymetals" data-title="Figure 8: Mercury specific cell extract made from E. coli cells, which have already expressed the activator before cell extract production. Induction of mercury inducible promoter without T7 in front of the operator site with different mercury concentrations. Error bars represent the standard deviation of three biological replicates. "><img src="" alt="Adjusting the detection limit"></a>
<figcaption>Figure 8: Mercury specific cell extract made from E. coli cells, which have already expressed the activator before cell extract production. Induction of mercury inducible promoter without T7 in front of the operator site with different mercury concentrations. Error bars represent the standard deviation of three biological replicates. </figcaption>
</figure>
" data-lightbox="heavymetals" data-title="Figure 8: Mercury specific cell extract made from E. coli cells, which have already expressed the activator before cell extract production. Induction of mercury inducible promoter without T7 in front of the operator site with different mercury concentrations. Error bars represent the standard deviation of three biological replicates. "><img src="" alt="Adjusting the detection limit"></a>
<figcaption>Figure 8: Mercury specific cell extract made from E. coli cells, which have already expressed the activator before cell extract production. Induction of mercury inducible promoter without T7 in front of the operator site with different mercury concentrations. Error bars represent the standard deviation of three biological replicates. </figcaption>
</figure>
<figure style="width: 600px">
<a href="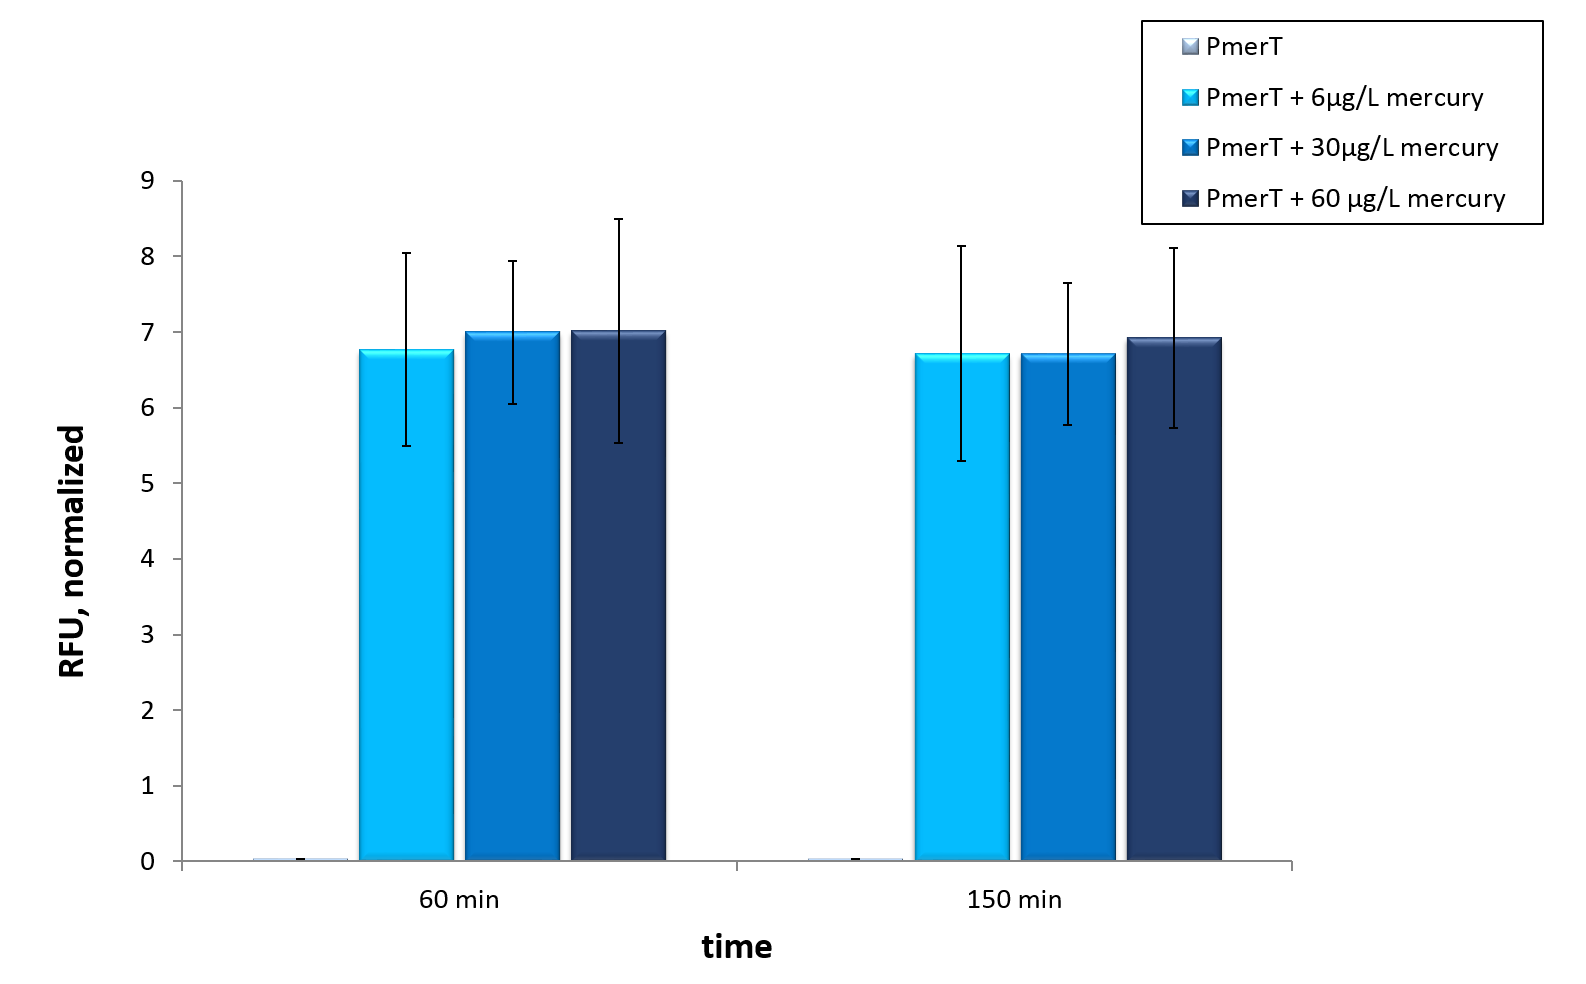 " data-lightbox="heavymetals" data-title="TEXT Error bars represent the standard deviation of three biological replicates."><img src="" alt="Adjusting the detection limit"></a>
<figcaption>Figure 9: Mercury specific cell extract made from E. coli cells, which have already expressed the activator before cell extract production. Induction of mercury inducible promoter without T7 in front of the operator site with different mercury concentrations. Error bars represent the standard deviation of three biological replicates. </figcaption>
</figure>
" data-lightbox="heavymetals" data-title="TEXT Error bars represent the standard deviation of three biological replicates."><img src="" alt="Adjusting the detection limit"></a>
<figcaption>Figure 9: Mercury specific cell extract made from E. coli cells, which have already expressed the activator before cell extract production. Induction of mercury inducible promoter without T7 in front of the operator site with different mercury concentrations. Error bars represent the standard deviation of three biological replicates. </figcaption>
</figure>
In vitro this sensor showed good results. The fluorescence level was high at low concentrations. Additionally, it showed that the expression level at 6 µg/L (Guideline of WHO for Mercury) reached the maximal signal. This result indicated the potential for measurement of concentrations under 6 µg/L.To confirm this hypothesis, it takes more experiments and tests with lower concentrations. Due to the high expression of sfGFP at low concentrations and the same expression level at different concentrations, it is not possible to quantify mercury with CFPS analyses . , Our model predicted this observation. During the measurement we noticed that the heavy metals have negative influences on the cell extract. Because of this fact, we used a correction factor, which resulted from the heavy metals influence on the CFPS system. This already optimized sensor showed the high potential of optimized sensors in CFPS.