Difference between revisions of "Part:BBa K1689002"
| Line 7: | Line 7: | ||
[[File:Peking-Part-C398-STV.png]]<br/> | [[File:Peking-Part-C398-STV.png]]<br/> | ||
| − | '''Figure 1''' Schematic cartoon of | + | '''Figure 1''' Schematic cartoon of C-Fluc398-STV fusion protein. |
==Expression and purification== | ==Expression and purification== | ||
| Line 14: | Line 14: | ||
[[File:C398-STV-gel.png]]<br/> | [[File:C398-STV-gel.png]]<br/> | ||
| − | '''Figure 2''' SDS-PAGE of the purified | + | '''Figure 2''' SDS-PAGE of the purified C-Fluc398-STV fusion protein. |
==Characterization== | ==Characterization== | ||
Revision as of 21:05, 18 September 2015
Coding sequence of Cluc-STV
Design
Peking iGEM 2015 combines the homotetrameric streptavidin (STV) protein with the C terminal domain of firefly luciferase to through a GGGGSGGGGS linker. Biotin-STV interaction is one of the strongest noncovalent interactions in the nature, and is frequently applied as a simple approach to generate semisynthetic DNA-protein conjugates. [1] Split luciferase is particularly useful as split bioluminescence reporter for studying protein-protein interaction. [2] In our dual molecular beacons (MB) detecting system, the fusion protein was incubated with biotinylated MB. And when two parts of split luciferase get closed to each other, they will catalyze the luciferin oxidation to produce luminescence signal that could be detected by microplate reader.

Figure 1 Schematic cartoon of C-Fluc398-STV fusion protein.
Expression and purification
This part was constructed on pET28a backbone, placed under T7 promotor and lac operator. Then the recombinant plasmid was transformed into E.coli BL21 strain. However, during protein expression and purification we found that most of the fusion proteins are insoluble in the cell. The inclusion bodies were isolated and then dissolved in 6 mol/L granidine hydrochloride, following by refolding via dilution into pH 8.0 Tris buffer. [3] SDS-PAGE showed the high expression level and high purity of protein.
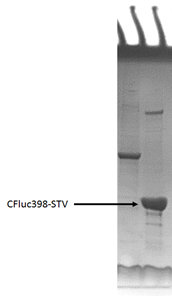
Figure 2 SDS-PAGE of the purified C-Fluc398-STV fusion protein.
Characterization
The purified proteins were incubated, respectively, with one of the biotinylated MB, to synthesize the MB.
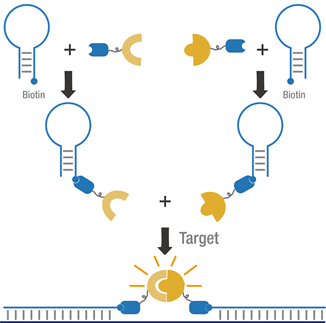
Figure 3 Schematic of dual MB system.
We verified the newly synthesized MBs by applying them to targeting a commonly mutated region of the K-ras gene involved in many cancers (the DNA was prepared by PCR amplification). To find out an appropriate test condition with a high signal-to-background ratio, we first determined the appropriate concentration of each protein and MB; then the signals generated at different concentrations of DNA or RNA target were also examined.
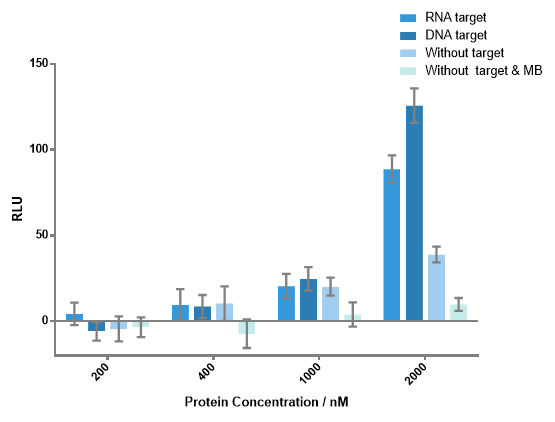
Figure 4 Luminescence signals produced by different concentrations of each fusion protein with or without DNA or RNA target. When concentration of any fusion protein was lower than 1000 nM, there was no significant difference between the experiment group and the control group. Notable signals of experiment groups were detected when each protein concentration is 2000 nM. Signal-to-background ratio of 3.23 as the result of DNA target, 2.28 as the result of RNA target were obtained. DNA or RNA target concentration, 100 nM; each MB concentration, 400 nM.
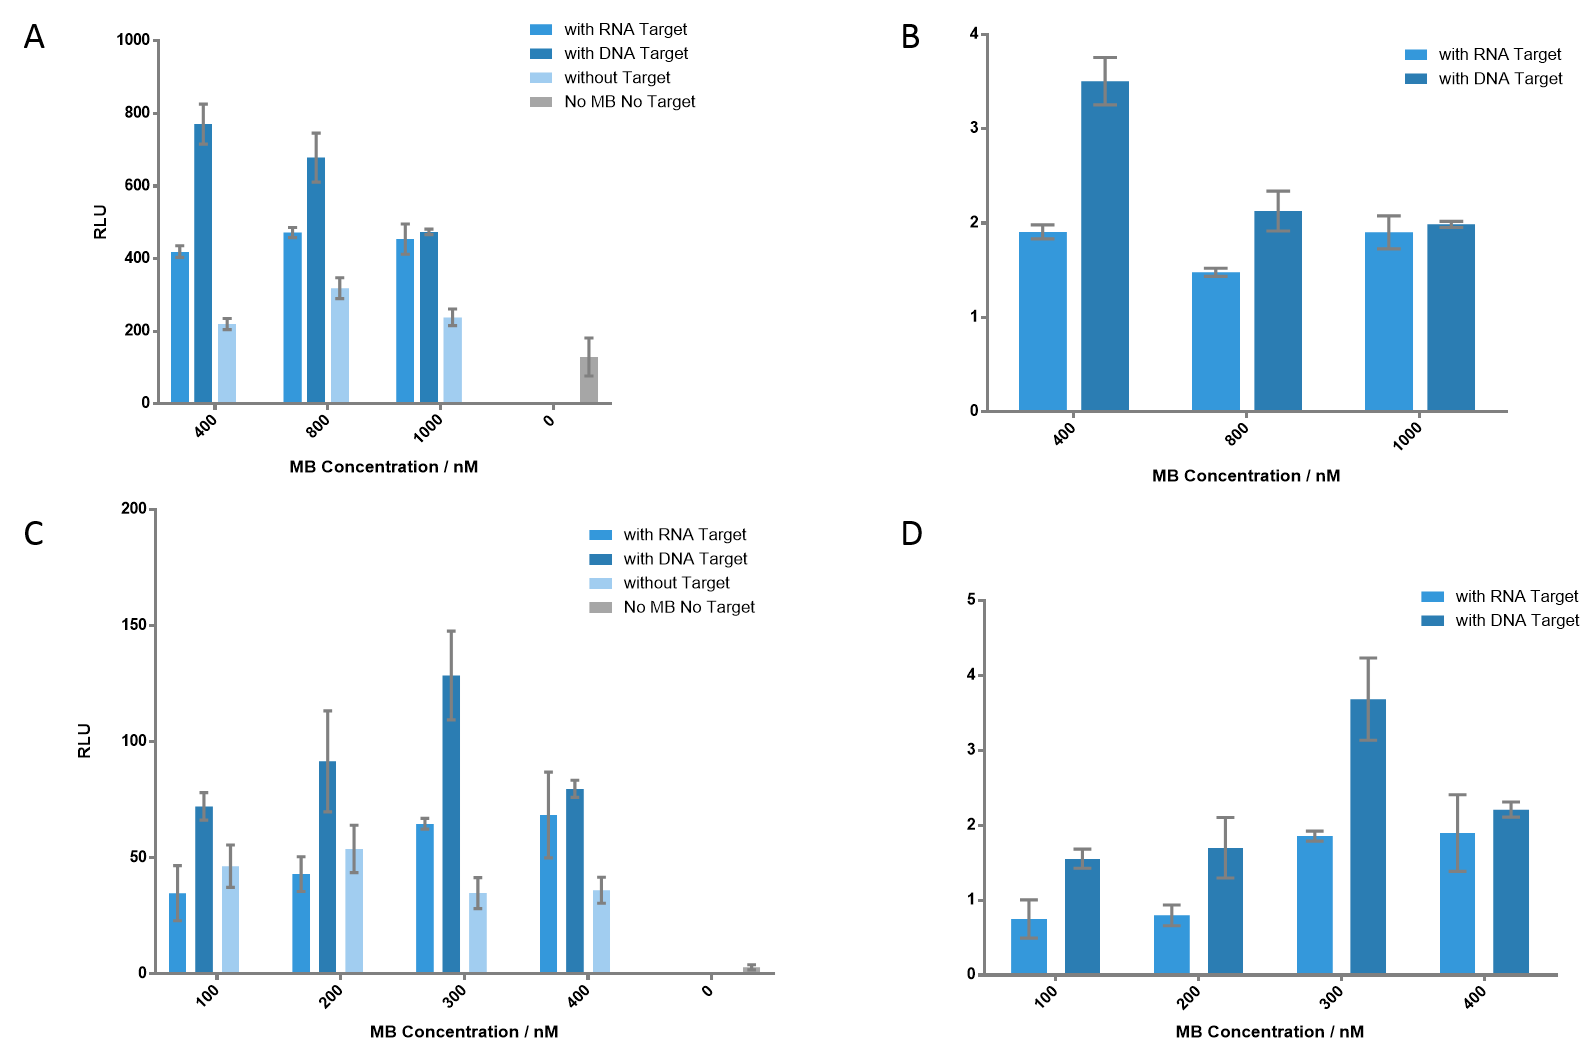
Figure 5 Detection of the luminescence signals at different concentrations of each MB. (A) Each MB concentration varies from 400 nM to 1000 nM. As MB concentration gets higher, the signal of DNA target gets lower; however, the signal of RNA target gets higher, which indicates that higher concentration of MB is appreciated when detecting RNA target. The signal-to-background ratios are presented in (B). (C) Each MB concentration varied from 100 nM to 400 nM. 300 nM of each MB generated the most significant signal when detecting DNA target, which gave a ratio of 3.69. (D) The ratio of each group. Nucleic acid concentration was 100 nM for DNA or RNA.

Figure 6 Detection of the signals using different target concentrations. The highest signals were detected when target concentration is 200 nM at each cases; the ratio is 7.07 for DNA target, 4.52 for RNA target. Even when the target concentration is only 10 nM, there was still significant difference compared to the control group; the ratio is 4.42 for DNA target, 3.12 for RNA target.
We then created target sequences with a gap size ranging from 0 to 15 nucleotides and investigated their effect on the enzymatic reactions.
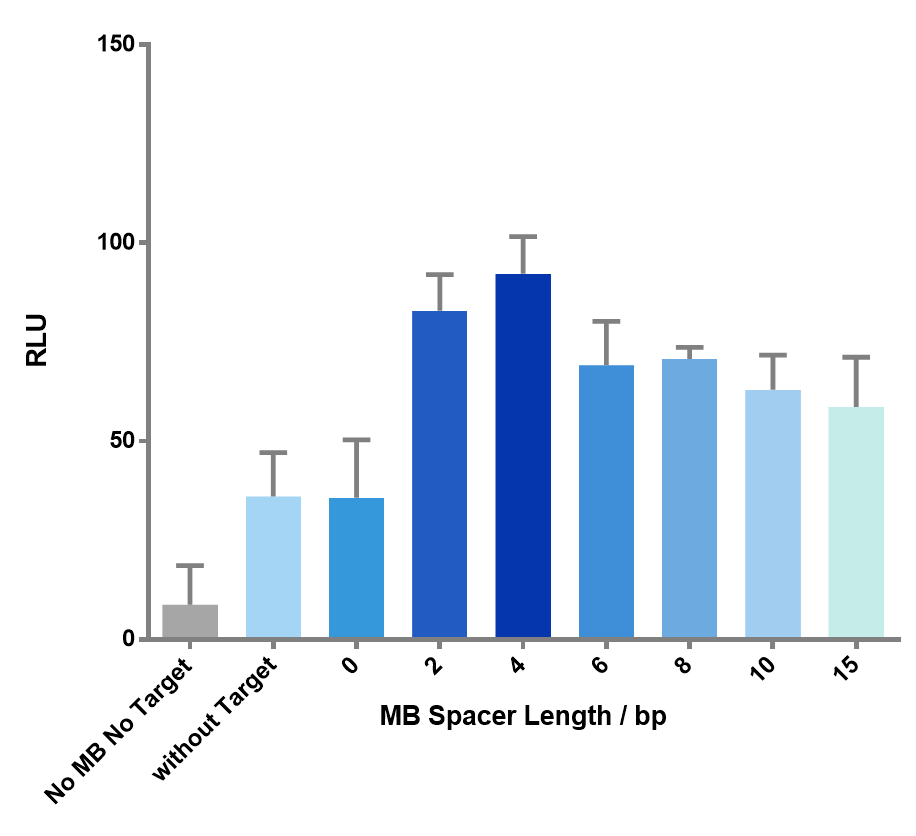
Figure 7 The effect of spacer length on the luminescence signal. As the spacer length gets longer, the signal goes through an up-and-down process, which precisely matches our expectation. Spacer length of 4bp gave the highest signal.
Reference
[1] Niemeyer C M. Semisynthetic DNA–protein conjugates for biosensing and nanofabrication[J]. Angewandte Chemie International Edition, 2010, 49(7): 1200-1216.
[2] Paulmurugan R, Gambhir S S. Combinatorial library screening for developing an improved split-firefly luciferase fragment-assisted complementation system for studying protein-protein interactions[J]. Analytical chemistry, 2007, 79(6): 2346-2353.
[3] Sano T, Cantor C R. Expression of a cloned streptavidin gene in Escherichia coli[J]. Proceedings of the National Academy of Sciences, 1990, 87(1): 142-146.
Sequence and Features
- 10COMPATIBLE WITH RFC[10]
- 12COMPATIBLE WITH RFC[12]
- 21INCOMPATIBLE WITH RFC[21]Illegal BamHI site found at 4
- 23COMPATIBLE WITH RFC[23]
- 25INCOMPATIBLE WITH RFC[25]Illegal NgoMIV site found at 285
Illegal AgeI site found at 424 - 1000COMPATIBLE WITH RFC[1000]
