Difference between revisions of "Part:BBa K1383001"
| Line 35: | Line 35: | ||
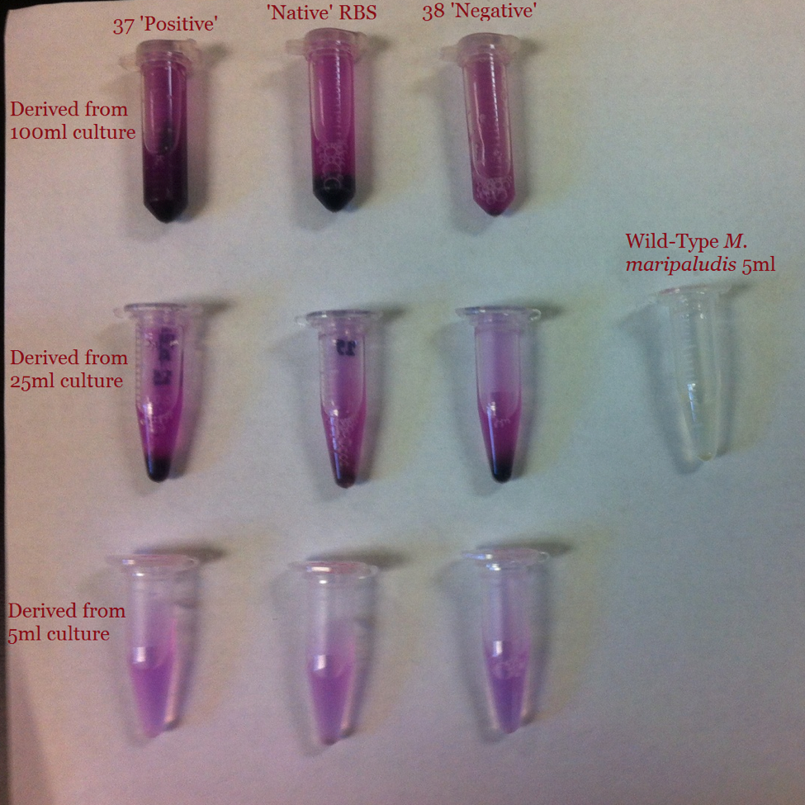
Since mCherry fluorescence is visible to the naked eye, visualization of mCherry after oxygen exposure is our qualitative analysis. The columns in figure 4 represent 37 'positive' (the part documented on this page), native RBS, and 38 'negative', respectively. A close look would show that 37 'positive' looks the brightest, followed by 38 'negative', then the native RBS. Note on the right side of the picture a tube that contains wild-type <i>M. maripaludis</i> that also went through oxygen exposure. | Since mCherry fluorescence is visible to the naked eye, visualization of mCherry after oxygen exposure is our qualitative analysis. The columns in figure 4 represent 37 'positive' (the part documented on this page), native RBS, and 38 'negative', respectively. A close look would show that 37 'positive' looks the brightest, followed by 38 'negative', then the native RBS. Note on the right side of the picture a tube that contains wild-type <i>M. maripaludis</i> that also went through oxygen exposure. | ||
| − | [[Image:MCherry-Visualization.png|none|500px|thumb|<b>UGA-Georgia 2014</b> Figure 4: Visualization of mCherry after 20h of oxygen exposure. The part described on this page, | + | [[Image:MCherry-Visualization.png|none|500px|thumb|<b>UGA-Georgia 2014</b> Figure 4: Visualization of mCherry after 20h of oxygen exposure. The part described on this page, 37 'positive', is shown in the middle column.]] |
'''Quantitative Analysis''' | '''Quantitative Analysis''' | ||
Revision as of 01:50, 28 October 2014
BBa_K1383001 (mCherry- Theoretical strongest RBS)
Usage and Biology
The ribosome binding sites (RBS) of archaea are not well characterized. By creating and characterizing a library of RBS sequences, researchers will be able to express proteins of interest at variable levels of expression in Methanococcus maripaludis. Ribosome binding sites are typically 6-7 base pair sequences on a transcript that is complementary to the 3’ end of the 16S rRNA. After binding of the RBS to the ribosome, translation will be initiated. An RBS with higher affinity for the ribosome will result in higher rate of translation, and inversely, an RBS with lower affinity will result in lower rate of translation.
Characterization
Characterization of the RBS sequences was accomplished using the red fluorescent protein, mCherry as a reporter. Qualitative analysis was evaluated by visualization of the RFP and quantitative analysis was completed through use of a plate reader for reading fluorescence.
The Construct for Characterizing a Library of Ribosome Binding Site Sequences
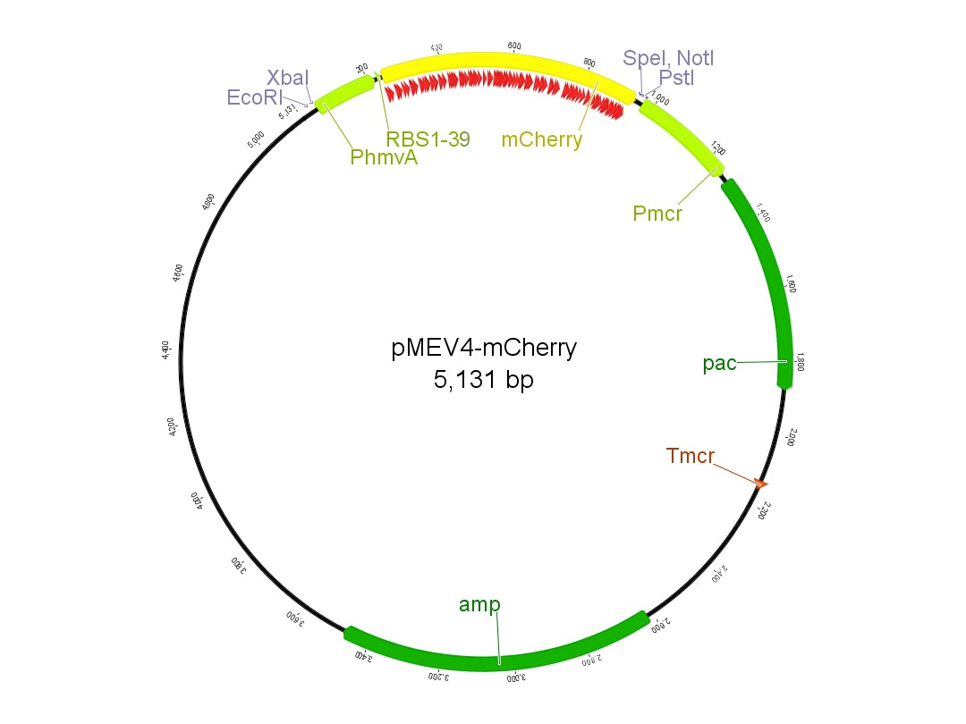
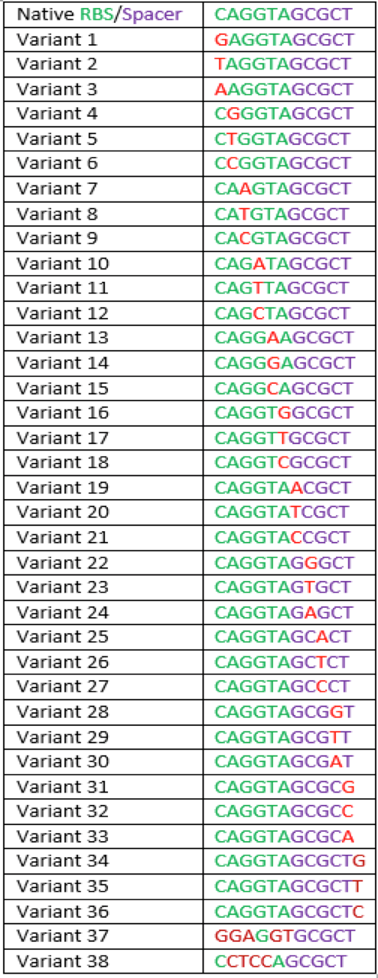
The region labeled 'RBS 1-39' in the pMEV4-mCherry vector (figure 1) is the site immediately upstream of the mCherry gene that will be subject to variation. Specifically, we will be mutating the 6 base pairs of the RBS, the 5 of the spacer, and the first base of the start codon. We begin with the 'native' RBS (BBa_K1383000), which is a known functional RBS sequence in methanogens and is typically used for creating synthetic parts. The RBS variants are created by making mutations on only one base at a time for every nucleotide different from the native (figure 2). We designed two additional RBS sequences based off the 16S rRNA data for M. maripaludis, termed theoretical 'perfect' and 'negative' (figure 2, (#37 shown on this page) & #38, BBa_K1383001 & BBa_K1383002, respectively). These RBS sequences were designed to have the theoretical greatest and worst possible affinities for the 16S ribosome. Figure 3 illustrates the specific sequence for the part described on this page, the 'native' RBS.
Development of a Novel RFP Characterization Protocol in Methanogens
Running samples of fresh cultures resulted in inconsistent, unreproducible values of fluorescence. We discovered and addressed two main issues; 1) We removed resazurin from the broth-medium and 2) developed a novel protocol for oxygen exposure to mature the mCherry fluorophore.
Resazurin is an oxidation-reduction indicator which is commonly used in broth-mediums for obligate anaerobes because when resazurin is reduced, for example by oxygen, it turns a pink color which visually indicates to researchers that oxygen accidentally got into a culture. To run samples through a plate reader, we obviously had to take them out of their anaerobic culture and put them on a plate, which led to the reduction of resazurin and the false positives and large inconsistencies in characterization. This was a simple fix, since resazurin isn't required for growth, we made broth-medium that didn't contain resazurin and took extra caution to ensure no oxygen got into any cultures.
Many fluorescent proteins, including mCherry, require oxygen for the full maturation of the fluorophore. Since mCherry is being produced here in an obligate anaerobe, mCherry never had exposure to oxygen. We developed a novel protocol for oxygen exposure for maturation of the mCherry fluorophore produced in M. maripaludis cultures. This process, which may be found in full detail [http://2014.igem.org/Team:UGA-Georgia/Protocols here], briefly involves separating the cells, resuspending them in non-lysis buffer, and leave them in a shaker overnight. After around 20 hours of oxygen exposure, we observe visualization of mCherry (figure 4).
Qualitative Analysis
Since mCherry fluorescence is visible to the naked eye, visualization of mCherry after oxygen exposure is our qualitative analysis. The columns in figure 4 represent 37 'positive' (the part documented on this page), native RBS, and 38 'negative', respectively. A close look would show that 37 'positive' looks the brightest, followed by 38 'negative', then the native RBS. Note on the right side of the picture a tube that contains wild-type M. maripaludis that also went through oxygen exposure.
Quantitative Analysis
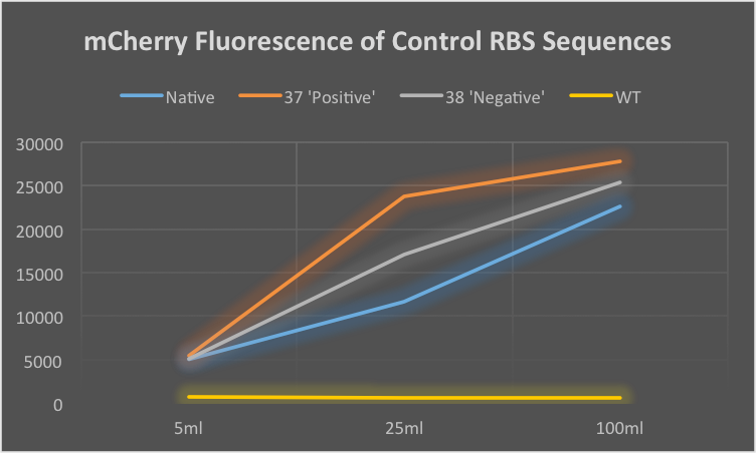
A plate reader was used to evaluate quantitative values for the fluorescence of mCherry in M. maripaludis cultures. The graph in figure 5 depicts the values obtained from running our samples of 37 'positive' (the part documented on this page), native RBS, and 38 'negative', which were derived from culture volumes of 5ml, 25ml, and 100ml. Triplicates of every sample were run and the values shown in the graph are the mean average of the triplicates.
Sequence and Features
- 10COMPATIBLE WITH RFC[10]
- 12COMPATIBLE WITH RFC[12]
- 21COMPATIBLE WITH RFC[21]
- 23COMPATIBLE WITH RFC[23]
- 25COMPATIBLE WITH RFC[25]
- 1000COMPATIBLE WITH RFC[1000]


