Difference between revisions of "Part:BBa K122010:Experience"
| Line 1: | Line 1: | ||
| − | |||
__NOTOC__ | __NOTOC__ | ||
This experience page is provided so that any user may enter their experience using this part.<BR>Please enter | This experience page is provided so that any user may enter their experience using this part.<BR>Please enter | ||
how you used this part and how it worked out. | how you used this part and how it worked out. | ||
| + | |||
| + | == Characterizaion data from Uppsala igem 2013== | ||
| + | |||
| + | |||
| + | '''Summary''' | ||
| + | This enzyme was cloned out from a template with pcr provided from conrado.et.al[3] | ||
| + | |||
| + | Although we managed to clone out and sequence verify the genes for resveratrol production, we have had some problems in the characterization. The results are unclear, and we did not have time for further investigations. | ||
| + | |||
| + | '''Biobrick''' | ||
| + | |||
| + | We managed to biobrick and sequence verify this part. | ||
| + | |||
| + | '''Western blot''' | ||
| + | |||
| + | We also succeeded in expressing the enzyme stilbene synthase in E. coli. Our expression of the protein was however very weak, and due to time constraints we were not able to optimize our experiment. | ||
| + | |||
| + | To enable the detection of this protein by anti-his antibodies, 6-histidine tags was incorporated in the sequence. | ||
| + | |||
| + | We expressed our protein with a promotor working in both lactobacillus and e-coli. This way, you can easily transfer stilbene synthase to lactobacillus later on. | ||
| + | |||
| + | The size of our protein was calculated using ProtParam [5], 43 kDA. | ||
| + | |||
| + | |||
| + | https://static.igem.org/mediawiki/2013/3/39/Resv_westblot_uppsala.png | ||
| + | |||
| + | ''Figure 1:Number 2 shows a very weak band of our protein at around 43 kDA. | ||
| + | Positive control -> 1, Stilbene synthase -> 2'' | ||
| + | |||
| + | |||
| + | |||
| + | '''High pressure liquid chromatography''' | ||
| + | |||
| + | We tested our biobrick 4Cl-STS on HPLC, by adding p-coumaric acid as a precursor. The result we saw was quite unclear. We saw that the e-coli produced something out of the ordinary, but the absorbation was low and the peaks did not exactly match the standard. The peak at around ~33 min could correspond to our standard, but it is unclear. We theorize it is something in the actual hplc measurement that fails, or that something happens to our resveratrol metabolite in our e-coli. This result could correspond to the poor results in our blot. We hope that iGEM teams can continue to work on these biobricks in the future. | ||
| + | |||
| + | |||
| + | https://static.igem.org/mediawiki/2013/d/dc/Resva_uppsala_tab1.png | ||
| + | |||
| + | ''Figure 2: E. coli supposed to produce resveratrol. As we can see, we got very low absorbance peaks at ~30 min, ~33 min and ~36 min.'' | ||
| + | |||
| + | |||
| + | |||
| + | https://static.igem.org/mediawiki/2013/3/33/Resva_uppsala_tab2.png | ||
| + | |||
| + | ''Figure 3: Resveratrol standard, peaks around ~33, ~34 min.'' | ||
| + | |||
| + | |||
| + | https://static.igem.org/mediawiki/2013/8/82/Resva_uppsala_tab3.png | ||
| + | |||
| + | ''Figure 4: Resveratrol standard that is scaled down to correspond to the absorbations of our e. coli supposed to produce the corresponding metabolite. The peaks are at around ~33 and ~34.'' | ||
| + | |||
| + | |||
| + | |||
| + | https://static.igem.org/mediawiki/2013/4/4f/Uppsala_char_coumaric-acid_blank.png | ||
| + | |||
| + | ''Figure 5: E. coli culture injected to the hplc without our biobrick tyrosine ammonia lyase. Here we can see that there is originally no peaks around 30-35 minutes. | ||
| + | '' | ||
| + | |||
| + | '''References''' | ||
| + | |||
| + | [1] Sinclair, D. A & Baur, Y, A. Therapeutic potential of resveratrol: the in vivo evidence. Nature 506 | JUNE 2006 | VOLUME 5 | ||
| + | |||
| + | [2] Baur, Y, A. et al. Resveratrol improves health and survival of mice on a high-calorie diet. Nature Vol 444| 16 November 2006 | ||
| + | |||
| + | [3] Robert J. Conrado et al, DNA guided assembly of biosynthetic pathways promotes improved catalytic effiency. Nucleic Acids Research , 2012, Vol 40 NO 4, 1879-1889 | ||
| + | |||
===Applications of BBa_K122010=== | ===Applications of BBa_K122010=== | ||
Latest revision as of 19:51, 4 October 2013
This experience page is provided so that any user may enter their experience using this part.
Please enter
how you used this part and how it worked out.
Characterizaion data from Uppsala igem 2013
Summary This enzyme was cloned out from a template with pcr provided from conrado.et.al[3]
Although we managed to clone out and sequence verify the genes for resveratrol production, we have had some problems in the characterization. The results are unclear, and we did not have time for further investigations.
Biobrick
We managed to biobrick and sequence verify this part.
Western blot
We also succeeded in expressing the enzyme stilbene synthase in E. coli. Our expression of the protein was however very weak, and due to time constraints we were not able to optimize our experiment.
To enable the detection of this protein by anti-his antibodies, 6-histidine tags was incorporated in the sequence.
We expressed our protein with a promotor working in both lactobacillus and e-coli. This way, you can easily transfer stilbene synthase to lactobacillus later on.
The size of our protein was calculated using ProtParam [5], 43 kDA.

Figure 1:Number 2 shows a very weak band of our protein at around 43 kDA. Positive control -> 1, Stilbene synthase -> 2
High pressure liquid chromatography
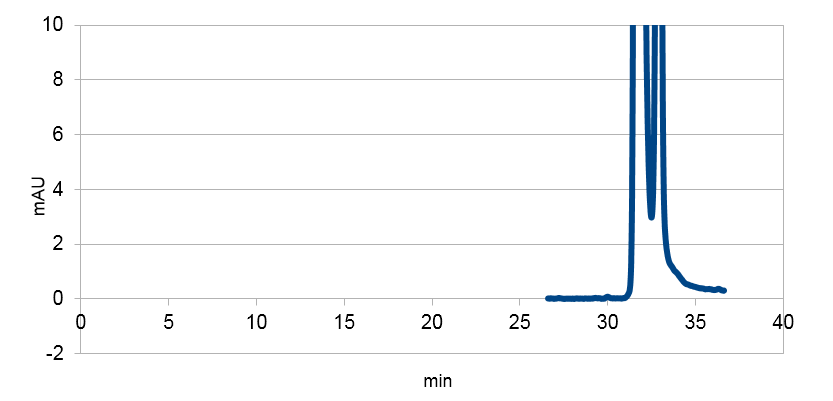
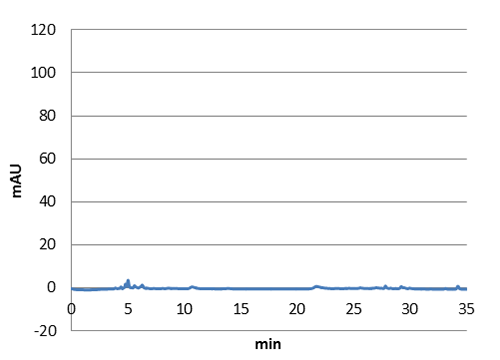
We tested our biobrick 4Cl-STS on HPLC, by adding p-coumaric acid as a precursor. The result we saw was quite unclear. We saw that the e-coli produced something out of the ordinary, but the absorbation was low and the peaks did not exactly match the standard. The peak at around ~33 min could correspond to our standard, but it is unclear. We theorize it is something in the actual hplc measurement that fails, or that something happens to our resveratrol metabolite in our e-coli. This result could correspond to the poor results in our blot. We hope that iGEM teams can continue to work on these biobricks in the future.

Figure 2: E. coli supposed to produce resveratrol. As we can see, we got very low absorbance peaks at ~30 min, ~33 min and ~36 min.

Figure 3: Resveratrol standard, peaks around ~33, ~34 min.

Figure 4: Resveratrol standard that is scaled down to correspond to the absorbations of our e. coli supposed to produce the corresponding metabolite. The peaks are at around ~33 and ~34.

Figure 5: E. coli culture injected to the hplc without our biobrick tyrosine ammonia lyase. Here we can see that there is originally no peaks around 30-35 minutes.
References
[1] Sinclair, D. A & Baur, Y, A. Therapeutic potential of resveratrol: the in vivo evidence. Nature 506 | JUNE 2006 | VOLUME 5
[2] Baur, Y, A. et al. Resveratrol improves health and survival of mice on a high-calorie diet. Nature Vol 444| 16 November 2006
[3] Robert J. Conrado et al, DNA guided assembly of biosynthetic pathways promotes improved catalytic effiency. Nucleic Acids Research , 2012, Vol 40 NO 4, 1879-1889
Applications of BBa_K122010
User Reviews
UNIQd54c67d0d61bacbc-partinfo-00000000-QINU UNIQd54c67d0d61bacbc-partinfo-00000001-QINU
