
Difference between revisions of "Part:BBa K1028003"
| Line 1: | Line 1: | ||
__NOTOC__ | __NOTOC__ | ||
<partinfo>BBa_K1028003 short</partinfo> | <partinfo>BBa_K1028003 short</partinfo> | ||
| − | + | ==Introduction== | |
<html> | <html> | ||
<img src="http://i276.photobucket.com/albums/kk29/JosephBeetBeet/NEWBS3Image.png" style="width:600px;margin-right:160px" ></a> | <img src="http://i276.photobucket.com/albums/kk29/JosephBeetBeet/NEWBS3Image.png" style="width:600px;margin-right:160px" ></a> | ||
| Line 10: | Line 10: | ||
A fusion of the INP.Si4 complex with the hydrophobic cell stress reporter to create a system capable of detecting silica particles in solution | A fusion of the INP.Si4 complex with the hydrophobic cell stress reporter to create a system capable of detecting silica particles in solution | ||
| − | + | ==Experimental Data Concerning the Binding Domain== | |
====Fluorescent Activated Cell Sorting (FACS) ==== | ====Fluorescent Activated Cell Sorting (FACS) ==== | ||
| Line 38: | Line 38: | ||
Silicate compound forming distinct spheres can be witnessed in the above image. EDX chemical composition data is also included with each image, which allows assessment of the elements that are present in each sample. The high carbon output is partially due to the carbon adhesive used to isolate the samples for SEM. The silicate compound would envelop the cells either fully or partially and this can be gathered from the images shown. The images of control samples exemplify the silicate compound not extensively bound to the cells. | Silicate compound forming distinct spheres can be witnessed in the above image. EDX chemical composition data is also included with each image, which allows assessment of the elements that are present in each sample. The high carbon output is partially due to the carbon adhesive used to isolate the samples for SEM. The silicate compound would envelop the cells either fully or partially and this can be gathered from the images shown. The images of control samples exemplify the silicate compound not extensively bound to the cells. | ||
| + | |||
| + | ==Experimental Data Regarding the Reporter System== | ||
<!-- Add more about the biology of this part here | <!-- Add more about the biology of this part here | ||
Revision as of 16:11, 4 October 2013
Silica Detection System
Introduction
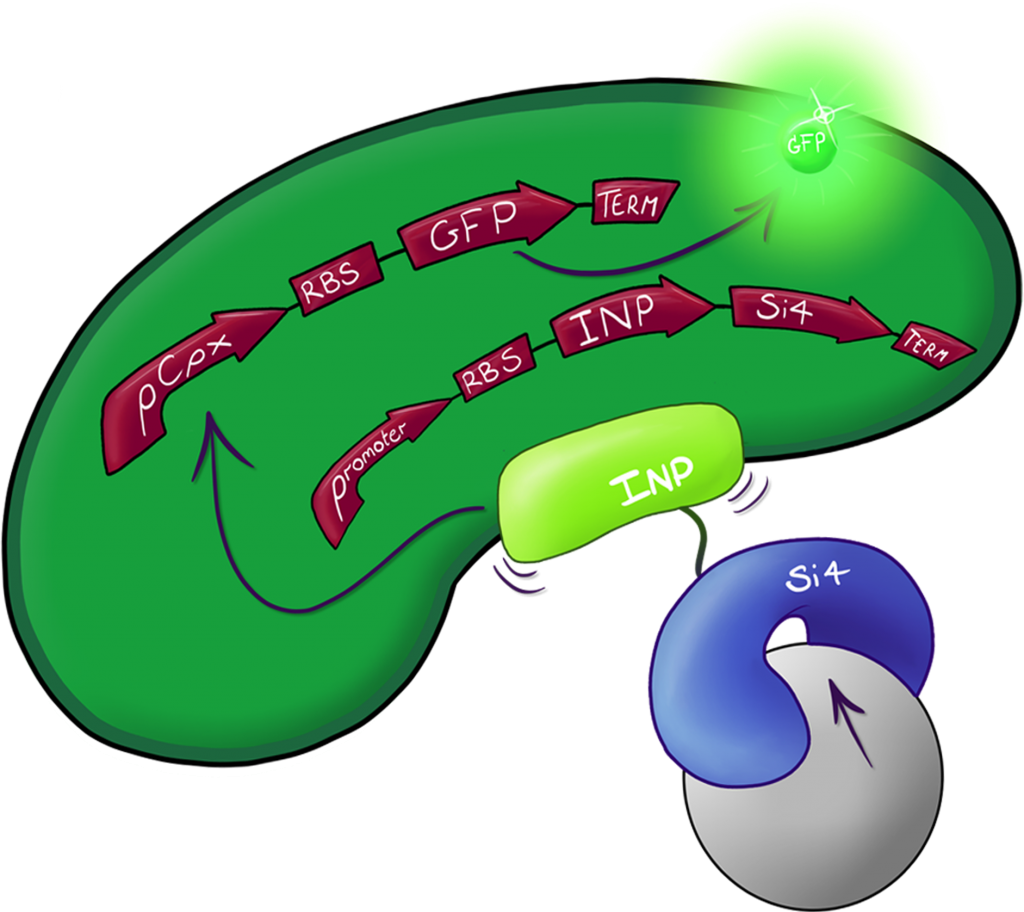
Fig.2: The Culmination of the Leeds 2013 iGEM project, a system capable of both binding and detecting silica particles in solution.
A fusion of the INP.Si4 complex with the hydrophobic cell stress reporter to create a system capable of detecting silica particles in solution
Experimental Data Concerning the Binding Domain
Fluorescent Activated Cell Sorting (FACS)

Fig.2: INP.Si4, labelled here as Device 2 which also contains GFP coding region under the control of the CpxR promoter, characterized using FACS. This data shows successful binding of a small portion of our expression cells to the silica beads used, this result is discussed in more depth below.
Device 2 contains our INP+Si4 construct, along with the Cpx and GFP genes. It was characterized using a flow cytometry method called Fluorescence-activated cell sorting (FACS) in solution with and without beads. The FACS images contain Side scattering and Forward scattering information, relating to relative size and density of the cells.
In the assay containing Device 2 with beads, there was an increase in the percentage of Population 3 (coloured in blue), from 0.1 to 2.2. This is suggestive of representing our Device 2 cells bound to silica beads. In contrast, the assay, which contained only Device 2 cells, had a very insignificant percentage of Population 3 (0.1%).
This suggests that our Device may successfully be binding to the silica beads utilizing the INP+Si4 construct, however not in all cases. This could either be due to not having enough time for the Device to binding to the silica, or that our Si4 binding domain is not as effective as it should be.
Scanning Electron Microscopy Imaging (SEM)
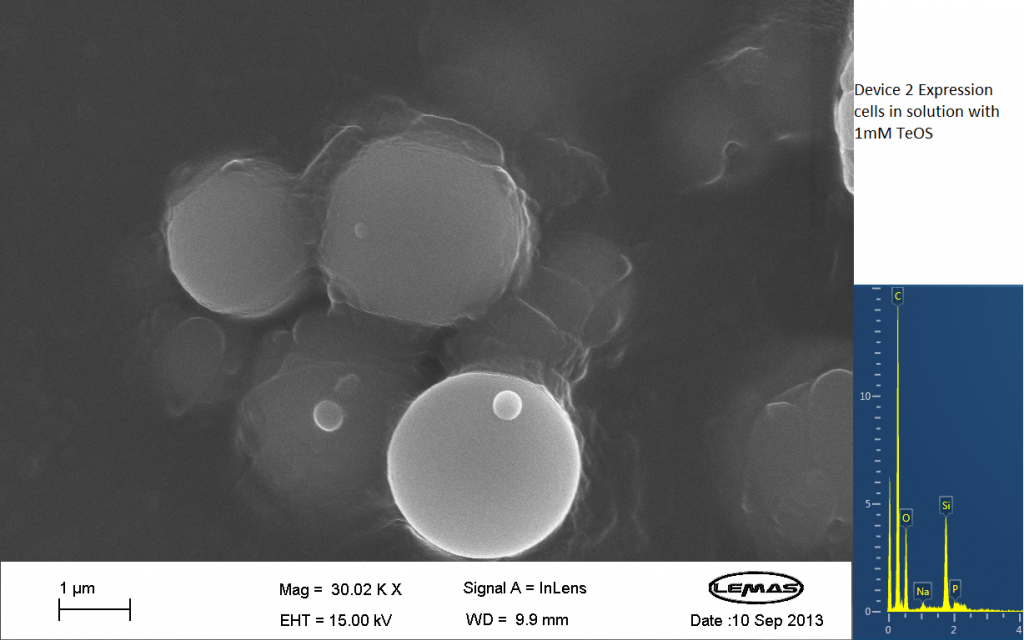
Fig.3 SEM image showing expression cells containing Device 2 in solution with 1mM TeOS.
The image above is an image produced by the Scanning Electron Microscope (SEM) at the University of Leeds. Device 2 was incubated in solution of varying concentrations of a silicate compound, which was solubilized using the sol-gel method from Tetraethyl orthosilicate (TEOS). Samples were incubated at room temperature, as well as some were done at 45ºC. For the control samples, cells without the Device 2 construct gene were used, and did not react with the silicate compound.
Silicate compound forming distinct spheres can be witnessed in the above image. EDX chemical composition data is also included with each image, which allows assessment of the elements that are present in each sample. The high carbon output is partially due to the carbon adhesive used to isolate the samples for SEM. The silicate compound would envelop the cells either fully or partially and this can be gathered from the images shown. The images of control samples exemplify the silicate compound not extensively bound to the cells.
Experimental Data Regarding the Reporter System
Sequence and Features
- 10COMPATIBLE WITH RFC[10]
- 12INCOMPATIBLE WITH RFC[12]Illegal NheI site found at 7
Illegal NheI site found at 30 - 21INCOMPATIBLE WITH RFC[21]Illegal BglII site found at 62
- 23COMPATIBLE WITH RFC[23]
- 25INCOMPATIBLE WITH RFC[25]Illegal NgoMIV site found at 472
- 1000INCOMPATIBLE WITH RFC[1000]Illegal BsaI.rc site found at 1917