Difference between revisions of "Part:BBa J04450:Experience"
(→Team NRP-UEA_Norwich 2013) |
|||
| Line 3: | Line 3: | ||
how you used this part and how it worked out. | how you used this part and how it worked out. | ||
| − | ==Team NRP-UEA_Norwich 2013== | + | ===Team NRP-UEA_Norwich 2013=== |
Our team improved this part by adding an NdeI restriction site in front of the promoter region, upstream of the RFP gene. This means a restriction digest can be performed and the promoter or RFP gene exchanged to a allow further cloning. Please see part <partinfo>BBa_K1041000</partinfo> | Our team improved this part by adding an NdeI restriction site in front of the promoter region, upstream of the RFP gene. This means a restriction digest can be performed and the promoter or RFP gene exchanged to a allow further cloning. Please see part <partinfo>BBa_K1041000</partinfo> | ||
| + | <br> | ||
Our aim was to evaluate RFP expression quantity of E. coli. In order to obtain this information, we agreed that the measurement of fluorescence intensity in certain OD values is the best approach. However, fluorescence quenching was a setback which we must overcome for accurate and reliable results. Because, as a result of quenching, fluorescence intensity counts do not give the actual amount of fluorescence expected from a certain OD value. Therefore we employed a curve fitting method suggested by Zhang et. al (2010) which is claimed to take the quenching problem into consideration | Our aim was to evaluate RFP expression quantity of E. coli. In order to obtain this information, we agreed that the measurement of fluorescence intensity in certain OD values is the best approach. However, fluorescence quenching was a setback which we must overcome for accurate and reliable results. Because, as a result of quenching, fluorescence intensity counts do not give the actual amount of fluorescence expected from a certain OD value. Therefore we employed a curve fitting method suggested by Zhang et. al (2010) which is claimed to take the quenching problem into consideration | ||
<br> | <br> | ||
Revision as of 11:08, 2 October 2013
This experience page is provided so that any user may enter their experience using this part.
Please enter
how you used this part and how it worked out.
Team NRP-UEA_Norwich 2013
Our team improved this part by adding an NdeI restriction site in front of the promoter region, upstream of the RFP gene. This means a restriction digest can be performed and the promoter or RFP gene exchanged to a allow further cloning. Please see part BBa_K1041000
Our aim was to evaluate RFP expression quantity of E. coli. In order to obtain this information, we agreed that the measurement of fluorescence intensity in certain OD values is the best approach. However, fluorescence quenching was a setback which we must overcome for accurate and reliable results. Because, as a result of quenching, fluorescence intensity counts do not give the actual amount of fluorescence expected from a certain OD value. Therefore we employed a curve fitting method suggested by Zhang et. al (2010) which is claimed to take the quenching problem into consideration

Where If is the fluorescence intensity; OD is the cell density; y0 is the offset; A1 is the amplitude; and t1 is the decay constant.
We chose BBa_J04450 for this experiment. And our negative control was again BBa_B0034.
There were nine bacterial concentrations prepared for one to five hours of IPTG induction. (All concentrations were prepared as triplicates.) Then a complete graph of all the induction durations was plotted with the help of the function shown above:

As seen in the graph, fluorescence behaves exactly as expected and does not increase linearly with the increased bacterial concentration. However, IPTG induction effect is clear on fluorescence intensity. (Error bars were too small to be visible.)

Finally, the variables A1 and t1 of the fittings of each induction duration were used to obtain a mean fluorescence intensity (MFI) value:


By conducting this experiment, we were able to characterize RFP expression pattern of the part BBa_J04450 in the host Top Ten. Theoretical mean fluorescence intensity reflects the fluorescence quantum efficiency of the fluorophore RFP, and was found to be unrelated to the cell concentration. Since it is obvious from the results we have obtained that change in the OD does not correlate linearly with the change in the fluorescence intensity. Therefore this model proposes a solution to the unpredictability of the fluorescence amount coming from a certain bacterial population.
The characterization was performed by METU-TURKEY 2010 IGEM TEAM.
Applications of BBa_J04450
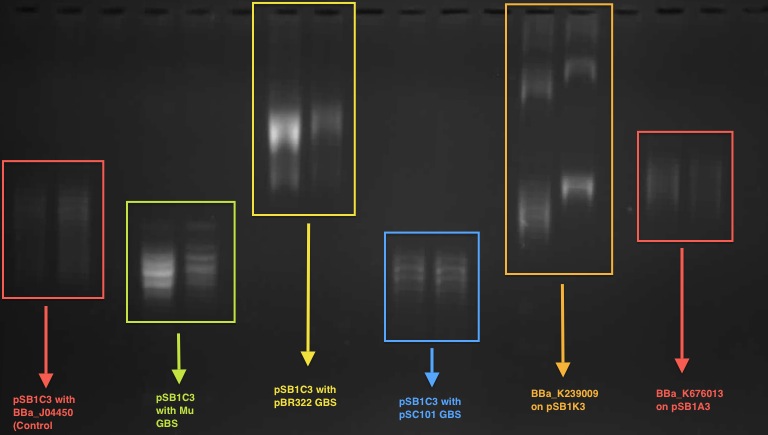
According to our result in the 1D chloroquine gel electrophoresis (at 2.5 μg/mL), the plasmid with the BBa_J04450 (on pSB1C3 backbone) migrated further compared to a plasmid with a known GBS (from pBR322 plasmid - BBa_K676012) on pSB1C£. At the chloroquine concentration which we used, the more negatively supercoiled plasmid will migrate further while the more relaxed molecules will travel slower through the gel.
So this indicates that the device BBa J04450 might have a potential gyrase binding site which facilitates the introduction of negative supercoils into plasmid compared to pBR322 GBS.
This characterisation was carried out by the UCL iGEM team 2011.
Tianjin iGEM 2012
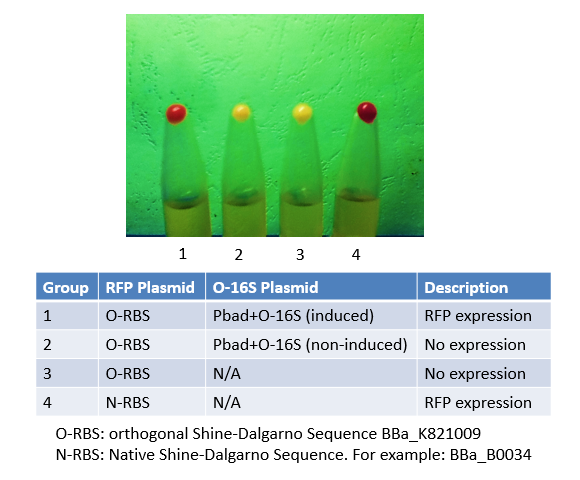
Originally, we used this BioBrick to express RFP in Group 4. We mutated the Shine-Dalgarno sequence of this BioBrick to make an orthogonal counterpart, BBa_K821001. As shown in the image, No. 4 is the product of this BioBrick, and No.1 is the product of its orthogonal counterpart. The results justified both this BioBrick and our BBa_K821001 worked very well, and expressed considerable amount of protein.
Glasgow iGEM 2011
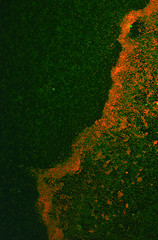
It was found that the Red fluorescence of this protein was not consistently apparent when expressed in biofilm - although some results were observed. Numerous attempts to transform this construct into E. coli Nissle 1917 cells in a biofilm forming assay were unsuccessful, however, the RPF expressed readily into E. coli Nissle 1917 cells when grown on an agar plate.
The antibiotic resistance was still carried across when the culture was inoculated into the biofilm assay indicating that the plasmid was still present. The cultures were shaken at room temperature overnight.
It was thought that the lack of fluorescence was caused by the anoxic conditions generated by the biofilm assay, which may have resulted in poor folding of the chromophore. These results show that RFP is not the most efficient reporter molecule for biofilm, we would recommend something like iLOV, a new biobrick submitted by the Glasgow iGEM team this year [1].
Glasgow iGEM team 2011
Haynes Lab, 2012
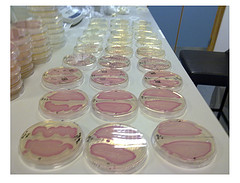
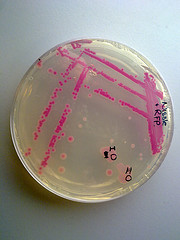
I used BBa_J04450 to demonstrate the expression of RFP in E. coli for a biomedical engineering course at Arizona State University.
- Cells: NEB10B
- Medium: LB Lennox agar, 100 ug/mL ampicillin
- The yellow/green area contains bacteria expressing GFP from BBa_I13522
User Reviews
UNIQb40dcf7e87c07015-partinfo-00000007-QINU
|
•••••
Antiquity |
This review comes from the old result system and indicates that this part worked in some test. |
|
•••••
|
We've used this part as an alternative to the suicide part p1010 (ccdB) for selecting against cells that have been transformed with a [http://ginkgobioworks.com/support/BioBrick_Assembly_Manual.pdf destination plasmid]. It worked perfectly, and if i might say, it looks smashingly in LB medium ;). |
|
•••••
|
We obtained this part from the Spring 2011 distribution plate. It expresses wonderfully in NEB10B cells from New England Biolabs. It does not express well in the fast-growing strain DH5-alpha Turbo, which we've found doesn't express transgenes very well in general. |
UNIQb40dcf7e87c07015-partinfo-0000000B-QINU

