Difference between revisions of "Part:BBa K3832000"
SuperCRISPR (Talk | contribs) (→3. Construction and Verification of aroG Circuit) |
SuperCRISPR (Talk | contribs) (→3. Construction and Verification of aroG Circuit) |
||
| Line 82: | Line 82: | ||
<br> | <br> | ||
Meanwhile, the quantitatively assay by RT-qPCR was also performed to verified its mRNA level. As shown in Fig. 3.2, the transcriptional level was increased about two folds after IPTG induction, indicating the circuit was successfully constructed with functional aroG mutant. The basal expression of aroG without IPTG induction can be observed due to one copy of native aroG in E.coli genome. | Meanwhile, the quantitatively assay by RT-qPCR was also performed to verified its mRNA level. As shown in Fig. 3.2, the transcriptional level was increased about two folds after IPTG induction, indicating the circuit was successfully constructed with functional aroG mutant. The basal expression of aroG without IPTG induction can be observed due to one copy of native aroG in E.coli genome. | ||
| − | <br>[[File:T--XJTU-China--improvement3.1|500px]]<br> | + | <br>[[File:T--XJTU-China--improvement3.1.png|500px]]<br> |
'''''Fig. 3.2''''' ''The relative mRNA level of aroG-S211F in DH5alpha strain with Part:BBa_K3832008 inserted in pET28a+ vector.'' | '''''Fig. 3.2''''' ''The relative mRNA level of aroG-S211F in DH5alpha strain with Part:BBa_K3832008 inserted in pET28a+ vector.'' | ||
Revision as of 19:18, 21 October 2021
aroG (Mutant S211F)
This part encodes a mutant of aroG (3-deoxy-7-phosphoheptulonate synthase, EC 2.5.1.54 ),in which serine at 211 was replaced by phenylalanine. The mutant can relieve the allosteric inhibition of phenylalanine, thus increasing the catalytic rate and downstream product yield.
The enzyme that encoded by the sequence catalyze the following reactions:
phosphoenolpyruvate+D-erythrose 4-phosphate+H2O =3-deoxy-D-arabino-hept-2-ulosonate 7-phosphate +phosphate
Derived from E.coli DH5alpha strain.
Sequence and Features
- 10COMPATIBLE WITH RFC[10]
- 12COMPATIBLE WITH RFC[12]
- 21INCOMPATIBLE WITH RFC[21]Illegal XhoI site found at 934
- 23COMPATIBLE WITH RFC[23]
- 25COMPATIBLE WITH RFC[25]
- 1000COMPATIBLE WITH RFC[1000]
1.Useage & Biology
This part encodes a mutant of aroG (as the improvement of part (BBa_K1060000),it can be expressed in Prokaryote cells, and functionally verified in E.coli DH5alpha strain.
Under physiological conditions, aroG catalyze the reaction phosphoenolpyruvate + D-erythrose 4-phosphate + H2O = 3-deoxy-D-arabino-hept-2-ulosonate 7-phosphate + phosphate. This reaction is a key branching point of the glycolysis and shikimate pathways. Expression of aroG can lead to more substrate into the shikimate pathway, which can improve the yield of downstream products as tryptophan, phenylalanine, tyrosine and benzazole.
In our project, aroG-S211F is used to improve the production of tryptophan. Considering the over-expression of aroG-S211F could significantly reduce the amount of substrate (glucose) entering the glycolysis reaction, in turn affects the normal process of cell proliferation, the expression of aroG is designed under strict control by Toggle-switch circuit (View our design on Team:XJTU-China/Design).
2.Structure
To investigate the mechanism of Phe inhibition on AroG and the effect of point mutation (S211F) in AroG on the PEP catalytic activity of AroG, this issue is proposed to be quantified and visualized using PyMOL, Gaussian16.0W, GaussView6.0, Swiss, AutoDockTools software. Here the effect of this mutation is discussed in structure and binding energy.
2.1 Bingding Energy Prediction
2.1.1 Allosteric inhibition effect of Phe
The average value of the binding energy is obtained by repeating the docking several times. When the Phe ligand is not bound, the binding energy of aroG and PEP is -5.5kcal; and when the Phe is bound to aroG tetramer at the corresponding site, the binding energy becomes -5.2kcal.
Conclusively, the binding of Phe to AroG has an inhibitory effect of PEP binding to AroG.
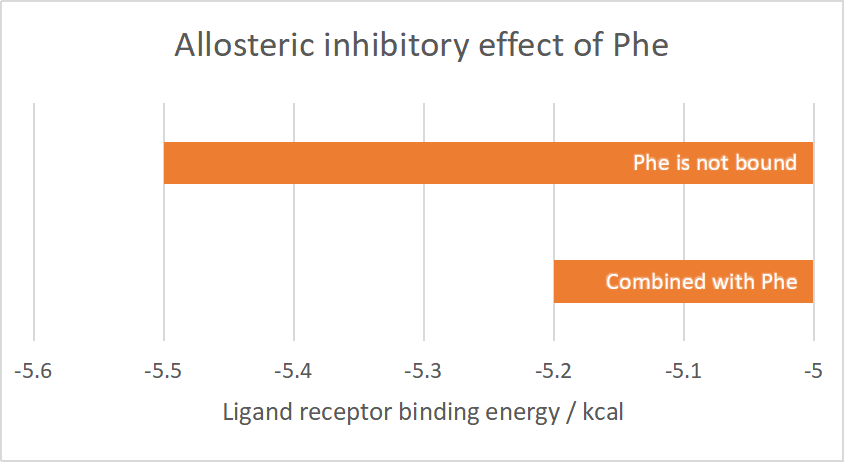
Figure 2.1 Allosteric inhibitory effect of Phe
2.1.2 Effect of point mutations on the catalytic activity of AroG
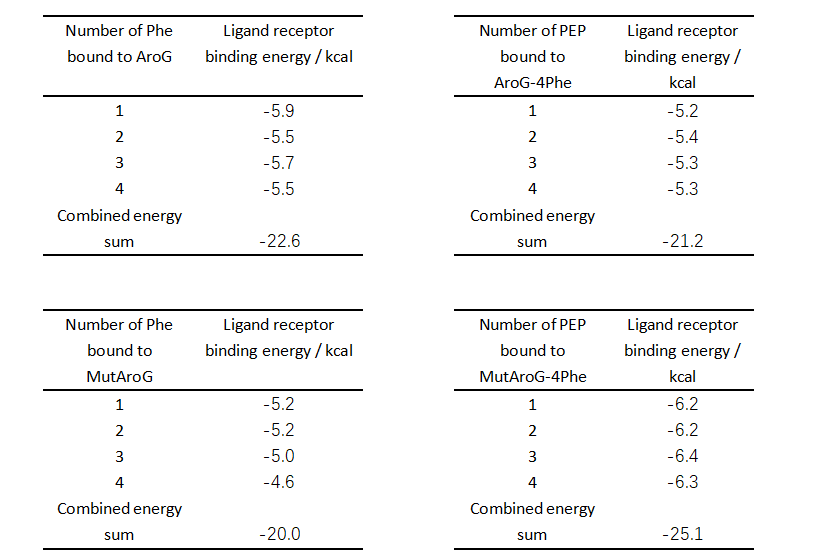
From the comparison of the table data, the binding ability of the mutant aroG and Phe is weaker than that of the wild-type aroG, and the binding ability of the mutant aroG to PEP, in the case that the corresponding site has been combined with Phe, is greatly improved compared to the wild-type aroG.
Therefore, without considering the software simulation docking error, it can be concluded that the Phe allosteric inhibitory effect of mutant aroG is weakened.
2.2 Structure Prediction
2.2.1 The docking results of AroG with Phe and PEP
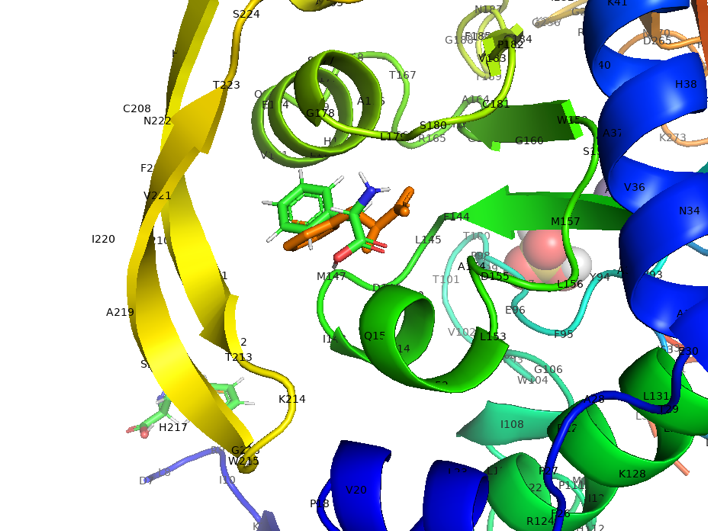
Figure 2.2 Cartoon_docking result of AroG and Phe
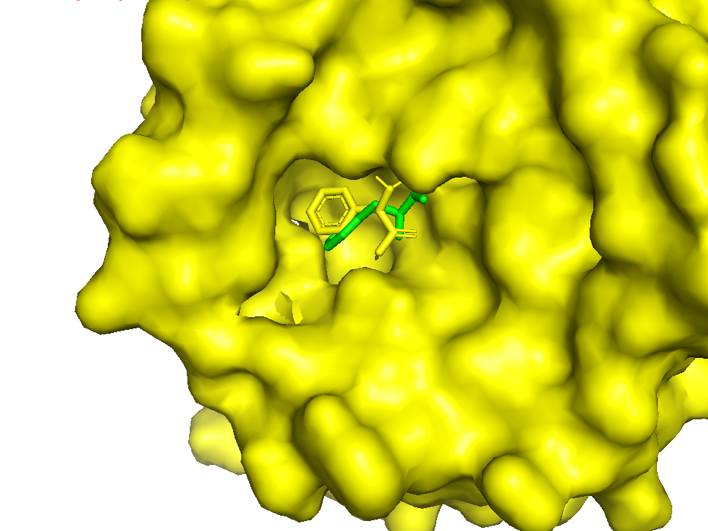
Figure 2.3 Surface_docking result of AroG and Phe
In the figure, the yellow is the experimentally measured conformation of Phe in the crystal protein bound by aroG and Phe, and the green is the docking site and the conformation of Phe predicted by AutoDockTools software. Obviously, the ligand receptor docking site predicted by the AutoDockTools software is completely consistent with the actual site, but there is a slight difference in the conformation of Phe. Therefore, the prediction of binding energy can be more credible.
The following figure shows the docking visualization results of PEP and AroG:
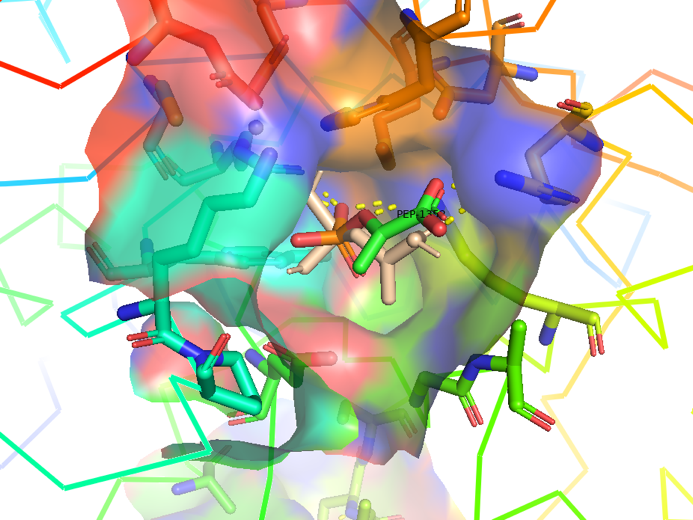
Figure 2.4 Transparent of ligand site_docking result of AroG and PEP
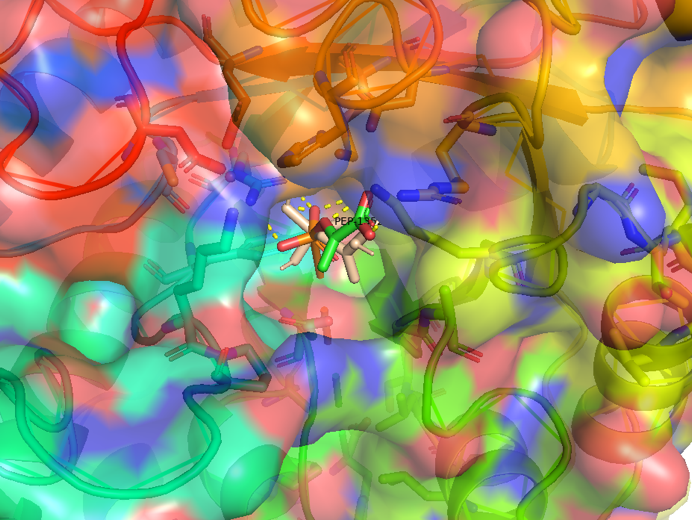
Figure 2.5 Transparent_docking result of AroG and PEP
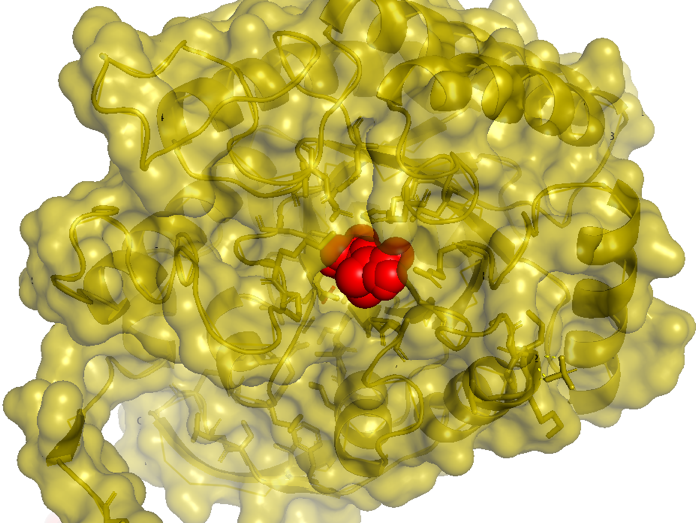
Figure 2.6 Scale model of PEP_docking result of AroG and PEP
2.2.2 Comparison of the wild-type and mutant AroG
PEP site:
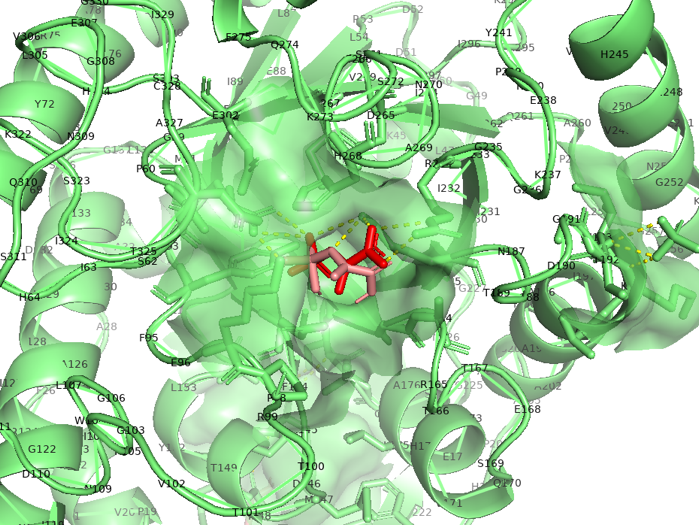
Figure 2.7 Transparent of ligand site_docking result of MutAroG and PEP
According to the docking results, the protein pocket conformation of wild-type and mutant AroG bound to PEP has not changed significantly. The Red is the experimentally measured conformation of Phe in the crystal protein bound by aroG and Phe, and the pink is the docking site and the conformation of Phe predicted by AutoDockTools software. In general, the changes in binding PEP sites are not very significant.
Phe site:
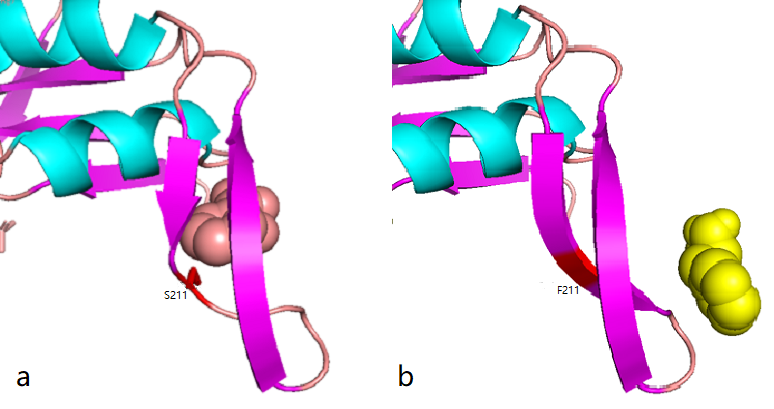
Figure 2.8 Comparison between docking site of Phe, (a)Binding site of wild-type AroG and Phe;(b)Binding site of mutant AroG-S211F and Phe, in which mutant site is shown as red
It can be seen from the docking results that the Ser at AroG 211 mutating to Phe changes the conformation of the protein pocket which originally binds to Phe, and the binding site of Phe changes accordingly. The binding energy calculated by AutoDockTools software shows that the binding ability of mutant aroG and Phe becomes weaker. Therefore, it can be concluded that the conformation of the mutant aroG and Phe binding protein pocket changes, so that the binding ability of Phe to it becomes smaller, and the allosteric inhibition effect of Phe is reduced, finally the catalytic efficiency of aroG on PEP increases.
Concrete methods, results, analysis and other addition information are shown in our wiki: Team:XJTU-China/Protein Modeling.
3. Construction and Verification of aroG Circuit
aroG S211F gene was chemically synthetized by Genewiz and cloned into pET28a+ backbone by Golden Gate assembly (BsaI). After transformed into E.coli DH5alpha, plasmid extraction and electrophoresis, PCR amplification and sequencing were conducted to confirm its correctness. The results are listed in Fig. 3.1

Fig. 3.1 The DNA agarose gel electrophoresis result of AroG-S211F circuit, plasmid and PCR product. (a) The length of the circuit is 2503bp (b) The length of the plasmid is 4738bp. And the two discrete bands are thought as either open-coiled or super-coiled plasmids (c)The amplicon is expected to be 2526bp.
Meanwhile, the quantitatively assay by RT-qPCR was also performed to verified its mRNA level. As shown in Fig. 3.2, the transcriptional level was increased about two folds after IPTG induction, indicating the circuit was successfully constructed with functional aroG mutant. The basal expression of aroG without IPTG induction can be observed due to one copy of native aroG in E.coli genome.

Fig. 3.2 The relative mRNA level of aroG-S211F in DH5alpha strain with Part:BBa_K3832008 inserted in pET28a+ vector.
4.Characterization & Measurement
We have constructed the inducible circuit BBa_K3832008to characterize and measure the function of aroG-S211F, by detecting the yield of tryptophan. Besides, to verify the impact of aroG-S211F to the cell proliferation, we measured the growth curve of the wild-type E.coli and the engineered E.coli with aroG-S211F.
The circuit BBa_K3832008 is inserted into pET28a+ vector. DH5alpha with empty pET28a+ plasmid is used as negative control.
For more information on our methods and results, please see our wiki: Team:XJTU-China/Improvement
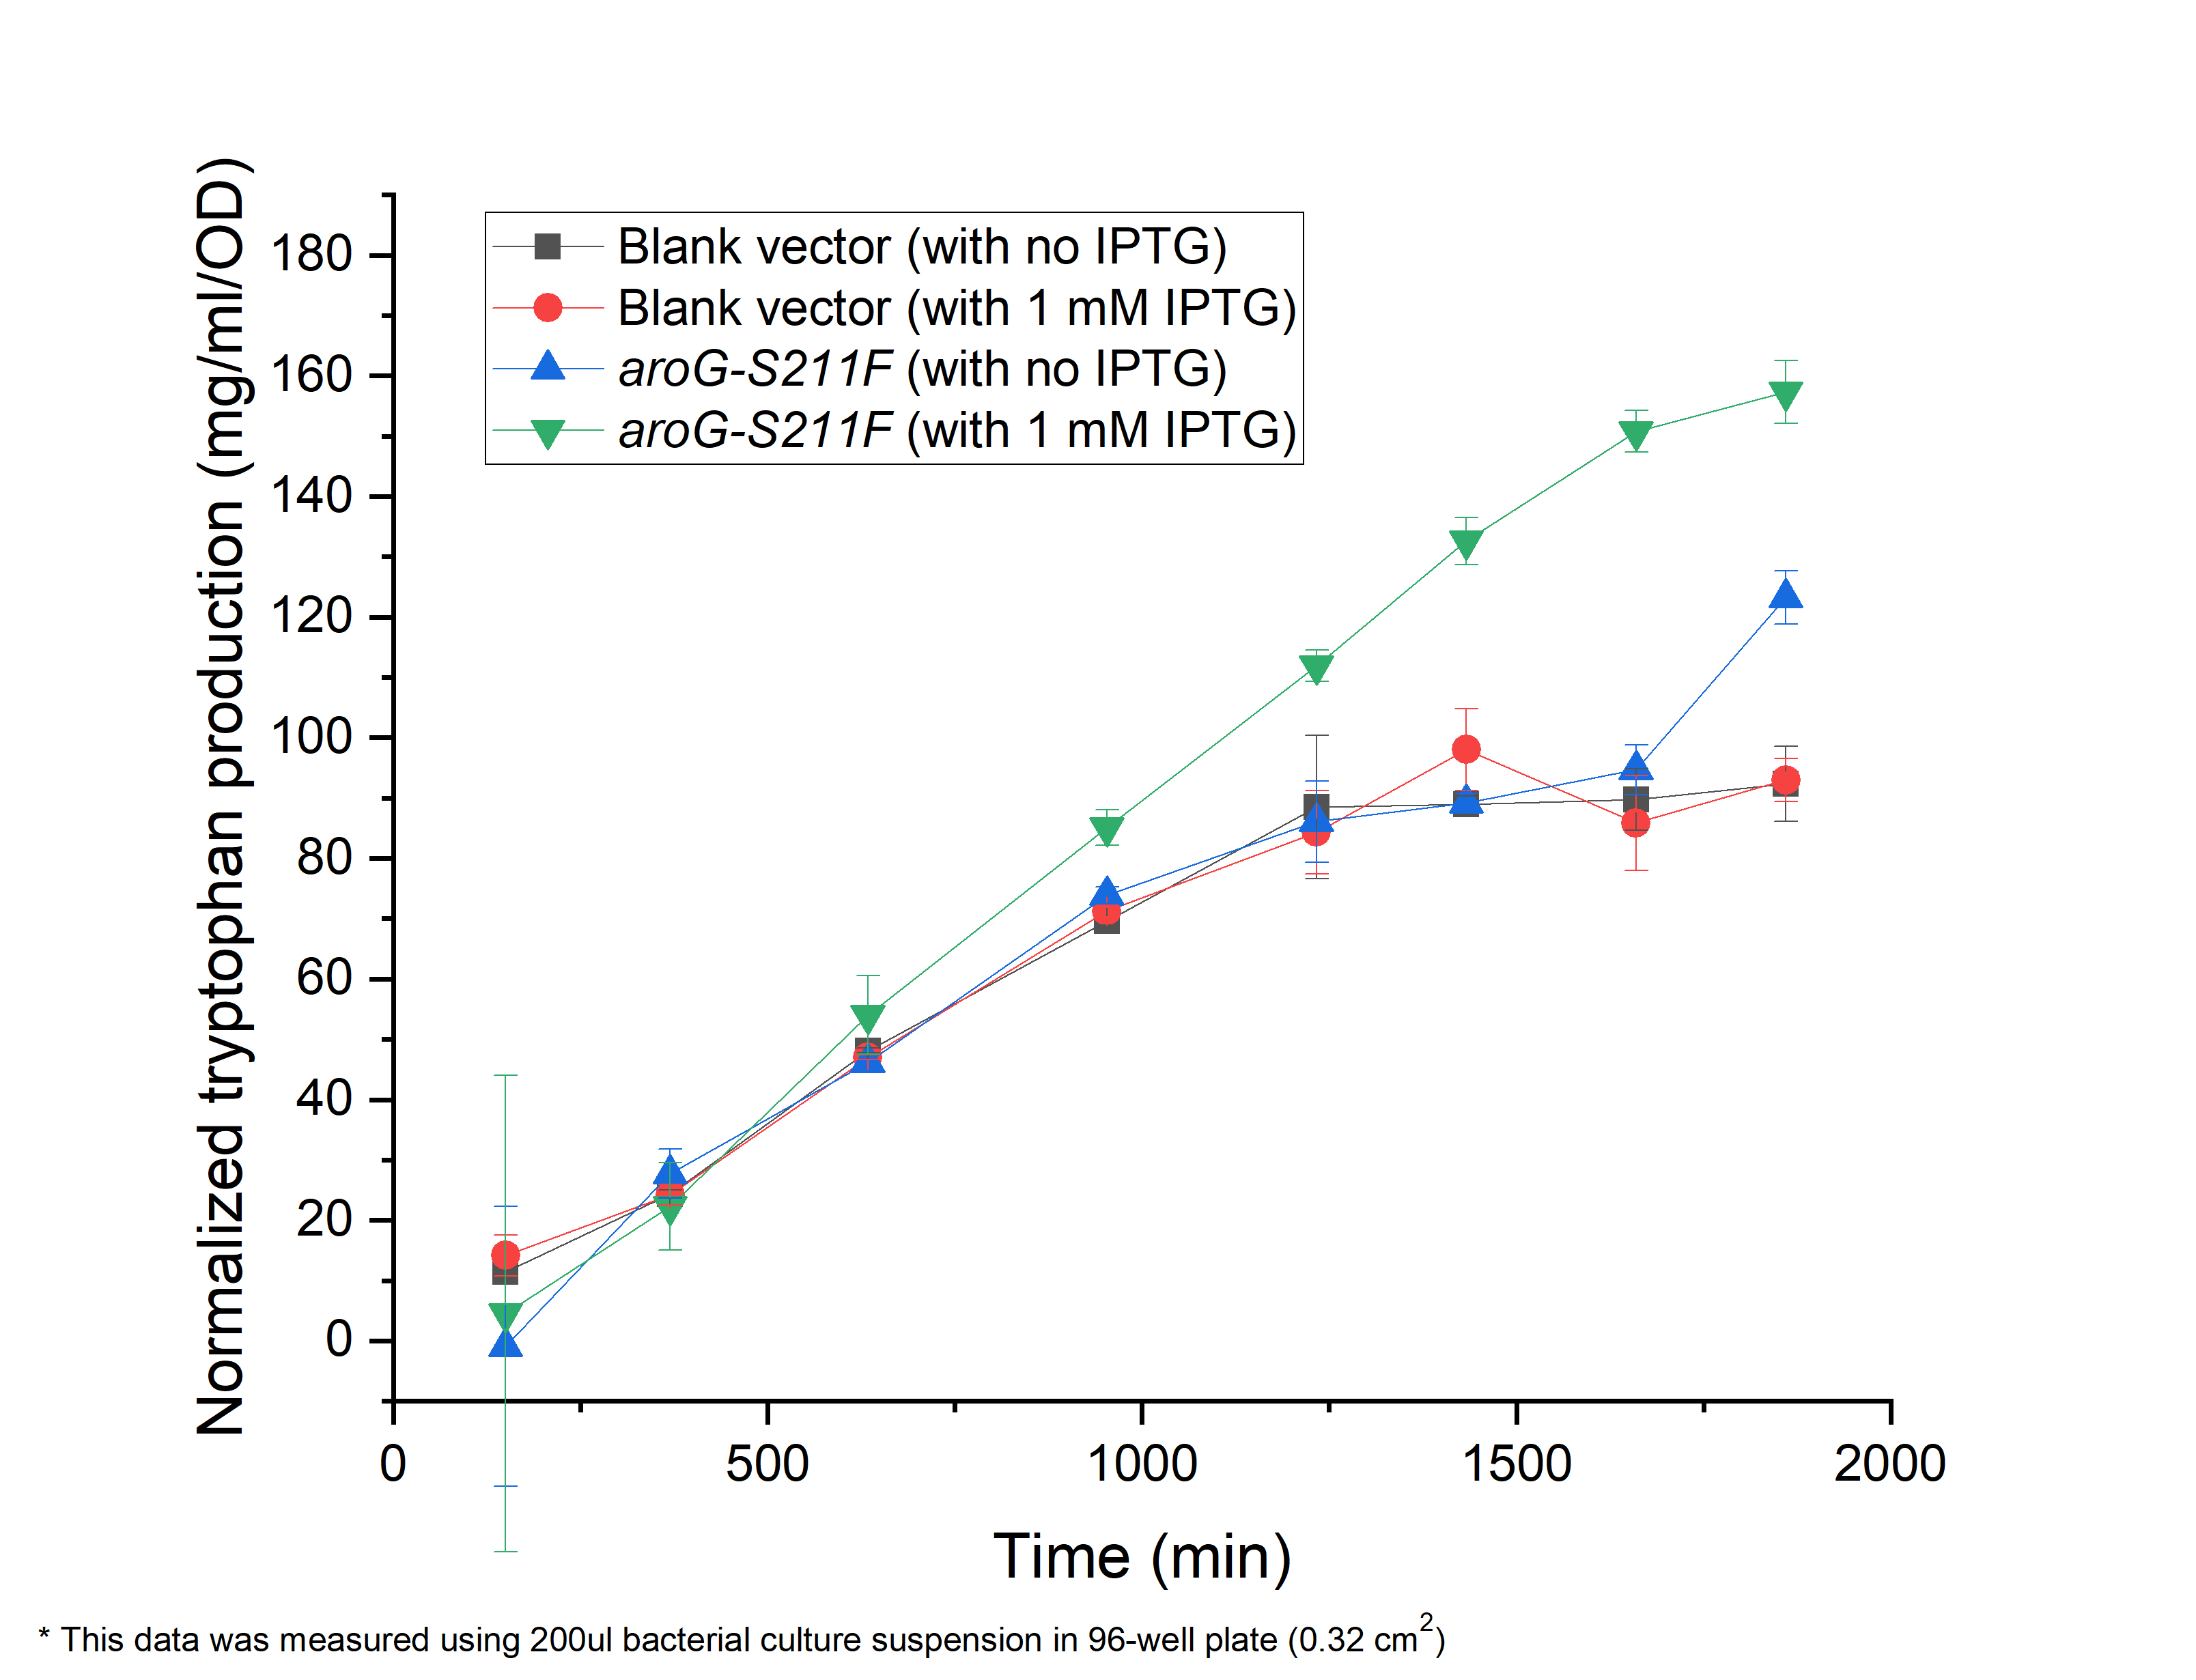
Fig. 3.1 shows the yield of tryptophan. The engineered E.coli with aroG-S211F induced by 1mM IPTG resents a increased production of tryptophan, comparing in absent of IPTG or aroG-S211F (E.coli with blank pET28a+ vector).
Fig. 3.1 The relationship between tryptophan concentration in culture medium and culture time. The concentration of tryptophan is measured by PDAB chromogenic method.
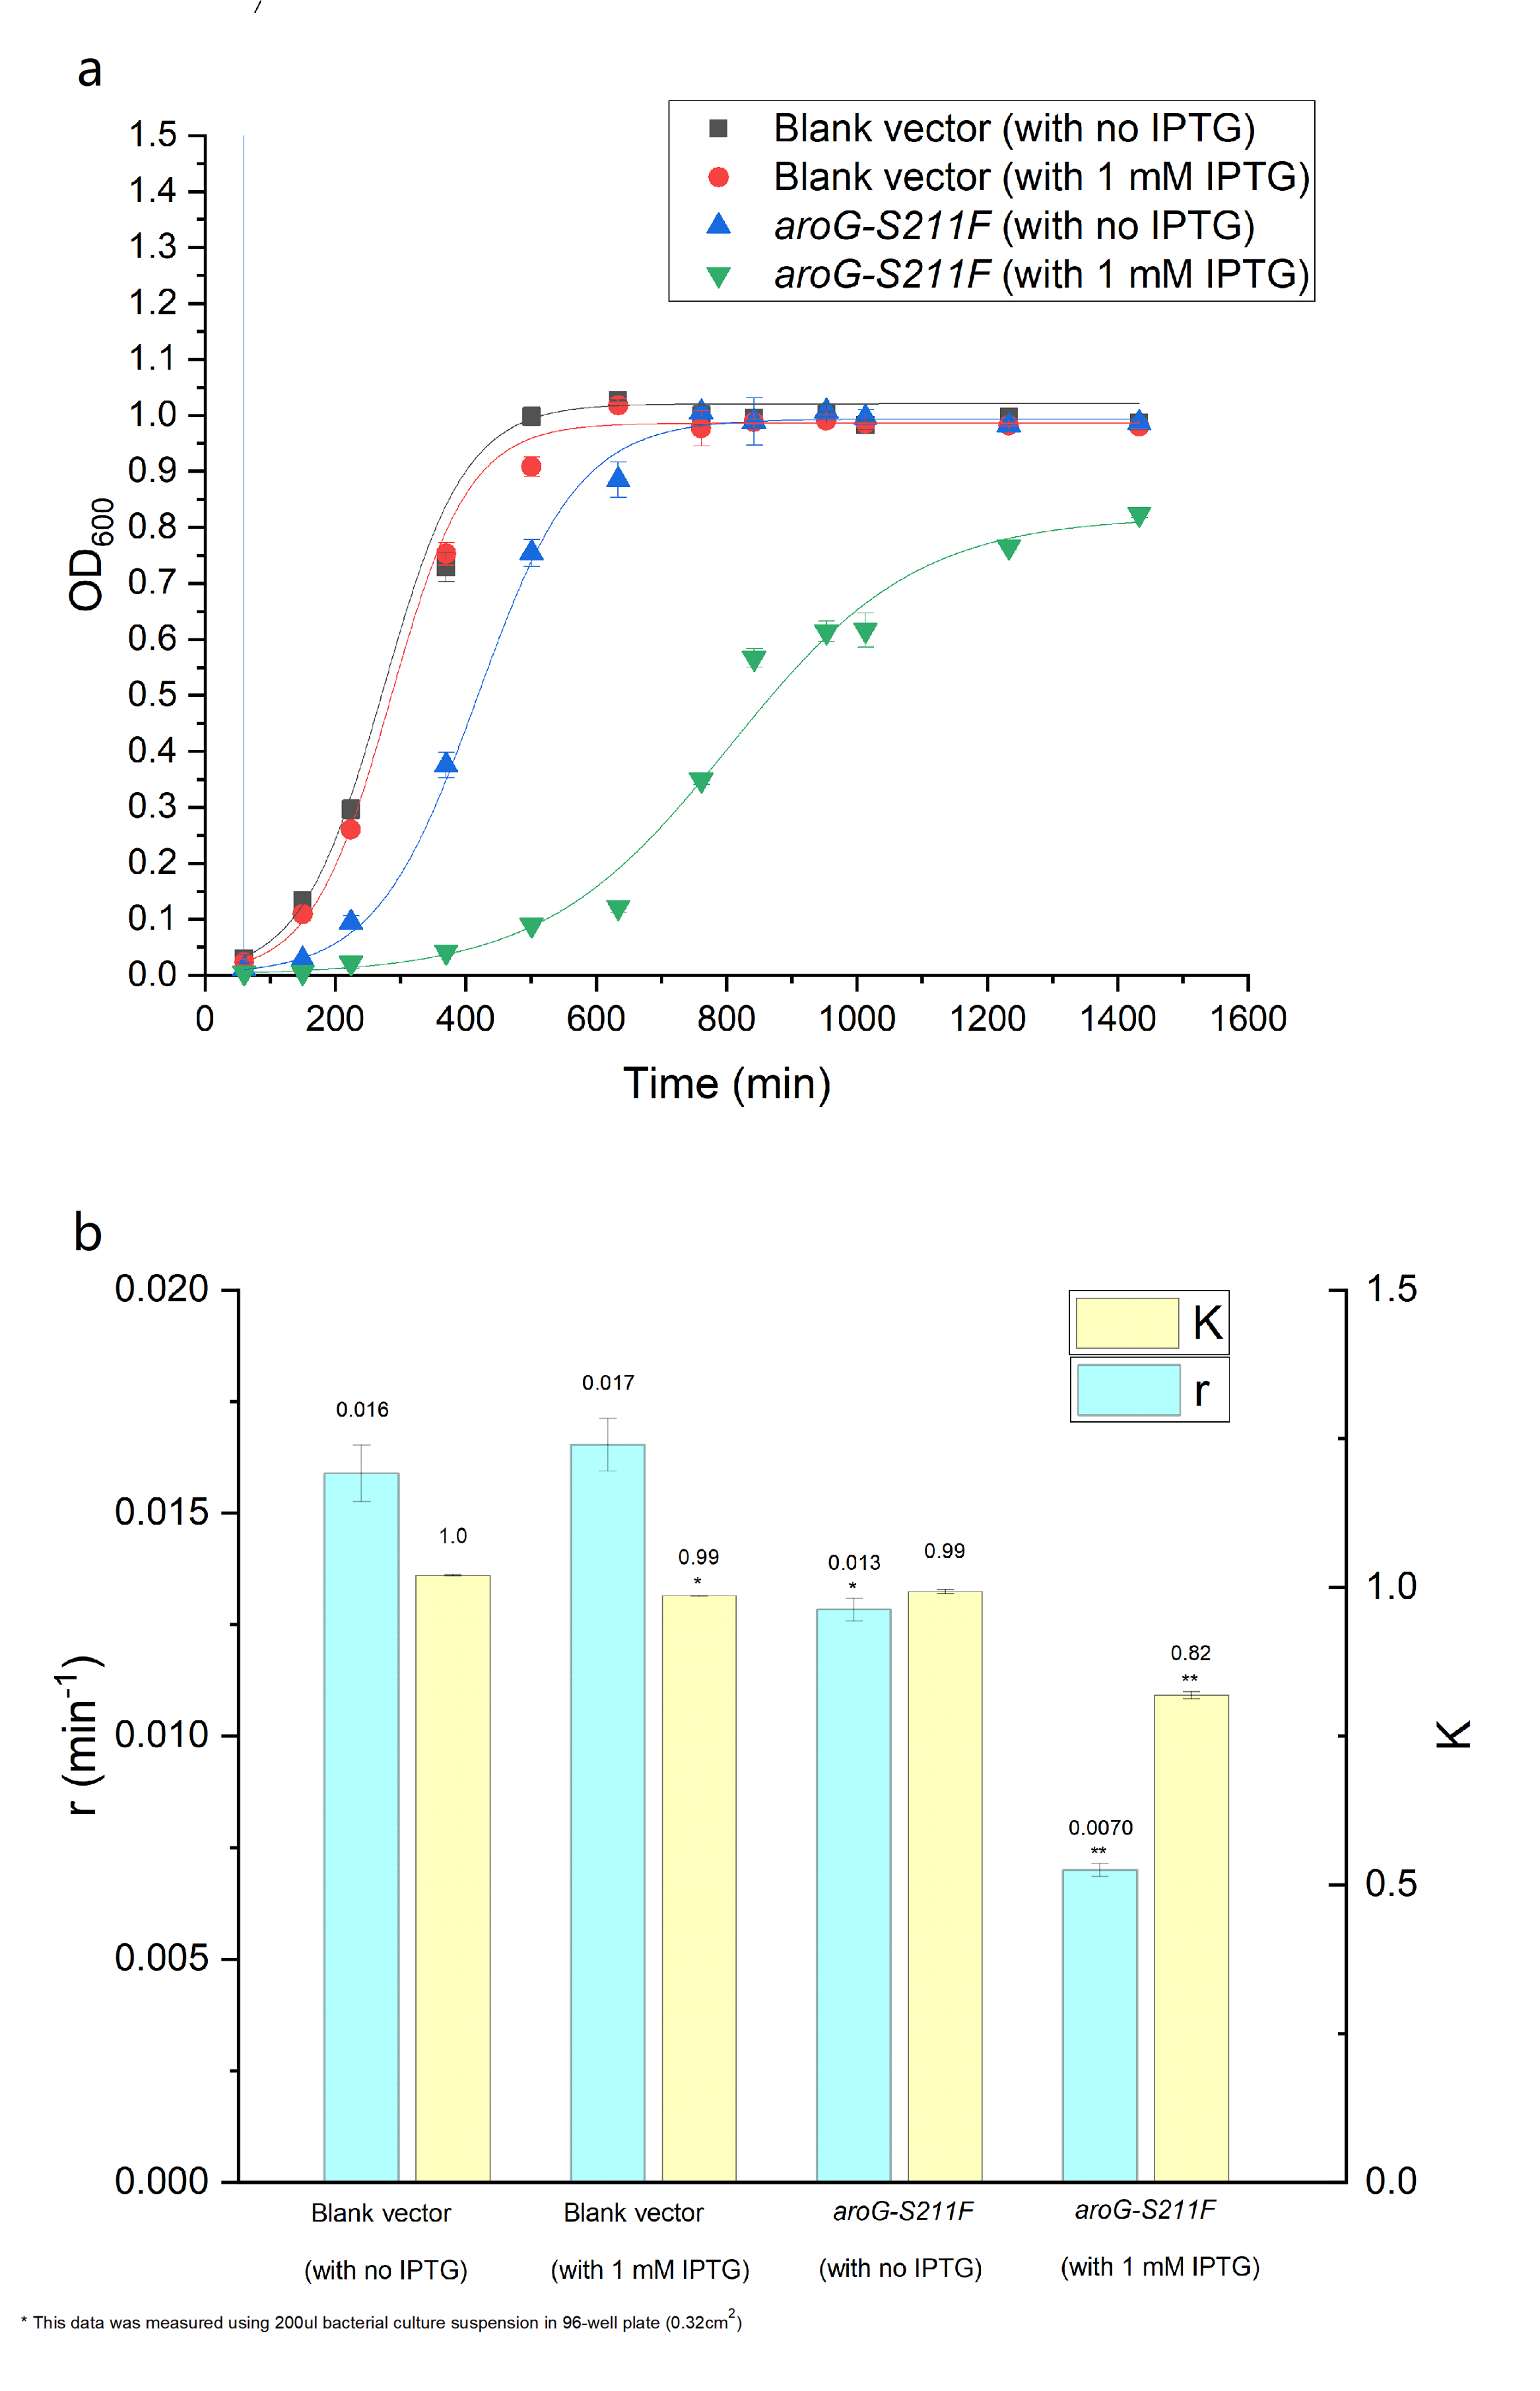
As is showed in Fig. 3.2, by using the Logistic equation to fit the growth curve, the inhibitory effect of aroG expression on cell proliferation was verified (as the parameter r decreased in E.coli with aroG-S211F and induced by IPTG, which represents the reciprocal of the time it takes for the population to double).
Fig. 3.2 (a) The population density of E.coli was measured at 600nm by colorimetry. The scatter represents the result of the measurement. The Logistic equation was used to fit the growth curve, and the fitting results were shown in the curve. (b) shows the growth parameters K (environmental capacity) and r (intrinsic growth rate) of different experimental groups obtained from the fitting results in (a).
Here DH5alpha with empty vector has been used as the control, which can represent the function and character of wild-type aroG(BBa_K1060000),for this gene is contained in the genome of E.coli.

