Difference between revisions of "Part:BBa K608008"
Night12138 (Talk | contribs) m (Add Tongji_China's works. -- committed by Night12138) |
|||
| Line 51: | Line 51: | ||
The results of this test show that PR2 is 7.9 times stronger than PR3, which has the lowest expression. The fluorescence intensity of GFP varies, and because of lack of time we could not repeat this experiment. We have also tested the promoter and RBS activity with RFP as a reporter and the results deviate from this experiment. So we are looking forward to test this system another time. | The results of this test show that PR2 is 7.9 times stronger than PR3, which has the lowest expression. The fluorescence intensity of GFP varies, and because of lack of time we could not repeat this experiment. We have also tested the promoter and RBS activity with RFP as a reporter and the results deviate from this experiment. So we are looking forward to test this system another time. | ||
| + | <h1><b>Tongji_China 2019 Characterization</b></h1> | ||
| + | Our team tested the GFP fluorescence intensity and positive rate of PR3, PR5 and PR6 in E. coli Top 10 with a flow cytometry fluoresce (CytoFLEX LX, Beckman Coulter). | ||
<br/> | <br/> | ||
| + | <b>Protocol:</b> | ||
<br/> | <br/> | ||
| − | + | 1.The plasmids obtained from 5L,5M,5O,plate 1, are respectively used to transform the top 10 strains and coated on the LB plate with chloramphenicol.The kana resistant plasmid pET-28a(+) is transformed into the top 10 strain, which is coated on the LB plate with kana as a negative control. The strain is cultured overnight at 37°C. | |
<br/> | <br/> | ||
| + | 2.Pick 3 colonies each plates and culture them in 5 mL LB medium with chloramphenicol 12 hours. | ||
<br/> | <br/> | ||
| + | 3.4800 rmp/min centrifugate 10 minutes,using 1.5 mL PBS to dilute the sediment. | ||
| + | <br/> | ||
| + | 4.Using the negative process control sample, adjust forward-scatter and side-scatter voltages to place the strong cell peak as close to the center of the detector range as possible. | ||
| + | <br/> | ||
| + | 5.Instrument gating should be set to ensure that no cell events are discarded. | ||
| + | <br/> | ||
| + | 6.95% negative control samples’ GFP B525-FITC-A values are less than 104.Regard those samples the GFP B525-FITC-A values more than 104 are positive. | ||
| + | <br/> | ||
| + | 7.Collect at least 5000 events per sample. | ||
| + | <br/> | ||
| + | <b>Summary:</b> | ||
| + | The results of this test show that in E. coli Top 10, PR5 has the highest GFP fluorescence intensity among PR2, PR5 and PR6. | ||
| + | |||
[[File:T--Tongji_China--BBa_K608008%2611%2612_Characterization_Fluorescence_Intensity.png|right|400px|thumb|Characterization result of BBa_K608008, BBa_K608011 and BBa_K608012, on fluorescence intensity. ]] | [[File:T--Tongji_China--BBa_K608008%2611%2612_Characterization_Fluorescence_Intensity.png|right|400px|thumb|Characterization result of BBa_K608008, BBa_K608011 and BBa_K608012, on fluorescence intensity. ]] | ||
| Line 118: | Line 135: | ||
[[Image:BWOB_K608008_A600.jpg |400px|]] | [[Image:BWOB_K608008_A600.jpg |400px|]] | ||
| − | |||
| − | |||
| − | |||
| − | |||
| − | |||
| − | |||
| − | |||
| − | |||
| − | |||
| − | |||
| − | |||
| − | |||
| − | |||
Revision as of 07:08, 21 October 2019
constitutive strong promoter with medium RBS and GFP
Strong promoter from the constitutive promoter family combined with medium RBS (PR2) for strong gene expression. To quantify the gene expression, GFP was tagged to the promoter and RBS domain.
The GFP fluorescence was measured with a plate reader:
The fluorescence intensity and protein concentration were measured with the FLUOstar Omega,
which is a multi-mode microplate reader.
Samples were pipetted into the microplate and analyzed via the plate reader. In this experiment we focused on the protein concentration and the fluorescence intensity of RFP.
We measured the protein concentration with the bradford-assay. This is a method to determine the total protein concentration. To analyze the protein concentration of the samples, Coomassie Brillant Blue was pippeted to each sample. With the binding of the dye to the proteins the color changes from dark red to blue. The more protein in the solution the more Coomassie dye can bind to proteins and the more the color changes into blue. The absorption of bound Coomassie dye is 595nm. The absorbance is proportional with the amount of bound dye. With a series of Bovine Serum Albumin (BSA) measurements the exact protein concentration of the samples can be determined. BSA acts like a “marker” because the concentration of BSA is known and with a linear calibration line the exact protein concentration can be detected.
GFP served as a reporter of expression. We wanted to know how strong the promoter and RBS activity is. With this reporter gene it was possible to analyze the expression via plate reader. GFP is excited at a wavelength of 509nm and has an emission of 520nm. The plate reader illuminates the samples with a high energy xenon flash lamp. Optical filters or monochromator create the exact wavelength. The more GFP in the sample the higher is the GFP fluorescence intensity. The intensity is collected with the second optical system and is detected with a side window photomultiplier tube.
Promoter and RBS:
PR1: strong Promoter (J23104) strong RBS (B0034)
PR2: strong Promoter (J23104) medium RBS (B0032)
PR3: strong Promoter (J23104) weak RBS (B0031)
PR4: medium Promoter (J23110) strong RBS (B0034)
PR5: medium Promoter (J23110) medium RBS (B0032)
PR6: medium Promoter (J23110) weak RBS (B0031)
| sample | PR2 | PR3 | PR4 | PR5 | PR6 |
| GFP fluorescence intensity | 11378.5 | 1445.0 | 4596.2 | 41221.1 | 26922.7 |
| factor | 7.9 | 1.0 | 3.2 | 28.5 | 18.6 |
The results of this test show that PR2 is 7.9 times stronger than PR3, which has the lowest expression. The fluorescence intensity of GFP varies, and because of lack of time we could not repeat this experiment. We have also tested the promoter and RBS activity with RFP as a reporter and the results deviate from this experiment. So we are looking forward to test this system another time.
Tongji_China 2019 Characterization
Our team tested the GFP fluorescence intensity and positive rate of PR3, PR5 and PR6 in E. coli Top 10 with a flow cytometry fluoresce (CytoFLEX LX, Beckman Coulter).
Protocol:
1.The plasmids obtained from 5L,5M,5O,plate 1, are respectively used to transform the top 10 strains and coated on the LB plate with chloramphenicol.The kana resistant plasmid pET-28a(+) is transformed into the top 10 strain, which is coated on the LB plate with kana as a negative control. The strain is cultured overnight at 37°C.
2.Pick 3 colonies each plates and culture them in 5 mL LB medium with chloramphenicol 12 hours.
3.4800 rmp/min centrifugate 10 minutes,using 1.5 mL PBS to dilute the sediment.
4.Using the negative process control sample, adjust forward-scatter and side-scatter voltages to place the strong cell peak as close to the center of the detector range as possible.
5.Instrument gating should be set to ensure that no cell events are discarded.
6.95% negative control samples’ GFP B525-FITC-A values are less than 104.Regard those samples the GFP B525-FITC-A values more than 104 are positive.
7.Collect at least 5000 events per sample.
Summary:
The results of this test show that in E. coli Top 10, PR5 has the highest GFP fluorescence intensity among PR2, PR5 and PR6.
| Sample | PR2(BBa_K608008) | PR5(BBa_K608011) | PR6(BBa_K608012) |
| GFP Fluorescence Intensity | 24541.23 | 62923.91 | 41902.30 |
| Fluorescence Intensity Factor | 1.0 | 2.6 | 1.7 |
| Positive Rate | 0.7563 | 0.9190 | 0.8579 |
Xiamen_City 2019's characterization
BBa_K608008 constitutive strong promoter with medium RBS and GFP
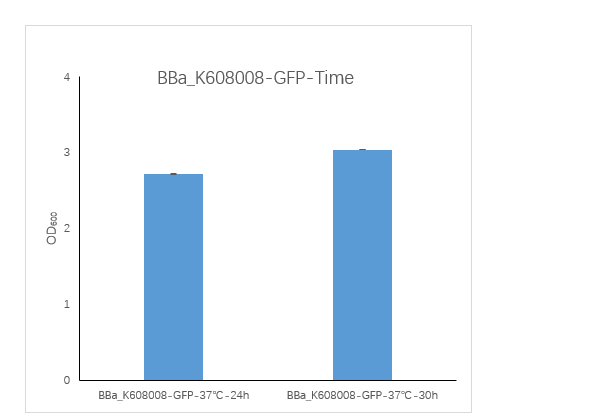
The number of cells in the medium changes with the culture time. We studied this phenomenon by experimenting with changes in culture time.
1. We transformed the plasmid contanining BBa_K608008 into bacterial competent cells, plated and cultured overnight at 37 °C.
2. On the evening of the next day, we picked a single clone into a tube containing 5 ml LB which is called 0h. We culture bacterial cells at 37 ° C, 220 rpm. The sampling time points are 24h and 30h.
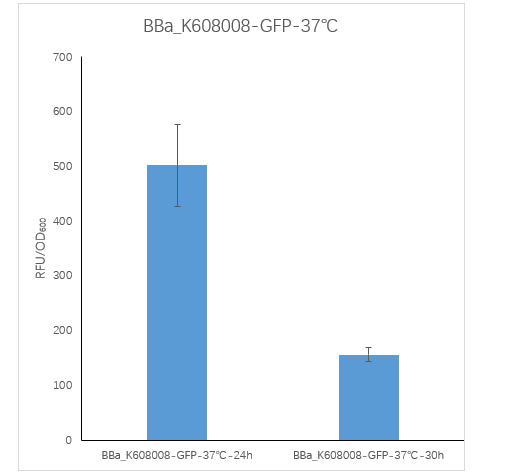
3. We took 100ul of the bacteria culture and measured the total fluorescence with a Thermo fluorescence microplate reader. We took 200ul of the ten-fold diluted bacterial solution and measured the OD600 with BioTek optical microplate reader. Total fluorescence is divided by OD600 to obtain fluorescence value per OD600.
Figure1. BBa_K608008 containing strain OD600 at 24h and 30h.
We measured the OD600 of the strain at 24h and 30h, respectively. The OD600 at 24h is 2.725 ,which is slightly lower than the OD600 3.04 at 30h.
Figure2. BBa_K608008 containing strain Fluorescence per OD600 at 24h and 30h.
We measured the RFU/OD600 of the strain at 24h and 30h, respectively. The RFU/OD600 at 24h is 501.76 ,which is significantly higher than the RFU/OD600 155.59 at 30h.
These results indicate that the bacterial strain in the medium reached the stationary phase at 24h and 30h.
The cell death rate is close to or even higher than the cell division rate, and the cell number remains stable for a certain time and then decreases.. The protein in the cell will only degrade, but will not be newly expressed, resulting in a decrease in protein levels.
Bio Without Borders 2019 Characterization
We compared the fluorescence intensity of this part in overnight cultures of E. coli 5alpha to three others in the series . This composite part has a strong promoter and a weak ribosome binding site controlling the expression of GFP. We compared it to other parts with GFP under a medium promoter with a strong, medium and weak ribosome binding site. The other part numbers were BBa_K608010, BBa_K608011 and BBa_K608012 respectively.
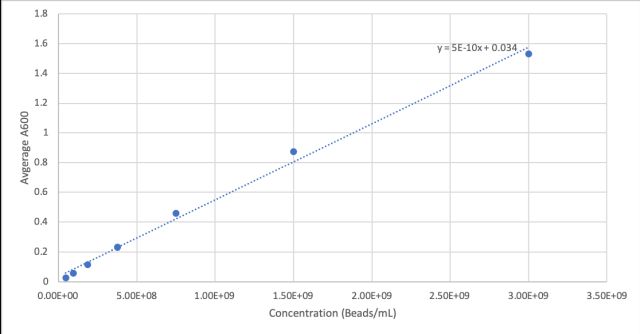
First we measured the cell concentration in the overnight cultures using a spectrophotometer with the wavelength set to A600. We made a standard curve using the beads in the Measurement Kit. Then we diluted the cultures 1:10 to get the readings into the linear part of the range of our spectrophotometer. Cultures were made in duplicate (Tube 1 and Tube 2).


