Difference between revisions of "Part:BBa K523015"
(→ECUST_China 2019 Charaterization) |
(→ECUST_China 2019 Charaterization) |
||
| Line 50: | Line 50: | ||
Figure3: CenA Enzyme Activity Curve varying temperatures and pHs | Figure3: CenA Enzyme Activity Curve varying temperatures and pHs | ||
| − | <html><img style="width:500px;padding-left: | + | <html><img style="width:500px;padding-left:80px;" src="https://2019.igem.org/wiki/images/4/47/T--ECUST_China--parts_cenAcurve.png"> </html> |
Revision as of 08:34, 20 October 2019
Plac + RBS + cenA (endoglucanase)
This is C. fimi endoglucanase under the control of the Lac promoter. This was made by Edinburgh 2008 but vector-swapped into pSB1C3 and entered into the Registry by Edinburgh 2011.
Sequence and Features
- 10COMPATIBLE WITH RFC[10]
- 12INCOMPATIBLE WITH RFC[12]Illegal NotI site found at 658
Illegal NotI site found at 1802 - 21INCOMPATIBLE WITH RFC[21]Illegal BglII site found at 1715
Illegal BamHI site found at 851
Illegal XhoI site found at 1213
Illegal XhoI site found at 1462 - 23COMPATIBLE WITH RFC[23]
- 25INCOMPATIBLE WITH RFC[25]Illegal NgoMIV site found at 993
Illegal NgoMIV site found at 1918 - 1000INCOMPATIBLE WITH RFC[1000]Illegal BsaI site found at 897
ECUST_China 2019 Charaterization
Team ECUST decided to further work with the part BBa_K523015, which consists of Lac promoter RBS and endoglucanase from C. Fimi. We characterized the enzyme activities of CenA within cells via CMC-Na and DNS assays, hoping to obtain a enzyme activity curve of varies pH and temperatures. And here are the experiments and results. All assays, including the standard curve were performed for more than three times.
Part 1: Preparations
1. CMC-Na solution of different pH: CMC-Na was added into PBS buffer to reach 1% WV. Take 100 mL pH=6 CMC-Na solution as an example, firstly 1g CMC-Na was added into approximately 90mL PBS buffer, and then pH was adjusted by Potassium Phosphate and Potassium Phosphate monobasic to pH=6. After pH adjustments, the final volume of the solution was metered to 100mL. Same thing applied for pH=7 CMC-Na solution. 2. DNS Solution(1L): We dissolved 10g 3,5-dinitrosalicylic acid into an appropriate amount of distilled water, then slowly added 16g sodium hydroxide, and then gradually dissolved 300g potassium and sodium tartrate, next, made the final volume up to 1 liter. We then preserved this solution into a brown reagent bottle and placed it for a week, precipitants should be filtered for future use.
Part 2: Glucose-DNS Standard Curve
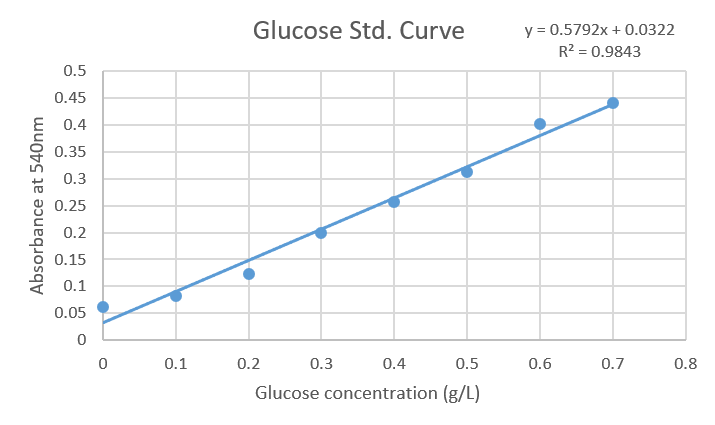
A standard curve of glucose was obtained ranging from 0.1 to 0.7 g/L. In order to reveal the reaction DNS was added and absorbance at 540 nm was measured. Finally, data was analyzed in a spreadsheet, plotted to obtain the equation (y = 0.5792x + 0.0322) with a correlation factor equal to 0.9843.
Figure1:Standard curve of Glucose concentrations against Absorbance at 540nm

Part 3: CMC-Na Assay
The biobrick was transformed into E. coli strain BL21 (DE3) and positive clones were selected by Cm antibiotics. Due to the characteristics of E.coli, recombinant proteins are scarcely transported out of cells, so we decided to measure the enzyme activity of lysed cells.
Positive clones were further inoculated overnight in 4 mL LB broth with proper antibiotic (chloramphenicol-Cm) concentration. The next day, we transfered 1 mL culture to 100mL LB in a 37℃ shaker proper antibiotics added. For approximately 3hrs, O.D. of cell growth was measured, until it reached 0.6, we induced with IPTG of 0.1mM final concentration. After 4 hours, the whole culture medium was spun down at 4000 rpm for 10 minutes at 4℃. After that, we re-suspended the 1oomL cell pellet with 10 ml PBS buffer. We then used Sonication to lyse cells, finally another centrifugation of 1200rpm for 10 minutes at 4℃ to discarded all non-soluble parts of cells and supernatant was collected as crude CenA solution.
The assays were incubated at 19 °C, 26°C, 37°C, 46°C and each for two reactions of pH6 and pH7. Based on literature, In a microtube 18μL of 1% CMC-Na was added, followed by 2μL crude CenA and the mix was incubated for 1 hour. To stop and reveal the reaction 30 μL of DNS were added, after 1 hour of 99°C incubation, absorbance at 540 nm was determined. For negative control, we performed contrast reactions at the same time, but it was reacted at the temperature below 4°C so that the enzyme activity was inhibited.
At last, activity was calculated dividing μM of substrate between time of assay. Results are shown in the chart below and plotted as enzyme activity curve. As seen in the graphic of temperature against activity, the enzyme activity of pH6 is relatively higher than that of pH7, and higher temperature seems to have positive influence on enzyme activity is 30 °C and 37°C can be concluded as the optimal temperatures due to a higher activity but in table it can be discerned that 30°C presented higher activity.
Figure2: Chart of CenA Enzyme Activity

As seen in the graph of temperature and pH against activity, the enzyme activity of pH6 is relatively lower than that of pH7, and higher temperature seems to have positive influence on enzyme activity: 37°C can be concluded as the optimal temperatures for our fermentation and cellulose decomposition process due to it is also a relatively growth fitness temperature for E.coli.
Figure3: CenA Enzyme Activity Curve varying temperatures and pHs

