Difference between revisions of "Part:BBa K2912015"
Mackintosh (Talk | contribs) (→Usage and Biology) |
Mackintosh (Talk | contribs) (→Usage and Biology) |
||
| Line 23: | Line 23: | ||
<div> | <div> | ||
| − | <center><html><img src='https://2019.igem.org/ | + | <center><html><img src='https://2019.igem.org/wiki/images/8/87/T--SZU-CHINA--fig._2.png' style="width:50%;margin:0 auto"> |
<center> Fig.2 OD600 of two different treated T7 promotor_lysis samples </center></html></center> | <center> Fig.2 OD600 of two different treated T7 promotor_lysis samples </center></html></center> | ||
</div> | </div> | ||
| Line 32: | Line 32: | ||
<div> | <div> | ||
| − | <center><html><img src='https://2019.igem.org/ | + | <center><html><img src='https://2019.igem.org/wiki/images/1/14/T--SZU-CHINA--fig._3.png' style="width:50%;margin:0 auto"> |
<center> Fig.3 Scatter plots of survival rates among groups treated with different tryptophan concentration </center></html></center> | <center> Fig.3 Scatter plots of survival rates among groups treated with different tryptophan concentration </center></html></center> | ||
</div> | </div> | ||
| Line 39: | Line 39: | ||
<div> | <div> | ||
| − | <center><html><img src='https://2019.igem.org/ | + | <center><html><img src='https://2019.igem.org/wiki/images/4/4e/T--SZU-CHINA--fig._4.png' style="width:50%;margin:0 auto"> |
<center> Fig.4 growth of Trp_lysis E.coli under different treated </center></html></center> | <center> Fig.4 growth of Trp_lysis E.coli under different treated </center></html></center> | ||
</div> | </div> | ||
<div> | <div> | ||
| − | <center><html><img src='https://2019.igem.org/ | + | <center><html><img src='https://2019.igem.org/wiki/images/4/43/T--SZU-CHINA--fig._5.png' style="width:50%;margin:0 auto"> |
<center> Fig.5 growth of T7 promotor_lysis E.coli under different treated </center></html></center> | <center> Fig.5 growth of T7 promotor_lysis E.coli under different treated </center></html></center> | ||
</div> | </div> | ||
Revision as of 18:53, 17 October 2019
Trp_Lysis gene
Trp_Lysis gene expression can be controlled by the concentration of Tryptophan
Sequence and Features
- 10COMPATIBLE WITH RFC[10]
- 12INCOMPATIBLE WITH RFC[12]Illegal NheI site found at 7
Illegal NheI site found at 30 - 21COMPATIBLE WITH RFC[21]
- 23COMPATIBLE WITH RFC[23]
- 25COMPATIBLE WITH RFC[25]
- 1000COMPATIBLE WITH RFC[1000]
Usage and Biology
The lysis gene from colicin-producing strains of bacteria encodes the lysis protein which is only 4872Da in molecular weight and performs two functions that are instrumental to the activity of Colicin E7 (ColE7):one of its function is to Release of ColE7 from ColE7—Immunity complex and the other is Partial lysis of host cell membrane, which means that once the protein is produced and activated, the protein can cause the host cell to lyse.
On the basic of its special biological function, it's likely to use lysis protein as a cellular structure breaker. In this year, our team decided to add a Tryptophan attenuator between a RBS and the lysis gene, making it possible to switch off or switch on the lyse metabolism by controlling the tryptophan concentration of medium, so that the lysis protein can better serve in our project when we need to break our engineering cells to extract our product.
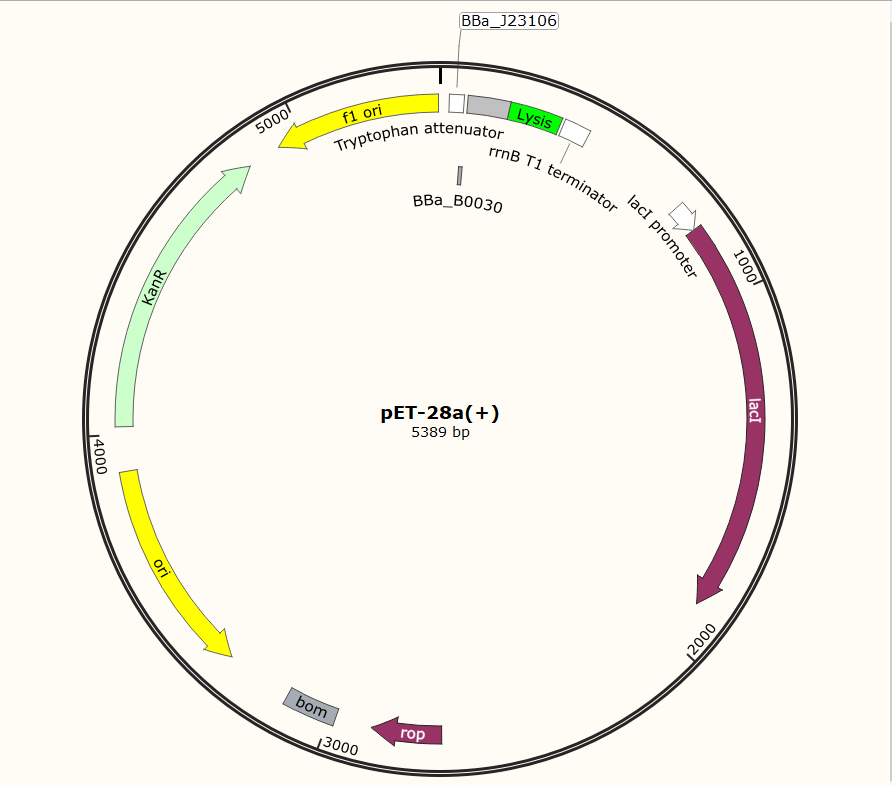
SZU-China 2019 iGEM team constructed a plasmid with BBa_K1475900 (Promoter), BBa_K2912014 (Attenuator), BBa_K117000(lysis), BBa_K3257020(terminator).

Before the official experiment of Trp_Lysis gene. We have done the T7 promotor_lysis gene characterization experiment with IPTG inducing in LB liquid medium(illustrated with Fig.2).

According to the characterization experiment's result, we can draw a conclusion that once the lysis protein is produced by IPTG inducing, their growth will be significantly inhibited.
In our next step, we transformed the expression vector into HT115 (DE3) E.coli by heat-shock method, culturing in LB liquid medium to exact exponential phase, and then moved to another new LB liquid medium with different concentration of tryptophan ,starting a eight-hour cell growth curve experiment of our engineering E.coli and then we measure the OD600 of each groups every two hours. Finally, we can calculated their survival rate by use OD600 of the experimental group divided by OD600 of the blank group (illustrated with Fig.3).

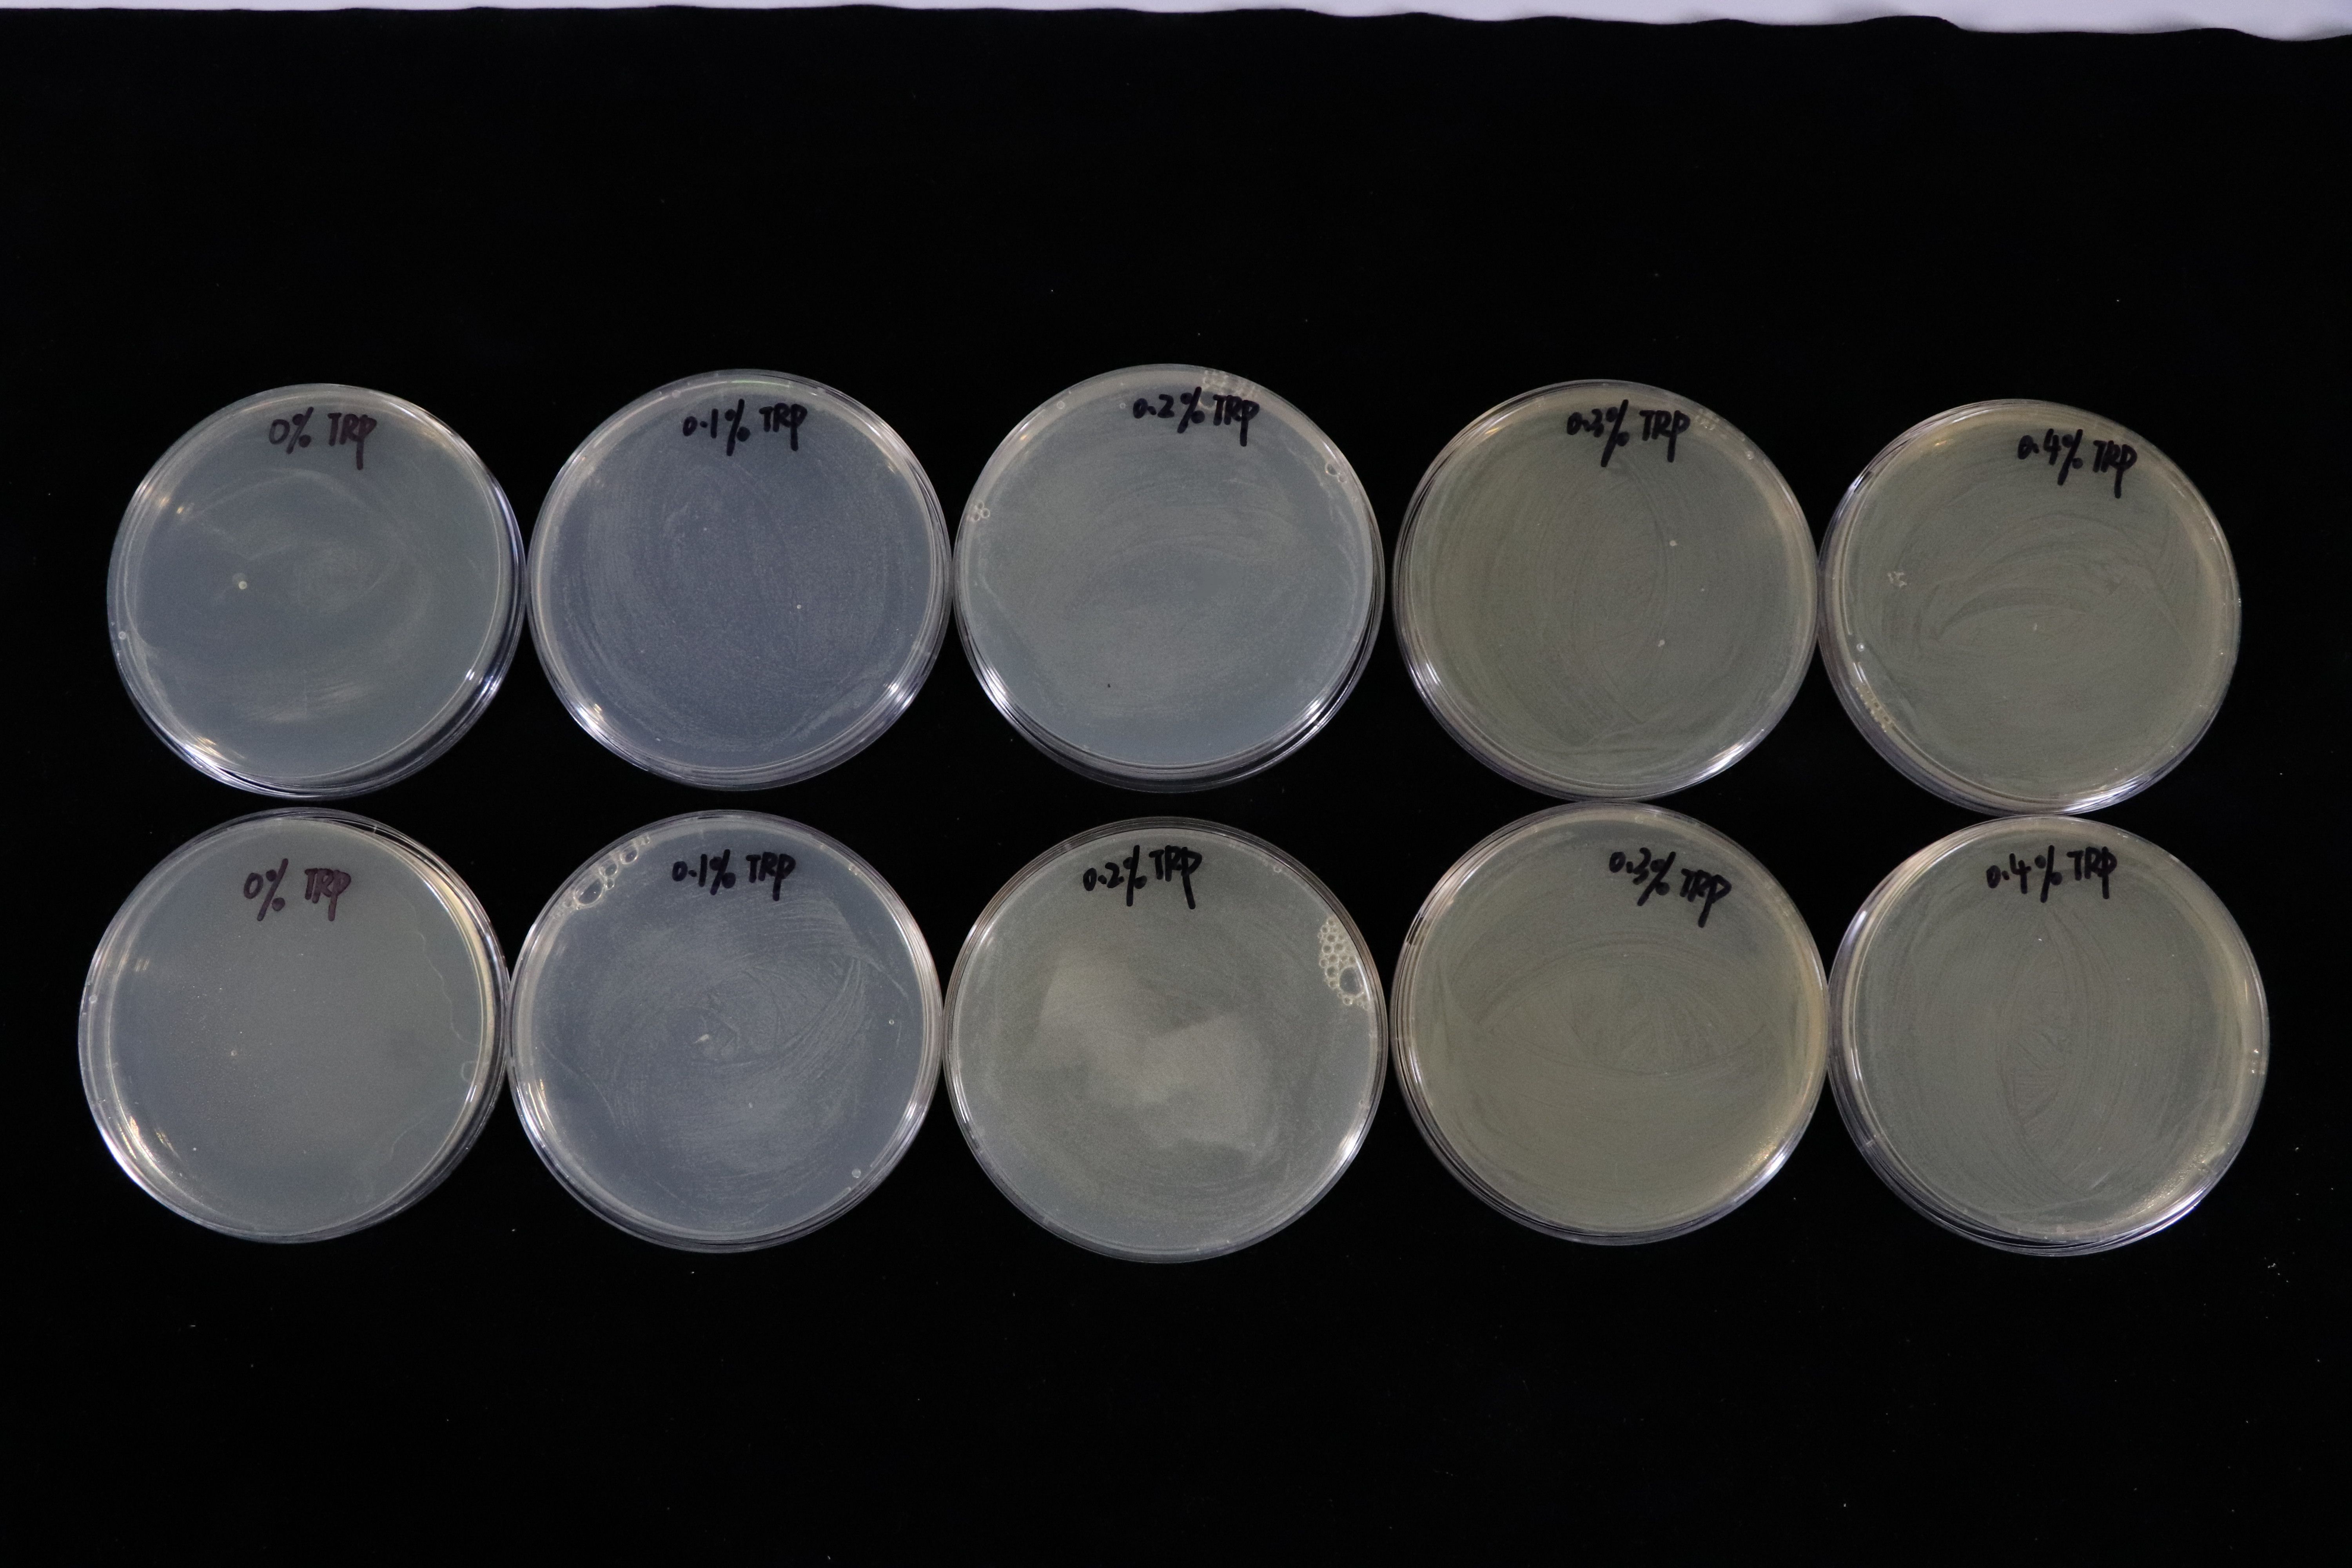
Besides, we also did a culturing in LB solid medium experiment in tryptophan concentration gradient.(illustrated with Fig.4)


In contrast with T7 promotor_lysis with IPTG inducing group(illustrated with Fig.5). The Trp_Lysis metabolism obviously has the advantage which is able to kill the host cell by breaking their structure in a controlled way. In other words, we can switch off or switch on the killing metabolism by controlling the tryptophan concentration of the culture medium, and the result indicates that the concentration critical valve is around 0.3% which mean that if the concentration is more than 0.3%, the killing metabolism will be closed so that the host cells can grow as usual.
